SQL Server Reporting Services, also called SSRS, is one of the popular Business intelligence tools. With this SSRS Tutorial, you can create interactive charts, Maps, Sparklines, indicators, tabulars, tables, and matrices from Relational, XML, Excel, and Multidimensional sources. Apart from the mentioned report type, snapshot, drill through, and paginated reports are also covered in this tutorial.
Learn some basics on sql server, at least Select Statements, and it helps you to understand this SSRS reporting services tutorial. Before you start practicing, I suggest you download Adventure Works and Adventure Works dw databases. These are the two databases we use in this entire SQL Server Reporting Services example.
Although SSRS business intelligence tools reporting is the most powerful tool for creating data analytics, you can quickly learn this tool tutorial in 28 days (Maximum). To design reporting, develop, deliver services, manage the charts, or learn Microsoft SSRS tutorial, you need Visual Studio, Report Builder, BIDS, or Sql Server Data Tools software.
In the early days, BIDS (business intelligence development studio) was the most popular report designer to work with SSRS tutorials. However, it was discontinued and replaced by SSDT. So, to understand this, download and install SSDT and configure it properly for deployment.
What is SSRS, and why is it used?
Microsoft SSRS provides various services and tools to design, manage, and deliver amazing data-driven graphs, and it is one of the trending data analytics tools in the market.
What does SSRS stand for?
The Microsoft SQL Server Reporting Services, shortly called SSRS, is a server-based reporting software platform that creates an rdl file.
What are SSRS and SSIS?
SSRS is the SQL Server Reporting Service that is useful for designing reports, whereas SSIS is an integration service that performs ETL operations.
Why SSRS and its Features?
- The SSRS Reports can be exported to various formats, including PDF, Excel, Word, TIFF, HTML, XHTML, and XML, and this tutorial covers everything.
- We can share the reports with other users on the network or publish them on a corporate intranet or the Internet.
- All the visuals can be sorted by date, category, or any field, for that matter, with the help of parameters.
- SSRS Charts can be formatted to fit various screen sizes and are designed to work on any Windows-based computer.
- They can be altered or updated easily using SSDT, Report Builder, or the manager without re-creating them.
- Reports can be viewed in a web browser or exported to a PDF file, so refer to Export them to PDF, XML, Excel, or Word.
- Reports can be stored as snapshots, so we can access them anytime without rerunning them.
SSRS Reports Project Development Tutorial
Every SQL Server Reporting Service or SSRS project is a combination of Data Sources, Data Sets, and Charts.
- Data Source: It is helpful to establish a connection between the Source (from where the source data is) where our data reside, and the Report.
- Connection Managers: In the project, connection managers help to establish the connection between visualization and the Data Source.
- Dataset: It is nothing but an SQL command that extracts data from the above-specified Data Source.
- Reports: This is where we create different kinds of visualizations. For this, we use the Data Sources and datasets created earlier.
Prerequisite: You cannot learn SSRS tutorials by merely reading this blog. You have to practice every chart by yourself. If you practice multiple times, you can master this reporting tool. So first, download and install BIDS or Data Tools.
As mentioned above, the first step to designing the Microsoft SQL Server Reporting Services is creating a data source that establishes a connection to the database record. The second step in this tutorial is to create an SSRS dataset that includes queries to retrieve the data source’s actual data.
- Query Designer
- Creating New Project
- Create a New Report
- What is a Shared Data Source
- Embedded Data Source
- What is a Shared Dataset
- Embedded Dataset
- Lookup Function to Combine Two Datasets
SQL Server Reporting Services Items
For the next two days, concentrate on creating Basic charts. This section of the SSRS tutorial explains the list of available items and their usage inside an original visual.
- List of Items in a Tool Box
- What is Tablix: It includes creating the Drop Down Tables, Group On, Stepped, and Block Grouped Table Reports.
- Creating a New Matrix
- Create a List
- Highlight Table
Design with Report Wizard
- Create a Table using Wizard Page, Group, and Details. It includes drill-down, Stepped, and Grouped reports.
- Create Matrix Using Wizard
SSRS Basic Reports Tutorial
Learn about the formatting options in the next four days. This section covers the basic reporting using these services.
- Add Grouping in Table
- Adding Row Groups & Column Groups to Matrix
- Create charts using Views
- Create a Report using Stored Procedure
- Add Totals and Subtotals to the Table and Matrix
- Add Or Remove Headers and Footers
- Global Variables
- Export them to PDF, XML, Excel, Word
SSRS Tutorial on Basic Formatting
This section covers the basic formatting options
- Changing Font and Background Color of a Text Box
- Format Numbers in a Text Box
- Format Date and Time
- Repeat Headers and Titles on Each Page
- Headers Visible While Scrolling
- Filters at Tablix Level
- Filters at Dataset Level
- Sorting Data at Tablix Level
- Interactive Sorting
- Add Alternative Row Colors
- Display Table Rows on a Single Page
SSRS Expressions and Functions
The Functions page covers all the built-in functions, their descriptions, and a simple example that explains how to use them in real time. It includes the Aggregate, String, Date, Mathematical, Program flow, etc.
- Add Row Numbers
- Add Page Numbers to the Report
- Calculate the Running Total
- Calculate the Running Average
- IIF condition
- Limit the Number of Rows Per Table Page
- Rotate Report Headers to Vertical
- Switch Statement
SSRS Charts Tutorial
Next, eight days are all about Charts. I don’t think you need seven days to understand them. The following is the list of charts available in the SQL SSRS Reporting Services tutorial.
- Charts Introduction
- Area Chart
- Bar Chart
- Bubble Chart
- Column Chart
- Donut or Doughnut Chart
- Data Bars
- Funnel Chart
- Radial Gauges
- Linear Gauges
- Indicators
- Line Chart
- Pie Chart
- Pyramid Chart
- Radar Chart
- Range Chart
- Scatter Plot
- Sparklines
- Sunburst Chart
- Tree Map
By the 16th day, you will know everything about Data Sources, Datasets, Basic Tables, and Charts.
SSRS Advanced Reports Tutorial
From the 16th to the 21st, concentrate on Advanced and Parameter charts. This SSRS tutorial section covers advanced topics like paginated, sub, linked, ad hoc, and drillthrough reports.
- Add Custom Code inside
- Calculated Fields
- Dashboards
- Document Map
- Drill Down
- Drillthrough reports Action
- Multi Level Group Drill Down Table With Totals
- Matrix Drill Down
- Go to URL Action
- Page Breaks
- Subreports
SQL Server Reporting Services Parameters
This section of the SSRS tutorial covers the Parameters defined and uses them as the Filters on the main report. These parameters filter the data in large reports per user selection or the parameter value.
In this tutorial section, see how to accept the user inputs as the parameter value and assign default values and multiple values as a parameter of the main one. The most important thing is creating a parameter whose value depends on another parameter. Following these five articles in this Microsoft SSRS tutorial, you can understand all the above-said things.
- Parameters
- Drop down list Parameters
- Multi-Value parameters
- Multiple Parameters
- Cascading Parameters
- Allow Nulls as a Report Parameter value
- Allow Null Parameters using ISNULL Query
- Date Parameters with Calendar
- Display Parameter Value in a Report
- Hide Report Parameter
- Report Parameter with Default Value
- Report Parameter With Static Values
- Set Report Parameter as Optional using a Query
- Set Report Parameters Optional using IIF
- Use Report Parameters to Perform Wildcard Search
- Use Radio Buttons as Report Parameters
- Parameter Value to Show or Hide Table Columns
- Use Reports as Parameter Value
SSRS Report Manager Deployment and Security tutorial
Once you complete the Design, you can deploy the existing ones into the Reporting Manager. This SSRS report server tutorial covers the security settings and its functionalities to publish charts to the server.
Security: Reports can be secured through the user roles and permission to access individual folders. We can assign different roles, such as administrator, viewer (browser), builder, and report manager.
In addition to that, spend the next five days (22 to 26) learning the SSRS Report Manager scheduling tool, the deployment process, or the publishing to the server tutorial.
- Services Configuration Manager
- Create a New Folder in the Manager
- Change the Report Manager Title
- Deploying using BIDS and Report Manager
- Upload datasets into the Manager
- Create a Shared Data Source in a Manager
- Cached Reports
- What is a linked report?
- Report Parts
- Snapshot
- Security
- What is a data driven Subscription?
- Upload Text, PDF, and Image to the Manager
What is SSRS Report Builder?
If you don’t know Visual Studio and love Microsoft Word, you will enjoy working with the SSRS report builder tutorial. It has a simple yet powerful SQL Server reporting services interface to design graphs.
Use those extra two days to learn SSRS Report Builder, and this tutorial section covers the designer part of using this tool.
- Please refer to the Install Builder article to understand the installation process and a few report designing examples.
SSRS Reports Work Environment
The SSRS is all about Data Sources, Datasets, and Reports, and this tutorial shows you how to learn the tutorial step by step. The screenshot below shows you the work environment (layout) used to create projects.
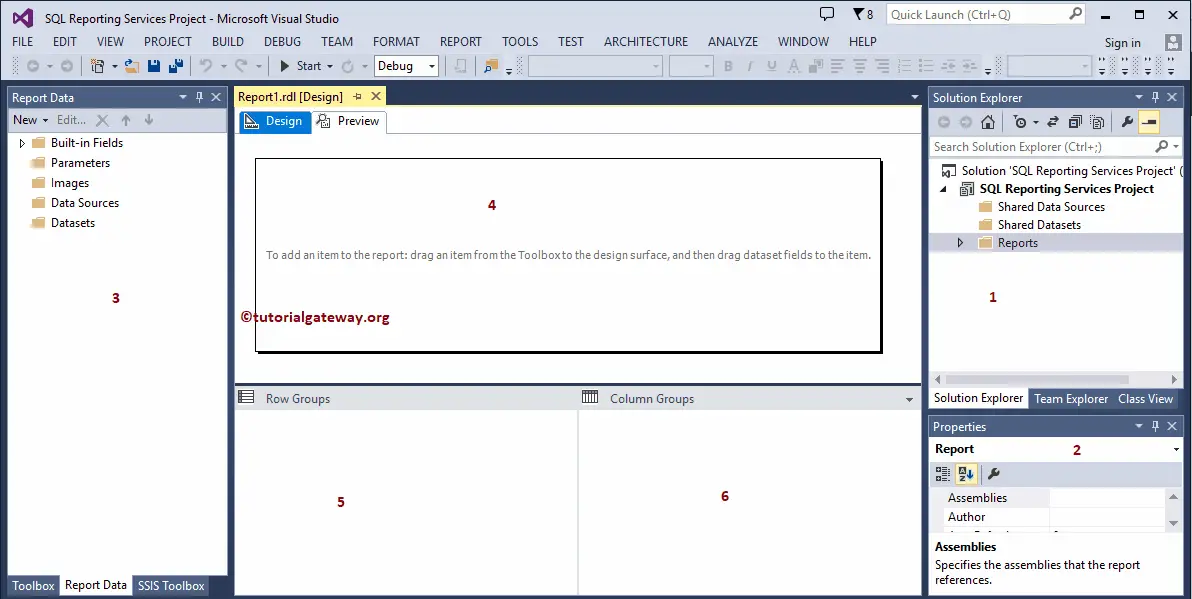
As you can see from the above screenshot of the SSRS tutorial, we divided the reporting services window into different parts.
- Solution Explorer: This is a combination of Shared Data Sources and shared datasets and creates reports (rdl or report definition language file). In the Create a New Project article, we explained each section in detail. It is the place where we can deploy them.
- Properties: This window is useful for changing the property of each item present in a report (including itself).
- Report Data: Here, you can create the Parameters, Data Sources, and Datasets required for this particular SSRS report. If you are using Shared data Sources, you must create a local instance of that.
- Design: This is the place where we design
- Row Groups: Helps to add a new group or to delete an existing group. Use this window to adjust the properties of a row group.
- Column Groups: Add a new column group or delete an existing column group item. Use this window to adjust the column group properties.
SSRS Toolbox
The SSRS toolbox allows you to create reports from various sources, so check the charts section. This Toolbox provides a complete set of tools to create a report ranging from basic to most complex as per your business requirements. You can use these graphs by dragging and dropping them into the work environment.
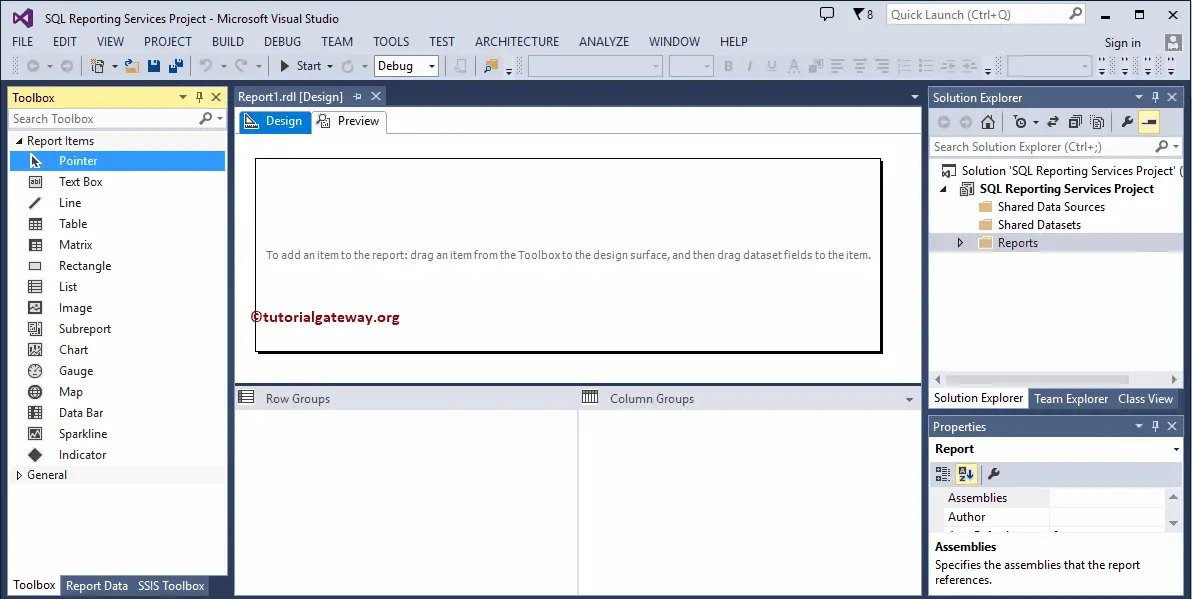
Next, we have to visualize the data from the dataset by adding charts to the data region. On the first day of the SSRS tutorial, learn everything about them.
Advantages of SSRS
- SSRS Reporting Services is free when you purchase the SQL Server license. You can download the latest developer version and Visual Studio to use and test for learners.
- One can create a report without writing a single line of code, and most of this article covers the same.
- Users coming from SQL backgrounds can generate the most powerful high-level reports for their Organisations. Because they can pass data from stored procedures.
- Microsoft SSRS reporting services are the best solution for small companies.
- Option to schedule the rdl execution.
- Reports can be delivered via Email at regular intervals or on any specific day or time.
- SSRS Snapshot reports are beneficial to view anytime without running the same chart or data processing.
- It comes with the security features that we generally see in Windows users. SSRS has the option to specify the user roles and permissions, so please check this tutorial. The best part is that we can simply integrate Windows users with this tool.
What are the drawbacks of reporting in SSRS?
Although SSRS is a comprehensive reporting software platform with a wide range of features, it has disadvantages.
- If you don’t understand the data stored on the Server, it will be impossible to analyze the data.
- Although Microsoft is improving this SSRS reporting tool with major updates, the introduction of Power BI or Tableau might be a better option for the future, so check out its tutorial.
- Working with parameterized reports may go wrong. And we always provide the parameter value to generate reports. If we haven’t provided the default values, it throws errors before generating a visual.
- It needs extra SQL server data storage to save the SSRS reporting services graphs in its instance or catalog.
- Though it has the option to write custom code, it is very difficult to write functions and has no way to debug the code.
- You have to work with internal files to modify the preview outlook. For instance, we have to edit the system file to remove the print button or control the export options.
- Configuring the SQL Server Client-Server system for this SSRS reporting service involves a workaround.
Comments are closed.