In this article, we will show you how to create an SSRS Table Report (without using Report Wizard in SQL Server Reporting Services) with a practical example.
Creating SSRS Table Report
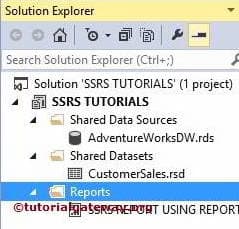
After creating the New SSRS Project, We have three folders in the solution explorer, such as Shared Data Sources, Shared Datasets, and Reports. The reports folder is enough to design a basic SSRS report.
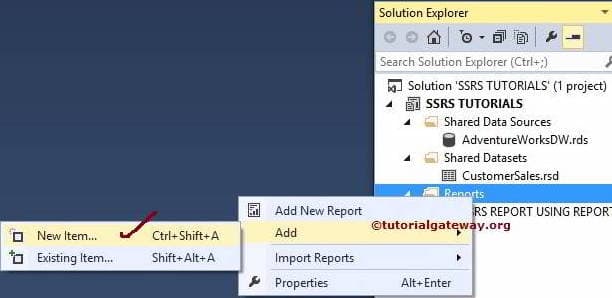
In the solution explorer, Right-click on Reports folder ->Add -> New Item.
It will open the Add New Item window with all the available options. Please select the Report option and rename it as per your requirements. In this Table Report example, We are renaming it as NEW SSRS REPORT.rdl.
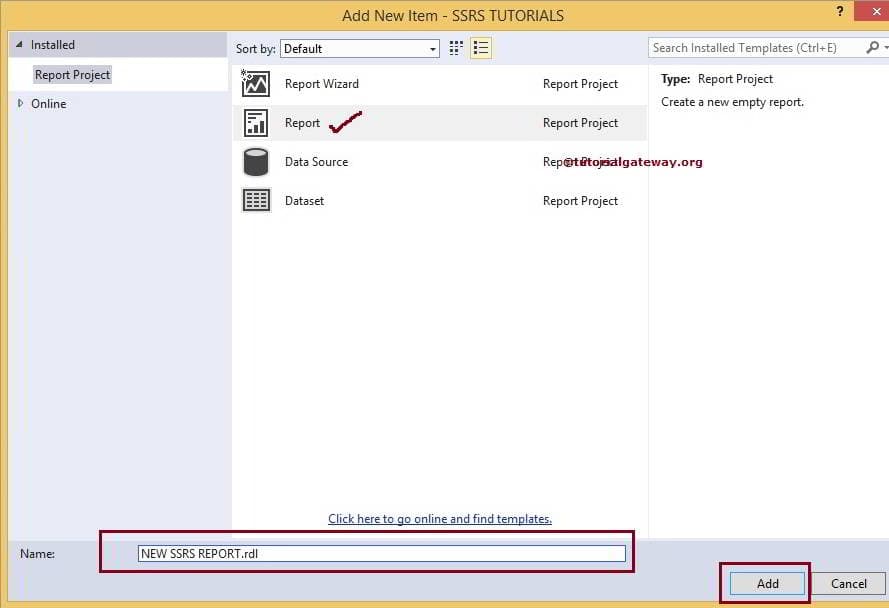
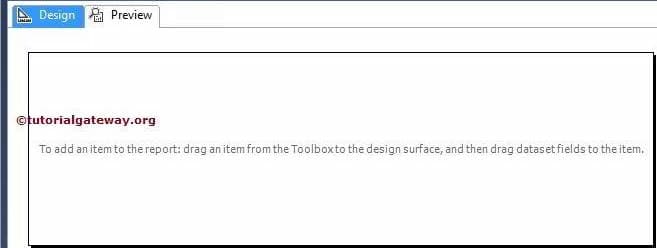
Click on the Add button to create a Blank report, as shown in the below screenshot.
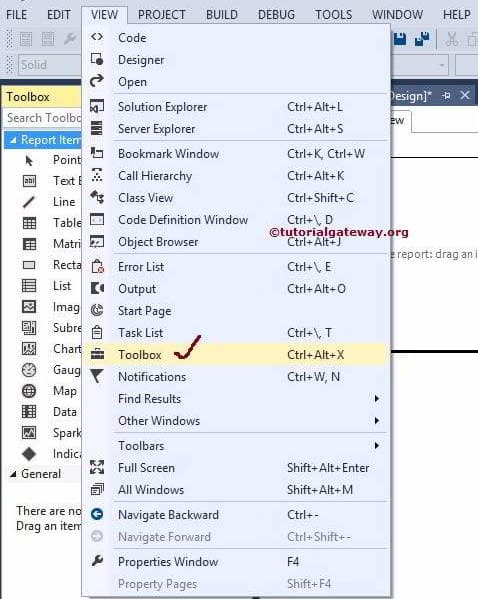
If you don’t find the Toolbox, then press Ctrl+Alt+X or go to the View tab and select the Toolbox.
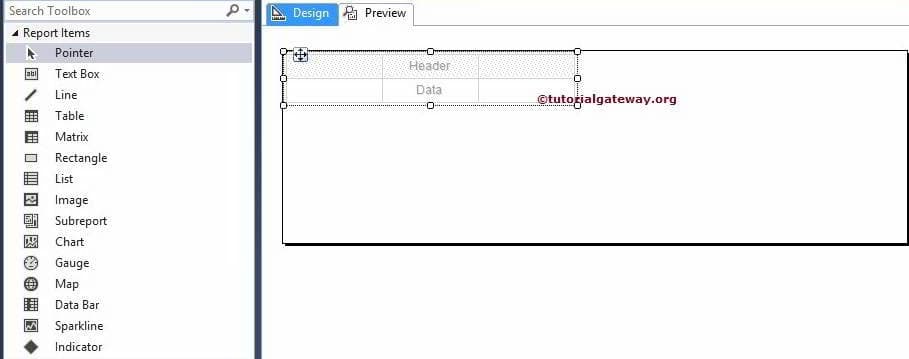
Drag and drop a table from the SSRS Toolbox to the Data region.
In this example, we use the already created Data Source and Dataset. Please refer to Embedded Data Source and Embedded Dataset article to check the data.
- Create Block Grouped Table Report with Totals
- Create Group On Page Table Report
- Create Drill Down Table Report with Totals
- Create Stepped Grouped Table Report
- Highlight Min and Max Rows
- Add Multiple fields to a single column
- Change the Background color of Minimum and Maximum Table Columns
We can add the Column names to the SSRS Table report in two ways:
- We can Drag the Column name from the Report data to the Table Column.
- When we click on a particular cell, the context menu will open, displaying available column names in that Dataset. We can select the required column from the list as shown in the screenshot below.
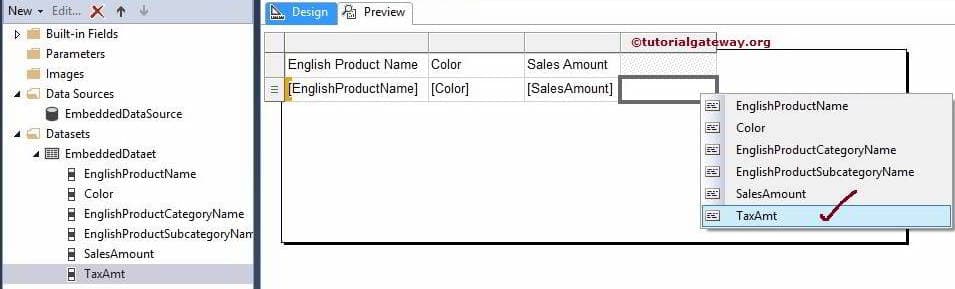
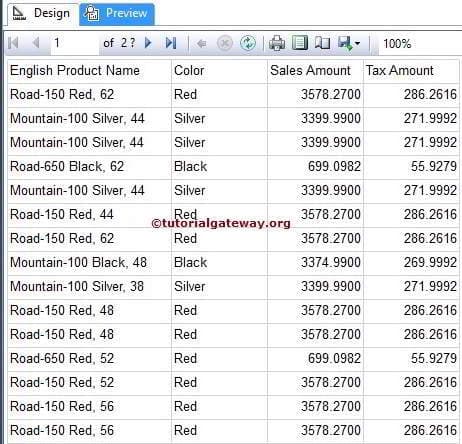
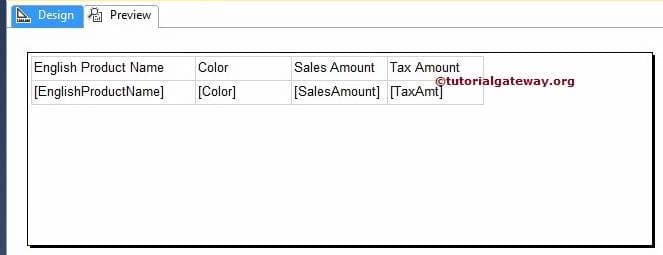
We successfully created our first table report. The columns we selected for our First report are English Product Name, Color, Sales Amount, and Tax Amount (Renamed the TaxAmt).
Click on the Preview button to see the SSRS Table report preview.