In this article, we will show you the steps involved in Creating an SSRS Table Report using Report Wizard. I suggest you refer to the Create Table Report article to understand the steps for creating the table report in a general way.
Creating SSRS Table Report using Report Wizard
After creating a New SSRS Project, We have three folders in the solution explorer, such as Shared Data Sources, Shared Datasets, and Reports. The reports folder is enough to design a basic report.
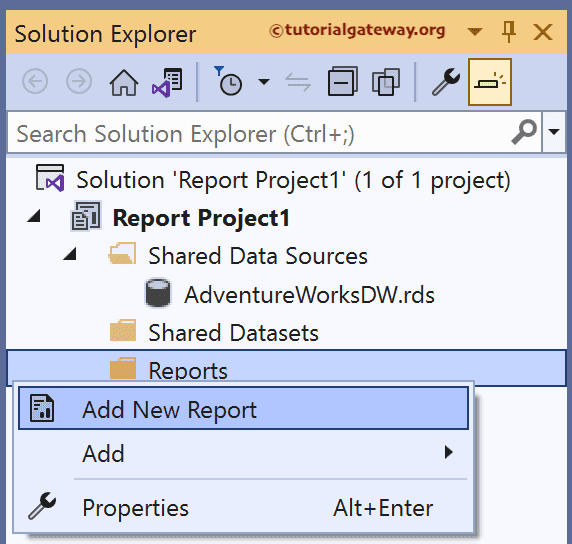
When we right-click on the Reports folder, it provides various options to design reports.
- Add New Report: Open up the Report wizard to design the Report.
- Add: Gives us a choice to choose whether to design a report using Report Wizard or an empty report.
- Import Reports: We can import reports from the file system.
Here we are selecting the first option, Add New Report. Once you click on this option, it will open the Report wizard, as shown in the screenshot below.
The first page is a Welcome screen for creating an SSRS Table Report using Report Wizard. If you don’t want to see this page again, Please checkmark the Don’t show this page again option.

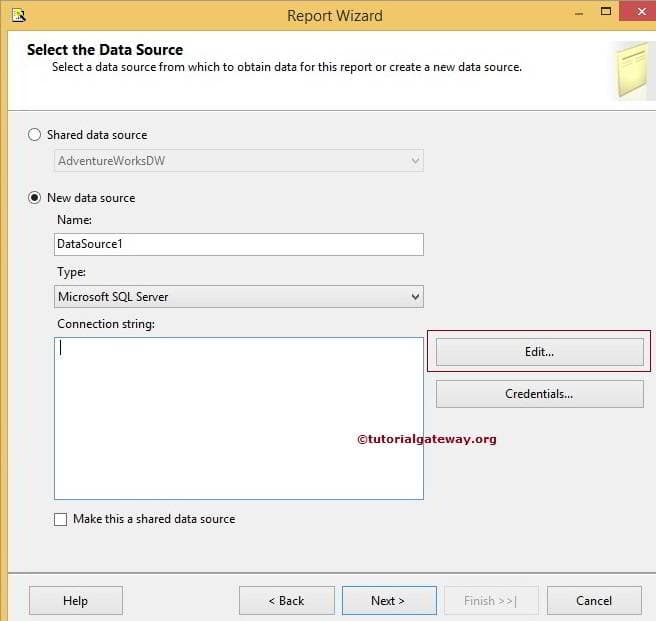
Select the Data Source: This page is used to configure the Data Source. Here we have two options:
- Shared Data Source: If you already created the Shared Data Source, Please select the data source name from the drop-down list.
- New data Source: If you haven’t already created the data Source, Please select this option and create a new one.

If you select the New Data Source, the following properties will come into play. Please refer to the Shared Data Source article to understand the properties in detail.
Click on the Edit button to configure the connection string
Design Query for Creating SSRS Table Report using Report Wizard: This page is used to write the Query to extract the data from the Data Source. If you are unfamiliar with transact queries, click the Query Builder button.
Please refer Query Designer article to understand the steps involved in designing Queries. In this example, we are copying from SQL Server Management Studio to Query String empty space
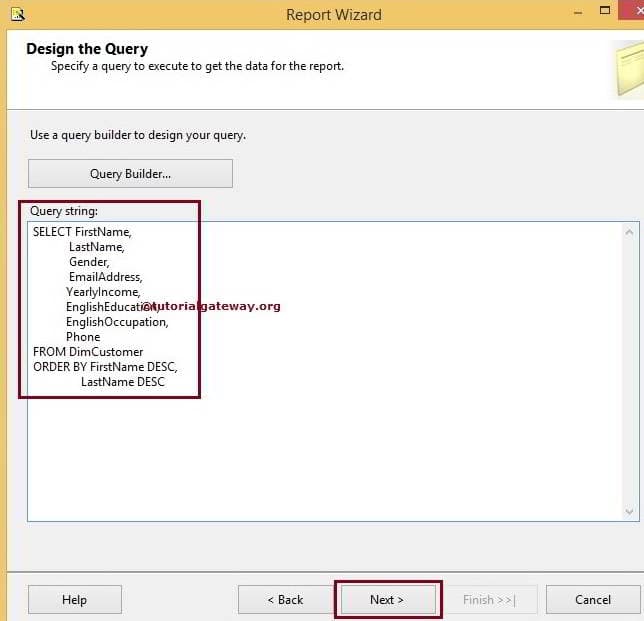
The Command we used in the above screenshot is:
SELECT FirstName, LastName, Gender, EmailAddress, YearlyIncome,
       EnglishEducation, EnglishOccupation, Phone
FROM DimCustomer
ORDER BY FirstName DESC, LastName DESC
Select the Report Type: Please select the type you wish to design.
- If you are designing a Table report, Please select the Tabular option.
- If you are designing a Matrix report, Please select the Matrix option.

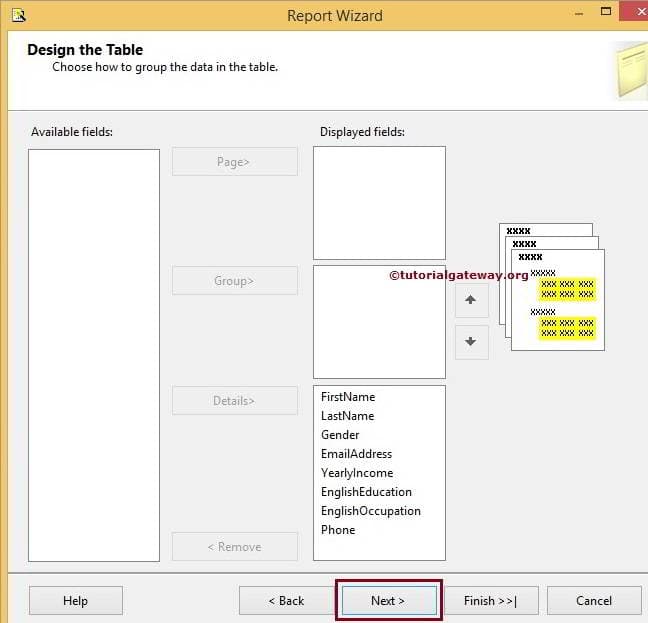
Design Table: Properties involved in this page are:
- Available Fields: List of columns we got it from the query we designed before
- Page: If you place anything, it will start a new page for every new value. Refer to Create a Table using Wizard Page and Details.
- Grouping: If you want to perform grouping operations, put those columns in this place. Refer to Grouped Table Using Report Wizard.
- Details: Columns added to this tab will show as output columns in the Table report.
- Remove: This button will remove column names from Page, Grouping, and Details.
The remaining varieties of Table reports are:
- Create a Table using Wizard Page, Group, and Details.
- Drill Down Table Using Wizard
- Stepped Table using Report Wizard
- Query Builder inside a Report Wizard
Because it is the first report, Please don’t bother about grouping. Just understand the concept. You can visit other articles to understand these things.
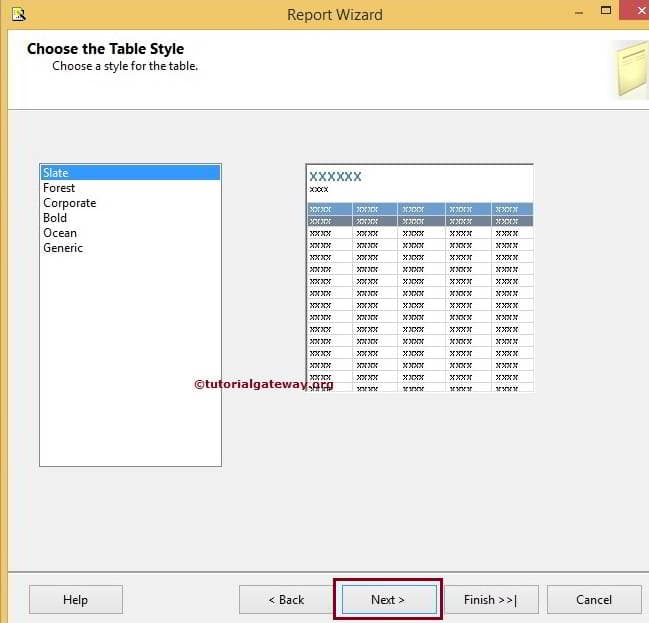
Choose the Table Style: You can select your own style as per your requirements.
Completing the Wizard: Please provide a valid name for the report and click on the finish button.
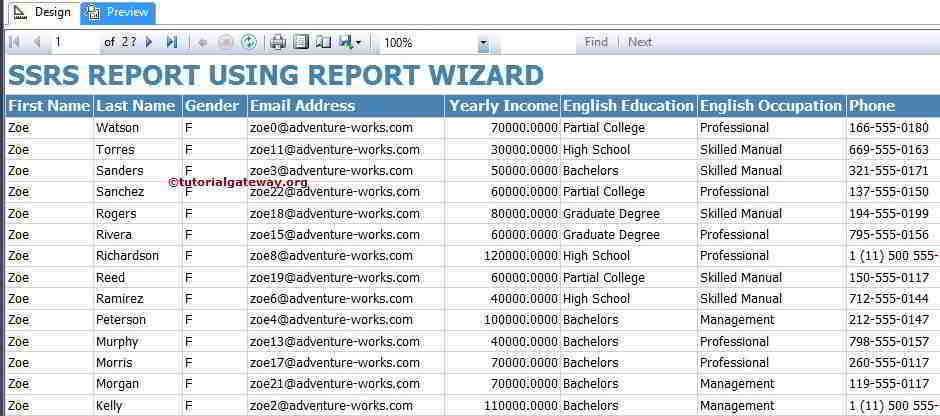
Here, We assigned the SSRS Report using Report Wizard name as the report name
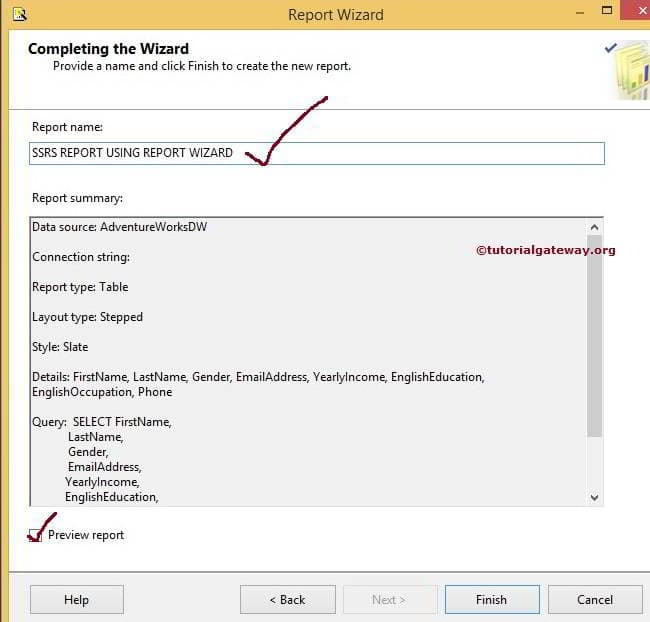
If you observe the above screenshot, You can see the Query, Report Type, Data Source, and Layout Type details. Click the Finish button to finish creating an SSRS report using the report wizard.
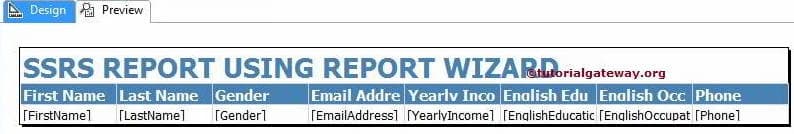
Click on the Preview button to see the report preview