This SSRS article shows the list of charts available to display the data visually. Reporting tools are useful for analyzing the data as per the business requirements. While investigating the data, some companies might be interested in Table or Matrix reports. However, most companies use SSRS Charts (Graphical Representations of data) to see the Trends, Sales Comparisons, etc.
Although each chart in SSRS has its specialties and importance, you can use different charts for a single dataset to understand (visualize) the data from different angles. Some charts help to display aggregated information, few represent data over a time series, and others use multiple values against the text.
Each SSRS chart has a values section for aggregated numeric data, a category groups section for text columns, and an optional series section. I suggest you understand every chart with utmost concentration.
Like other reporting tools, SQL Reporting Services provides several built-in charts to visualize the data. In this section, we show the list of available charts.
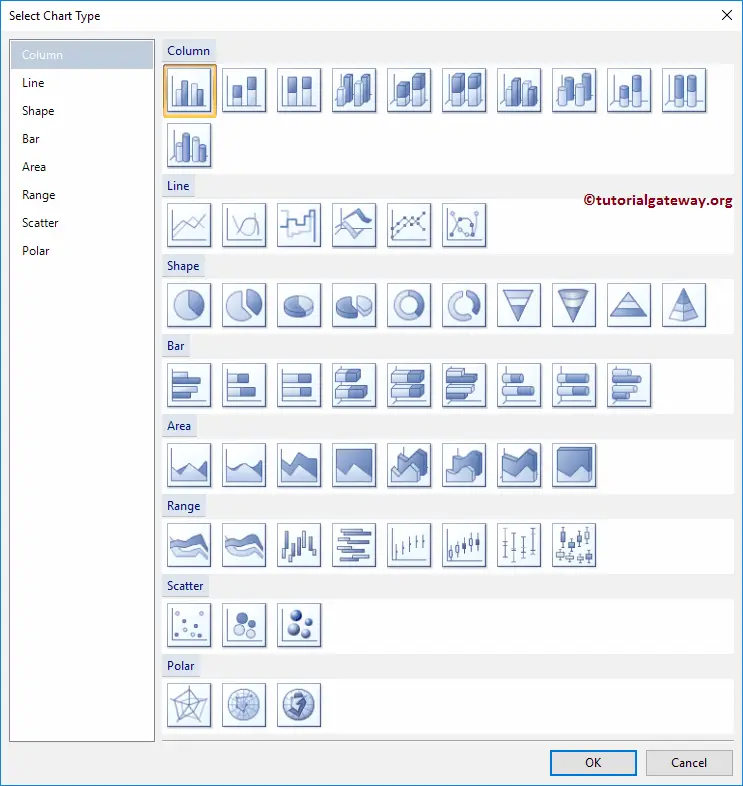
List of Charts in SSRS
The screenshot below shows the available list of charts in SQL Reporting Services.
The detailed list of Charts is shown below. All the below-specified headings are Hyperlinks. So clicking on them will show you a particular example.
SSRS Basic Charts
These are the most commonly used reports in SQL Server Reporting Services.
Column Chart
A Column Chart is also known as a vertical bar chart, representing aggregated numeric values on the Y-axis and the grouped text columns on the X-axis. Each category group will be placed on the column chart X-axis, and each vertical bar represents the aggregated data(sum, avg, etc.) belonging to a particular group. It is suitable for comparisons. You can use this SSRS chart to compare Sales By Month, Sales this year vs. previous years, etc. Remember, we also explained the formatting column options in Formatting Column, so refer to the same. Try a 3D Cylinder Chart for a cylinder shape chart.
Bar Chart
The Bar Chart is the same as the column chart, but the rectangles are displayed horizontally. In the Bar chart, category groups will be on the Y-axis and aggregated numeric values on the X-axis.
Line Chart
A Line Chart helps visualize the trends over a period of time. For instance, you are checking the product sales trend lines (going up and down) from start to end date. Adding another column to Values can help you compare multiple measures against a single dimension. Similarly, adding a text column to the series divides the lines further and helps to compare multiple series. You can use this SSRS chart to display the Trend. For example, Sales Trend a temperature at a continuous period.
Area Chart
The Area Chart is the same as the line chart, but the empty space between the X-axis and lines will fill with a solid color. You can use this type of chart to graphically display the area-wise changes in a time series or quantitative data. Please use the Smooth Area Graph to avoid sharp edges.
Pie Chart
Pie Charts help display small and high-level information. You can use SSRS pie charts to compare region- or product category-wise sales. If you use more columns, it becomes a useless chart. Remember, we also explained the formatting Pie technique in Formatting Pie and Display Percentages on Pie Chart.
Donut Chart
Doughnut Chart: As the name suggests, this chart looks like a donut, similar to a pie chart. You can use donut charts to visualize KPIs or three to four values.
Treemap
Treemap is one of the best alternatives to the SSRS pie chart. It displays the data in rectangles; each rectangle size depends on the numeric value. When you see the treemap, you can identify the highest and lowest. If you have large data points to display, go for the tree map.
Bubble Chart
Bubble Chart: Each bubble represents the category group item, and the size depends on the values of that particular group. You can use this chart to display the three-dimensional data. Or You can use them on top of the Maps.
Funnel Chart
Funnel Chart: It is helpful to display a single text column against the numeric values. You can use this to visualize the aggregated data stage-wise or product against the goals, etc.
Pyramid Chart
The Pyramid Chart is similar to the SSRS Funnel, and it is helpful to view the data in different stages, sales opportunities, wastage at each stage, production against the goals, etc.
Radar Chart
The Radar Chart is very useful to visualize numeric data in 360 Degrees. The Radar Charts plot points from the central point(0, 0) to the given distance in a radial fashion.
Scatter Plot
Scatter Plot: This plot helps visualize the relationship between any two sets of data. The horizontal X-axis represents one numeric field, and the vertical Y-axis represents another numeric field.
Range Chart
Range Chart: This SSRS chart can visualize the data between the minimum and maximum values.
A map helps visualize analytical data and spatial information.
Special Type of SSRS Charts
SSRS also provides Data Bars, Gauges, Spark Lines, and Indicators. You can use these types of charts inside the Matrix or Table reports.
- Gauges help visualize the KPIs or Key Performance Indicators.
- Data Bars are used within the Tables or Matrices as an extra column to show the measures across time. Otherwise, you can use it to show the sub-data to users. Please refer to the Design Data Bars in Matrix article.
- Spark Lines work the same as the Data bars. We can use sparklines within the Tables or Matrices as an extra column to show the trends over a period of time.
- Indicators work the same as the Data bars and Sparklines. We can use indicators within the Tables or Matrices to visualize the stars (going up or down).
- Sunburst Chart
Formatting Table Report
- Create Block Grouped Table Report with Totals
- Create Group On Page Table Report
- Create Drill Down Table Report with Totals
- Create Stepped Grouped Table Report
- Multi Group Drill Down Table with Totals
- Highlight Min and Max Rows
- Add Multiple fields to a single column
- Change the Background color of the Minimum and Maximum Table Columns
SSRS 3D and 100% clustered and stacked charts
The following list shows the 3D and 100% clustered and stacked charts.
Stacked Bar and Column
The SSRS Stacked Bar Chart helps divide the columns or bars further. Generally, a Bar chart represents the relationship between category groups and values. However, suppose you add another text column to the Series section. In that case, it becomes a stacked bar chart where each series represents the individual field relationship against the whole bar.
100% Stacked Bar: It is the same as the Stacked Bar Chart, but it displays the percentages as the bars, and each series value further divides the 100% horizontal bars.
The Stacked Column is the same as the Stacked Bar Chart but represents the vertical rectangles. The 100% Stacked Column Chart is the same as the 100% Stacked Bar Chart with vertical bars of percentages.
3D Clustered Column: Generally, the Column chart visualizes the aggregated values for each category group. However, the Clustered Column Chart uses the series groups to divide the category group further to see the detailed information of each series. To replace the vertical bars with cylinders, use the 3D Clustered Cylinder Chart.
A few more charts in SSRS are
- Stacked Area
- 100% Stacked Area
- 3D Clustered Bar
- 3D Clustered Horizontal Cylinder
- 3D Stacked Cylinder
- 3D Stacked Horizontal Cylinder
- 3D 100% Stacked Cylinder
- 3D 100% Stacked Horizontal Cylinder
Related Chart Tutorials
- Learn the list of charts in Tableau
- Step-by-step guide to Charts in Power BI