In this article, we will show you how to create Sparkline in SSRS with an example. As most of the followers are asking about the sparklines in the table report – We will show you the steps involved in adding Sparklines to the Table Report and Matrix report.
For this Sparklines example, we are going to write the Custom Query against the SQL Server Data Source, and the query that we are going to use for this report is:
-- Query that we used in Sparkline
SELECT Prodcat.EnglishProductCategoryName,prodSubcat.EnglishProductSubcategoryName,
              prod.EnglishProductName, prod.Color, fact.[TotalProductCost],fact.SalesAmount,
              fact.TaxAmt, fact.[OrderDate], fact.[ShipDate]
FROM dbo.DimProduct as prod
   INNER JOIN  dbo.DimProductSubcategory AS prodSubcat ON
               prod.ProductSubcategoryKey = prodSubcat.ProductSubcategoryKey
   INNER JOIN  dbo.DimProductCategory AS Prodcat ON
                prodSubcat.ProductCategoryKey = Prodcat.ProductCategoryKey
   INNER JOIN  dbo.FactInternetSales AS fact ON  fact.ProductKey = prod.ProductKey
Create Sparkline in SSRS Example
This example shows you the step-by-step approach to creating a Sparkline in SSRS and how to add it to the Table report and Matrix report. The above will show you the Data Source and Dataset that we used for this SSRS report.
To demonstrate the steps involved in adding the Sparkline to the Report, We are going to use the previously generated report that we have shown below. Please refer to Add Headers and Footers to Report article to understand the steps involved in adding page headers and footers.
Add Sparkline to SSRS Table Report
In this example, we are going to create a Table report, and then add a sparkline inside that SSRS table. We can add a table to report design by dragging the table from the Toolbox to the Design space. Or, right-click on the report designer to open the context menu. Please select the Insert -> Table option from it.
As you can see, we added the English Product Subcategory Name as the first column and also removed the third column from the table. I suggest you to refer Create a New Table Report to understand the steps involved in creating a table report.
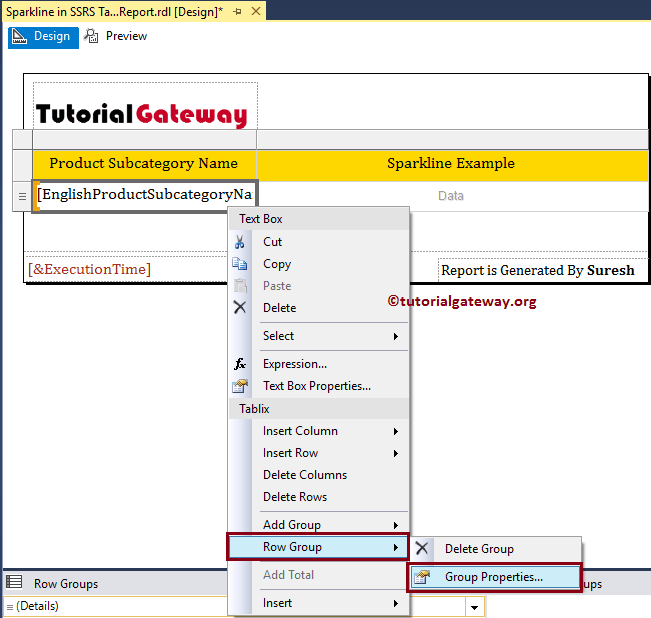
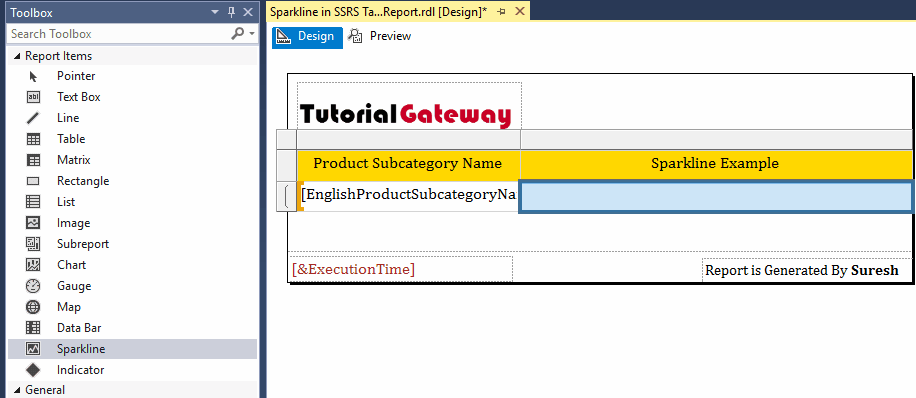
Let me do some formatting to change the look of a table report. Please refer to the Format Table Report to understand the available formatting options. Next, right-click on the Textbox that contains the Product Subcategory Name will open the context menu. Please select the Row Group, and then Group Properties.
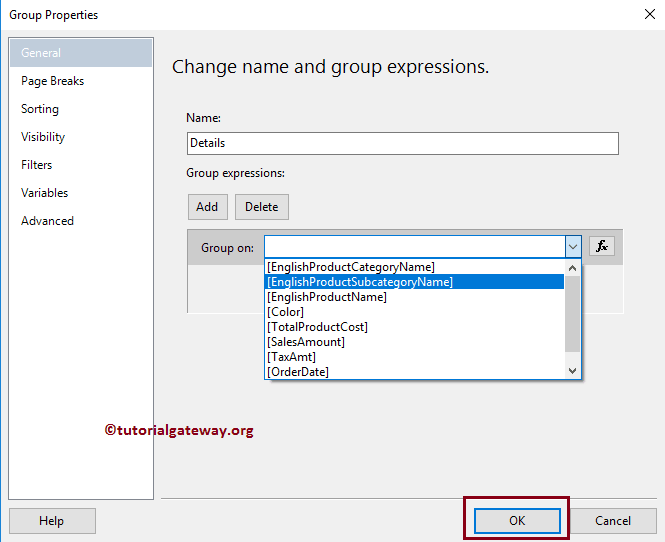
Once you select the Group Properties option, a new window will open, as shown below. Please click on the Add button to add Group Expression. Next, select the Grouping column. Here is the English Product Sub-category Name.
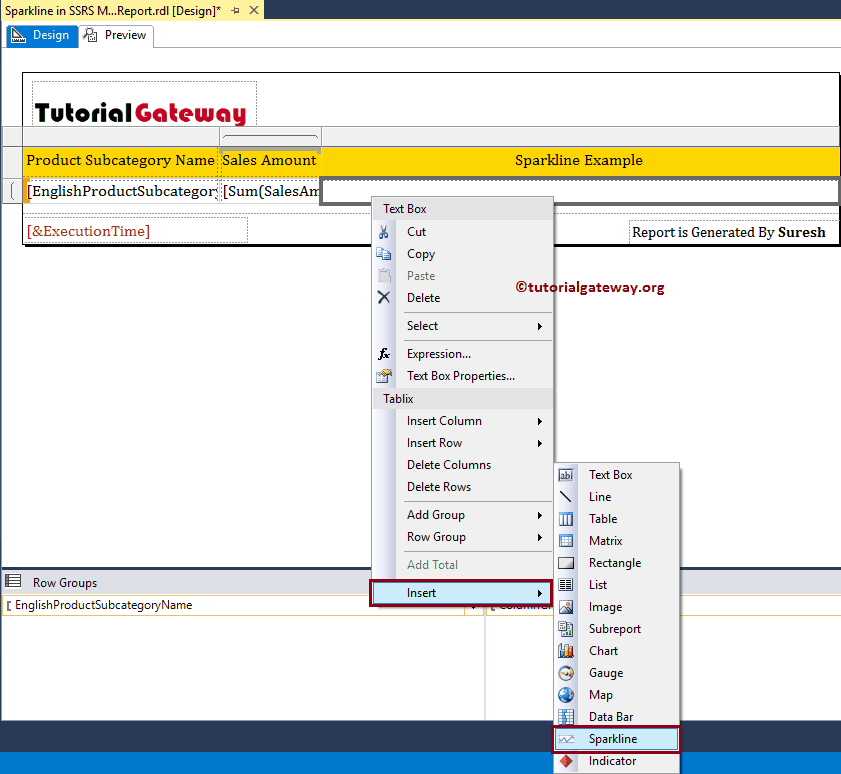
Next, let me add the Sparkline to the Empty column. There are multiple ways to add a Sparkline in SSRS. First, right-click on the Empty Column. From the context menu, please select the Insert -> Sparkline option.
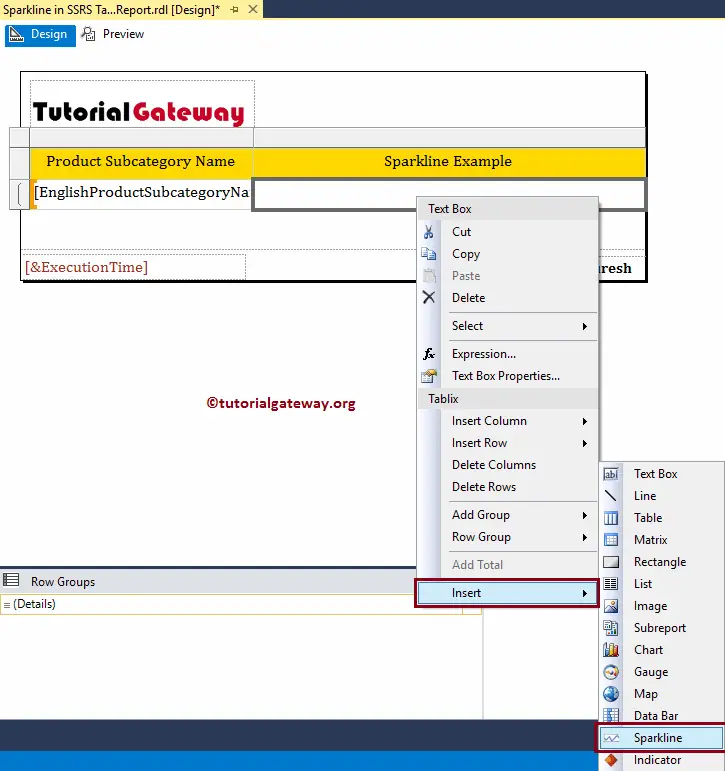
Or, by dragging Sparkline from the Toolbox to TextBox.
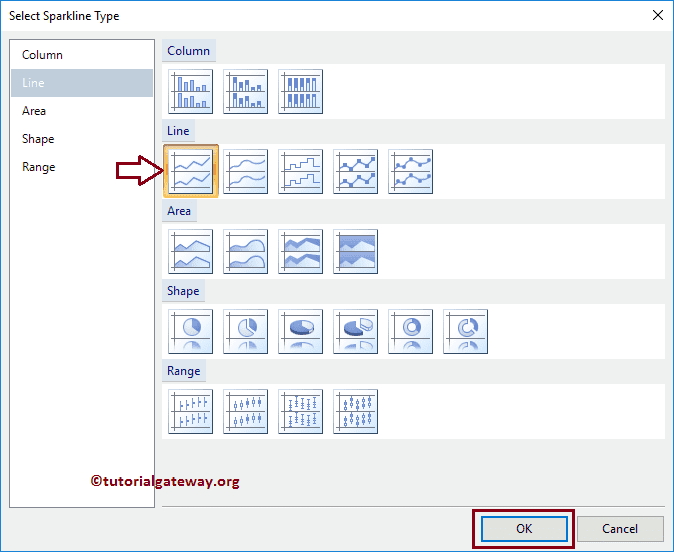
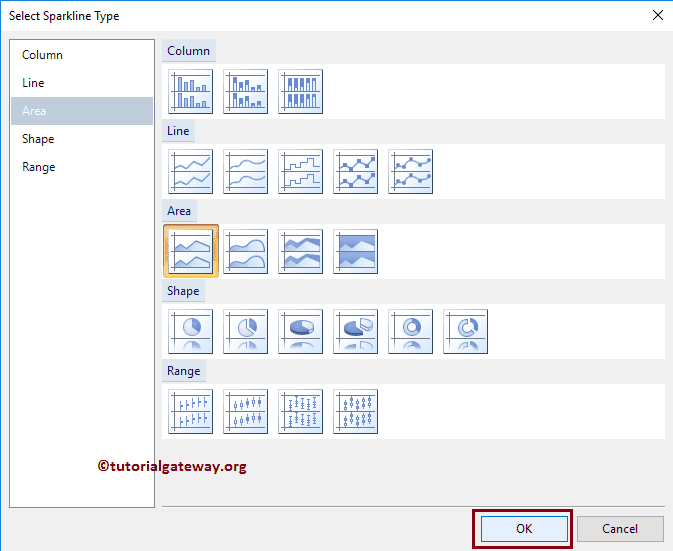
Either way, it will open the following window to select the sparkline type. Here, we are choosing the Line type.
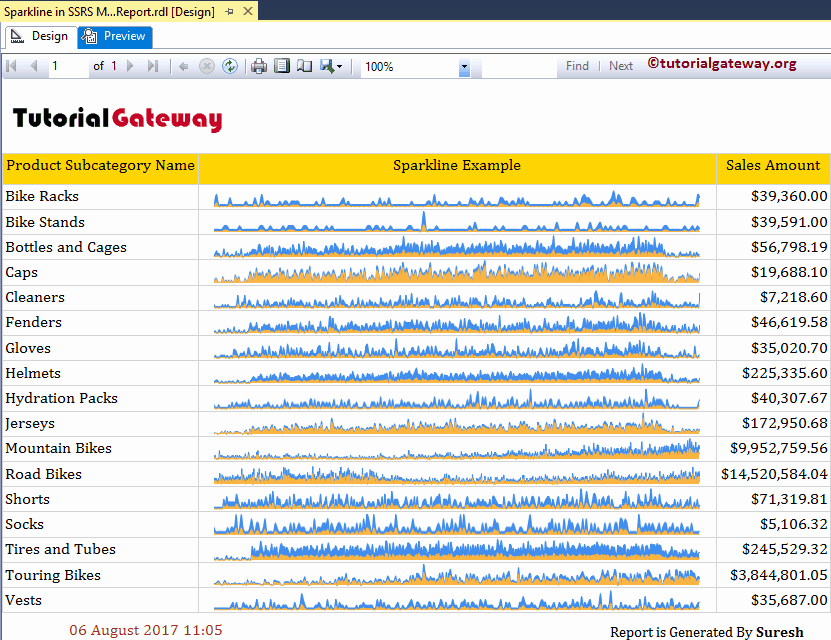
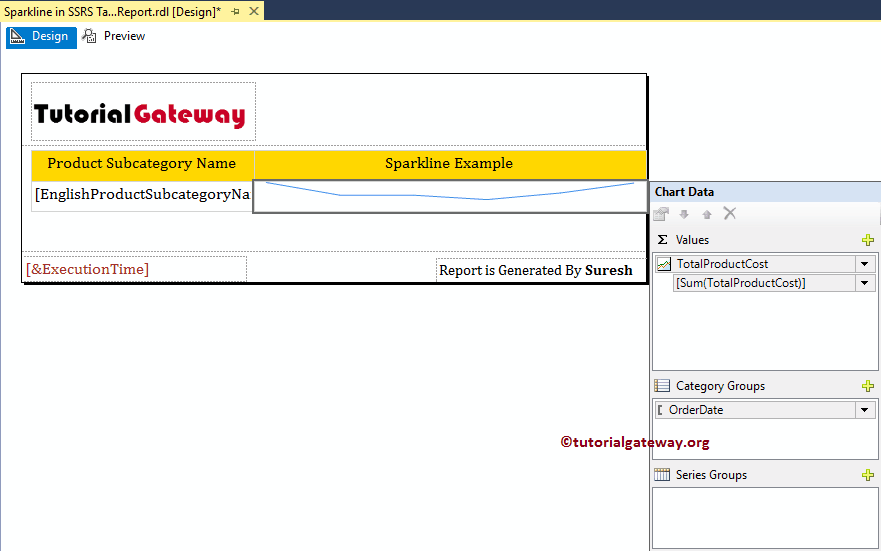
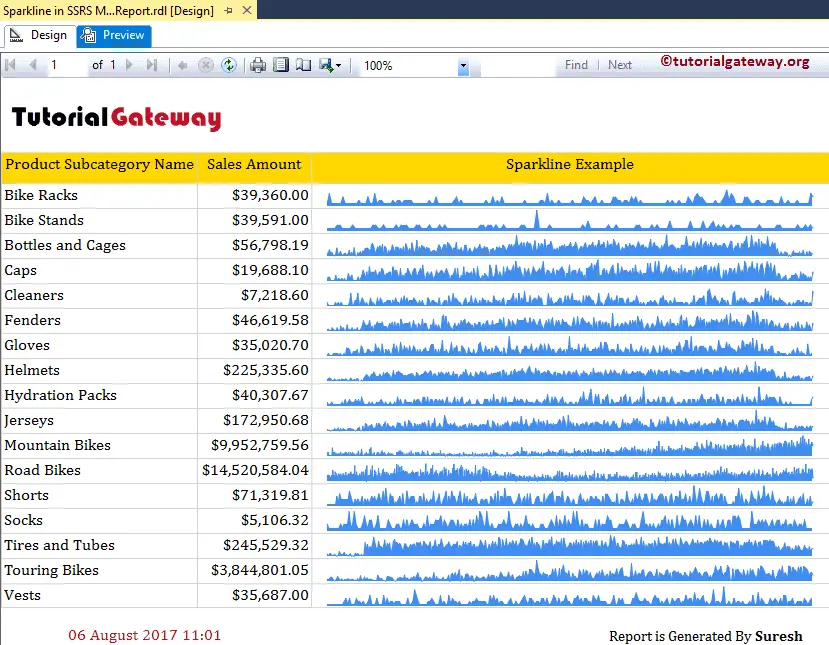
Now you can see the sparkline inside the table report in SSRS. Click on the empty space around the sparkline will open the Chart Data window. Here we want to see the Total Product cost by Order Date Trend. So, Drag and drop the Total Product cost column from the dataset to chart data values and order date to category group.
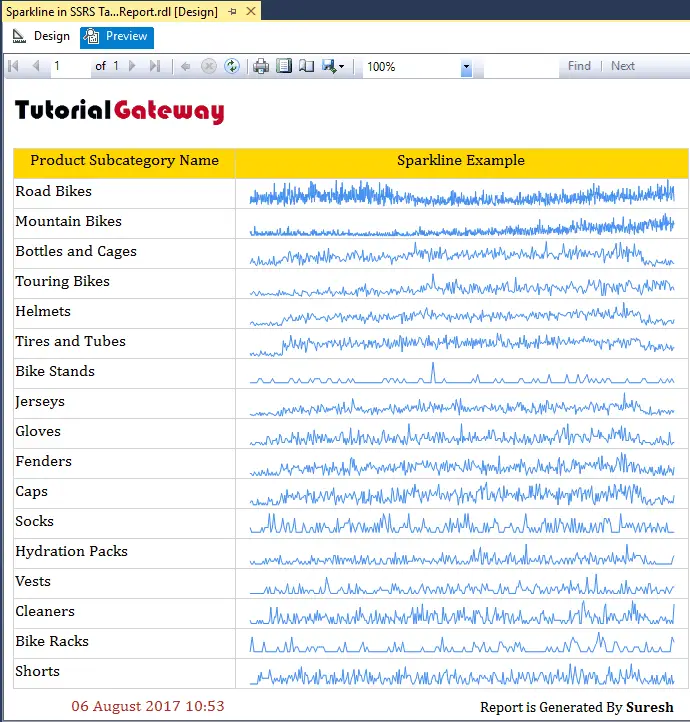
Let me show you the Sparkline report preview.
Add Sparkline to SSRS Matrix Report
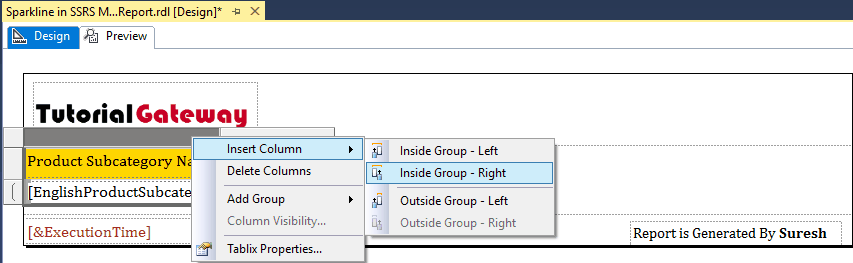
In this example, we are going to create a Matrix report, and then add a sparkline inside that Matrix. We can add a Matrix by dragging the Matrix report item from the Toolbox to the Design space. Or we can right-click on the report designer, and select the Insert -> Matrix option.
As you can see, we added the English Product Subcategory Name as the Row Group and Sales Amount. I suggest you refer to the Create a New Matrix Report article to understand the steps involved in creating a Matrix report. Next, let me add a new column outside the Group.
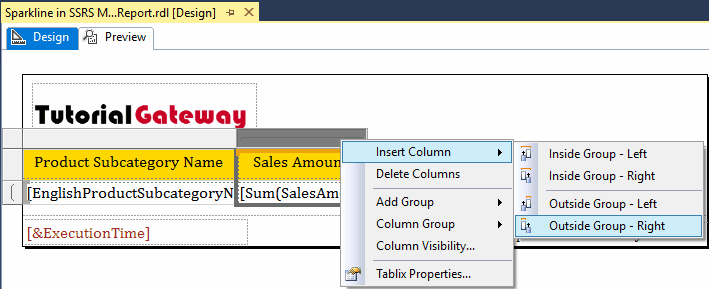
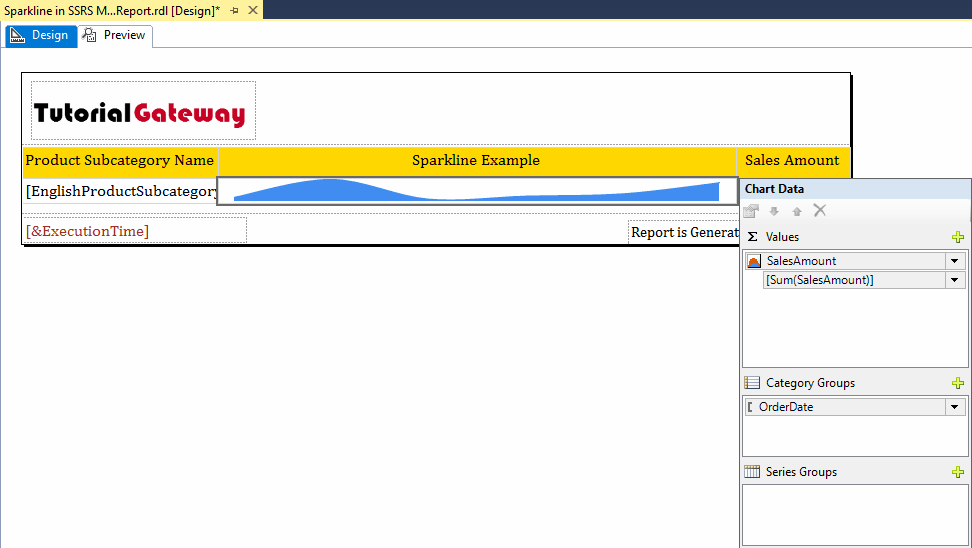
Next, we are inserting the Sparkline inside the newly created column
This time we are using the Area Chart as Sparkline Type
Last, we added the Sales Amount column as the chart data values, and Order Date as a category group.

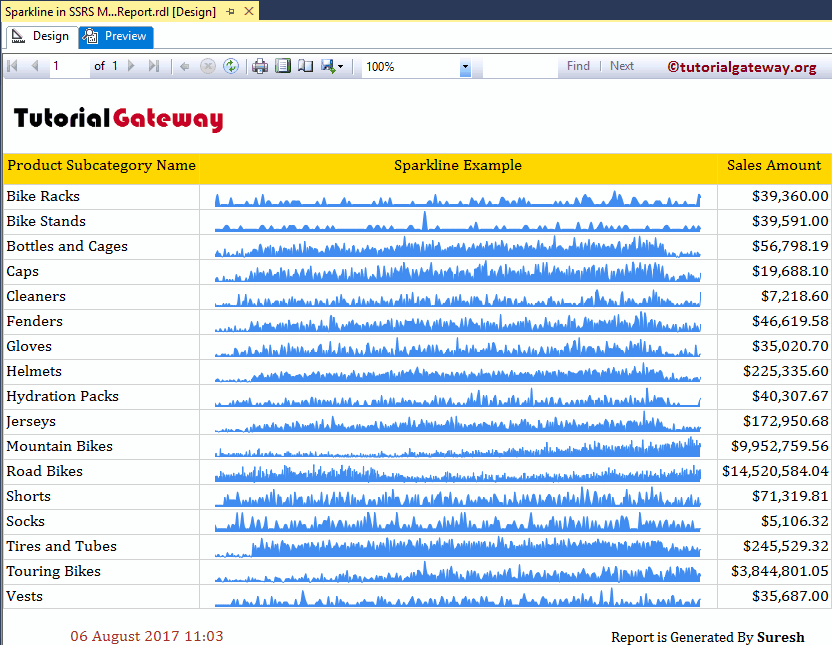
Let me show you the sparkline report preview.
As you can see from the above screenshot, we successfully added the Sparkline to the Matrix report in SSRS. Let me remove the sparkline column and add a new column inside the Row Group.
Add Sales Amount, and Order Date as the sparkline fields
Let me show you the sparkline report preview.
Add one more metric value i.e., Total Product Cost
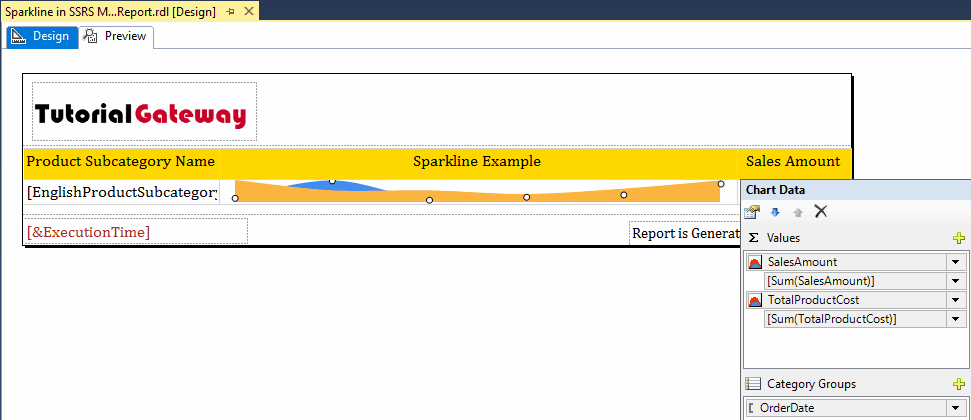
Well, our Sparkline will display both the Sales Amount and Total Product Cost.