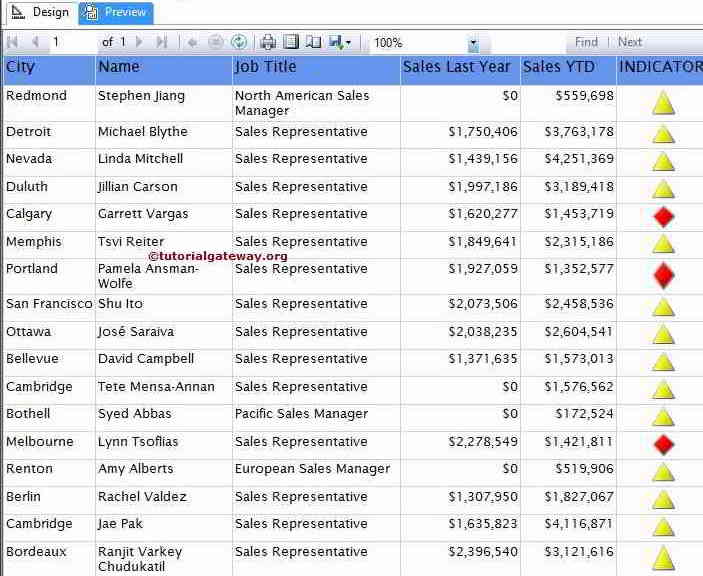
In this article, we will show you how to create and configure the Indicators in SSRS. For this, We are going to use the below-shown report. Please refer to the Table Report, Data Source, and Dataset articles to understand the creation of the Data Source, Dataset, and SSRS Table report.
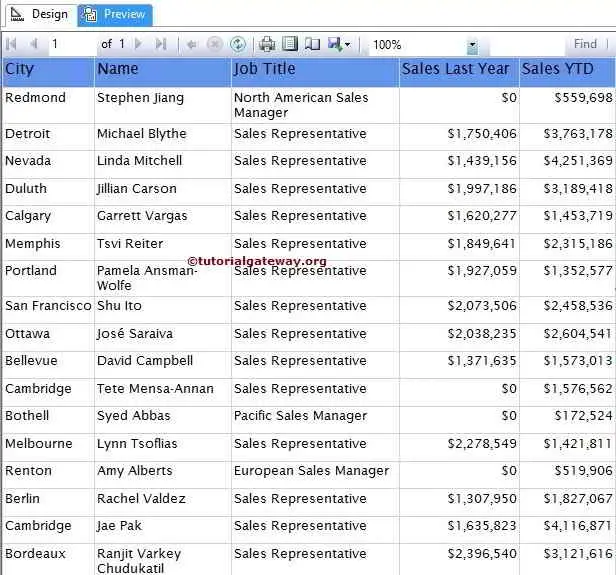
If you see the below screenshot, It was a regular Table report with City, Name, Job Title, Sales Last Year, and Sales Year to Date columns. We use this table to display SSRS indicators.
We used the Embedded Dataset for the above report, and the Dataset is shown in the below screenshot.
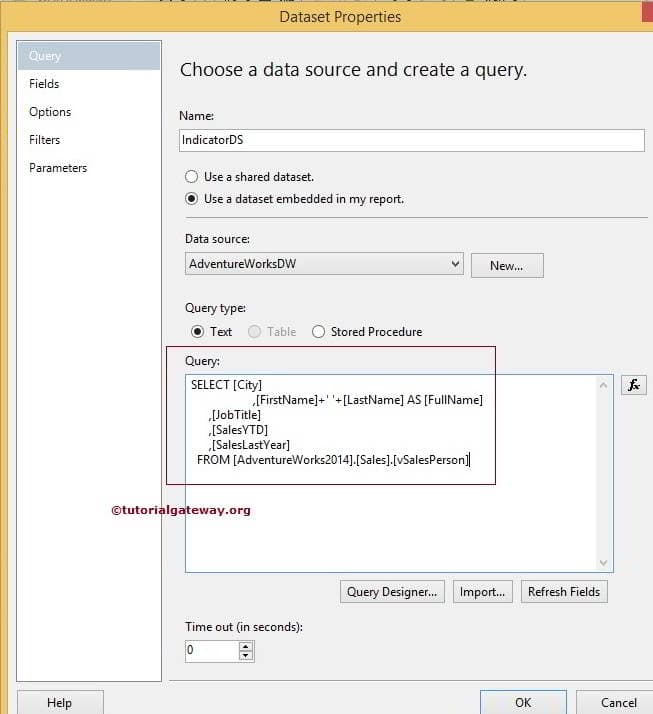
SQL Command we used as the Dataset is:
SELECT [City]
      ,[FirstName]+' '+[LastName] AS [FullName]
      ,[JobTitle]
      ,[SalesYTD]
      ,[SalesLastYear]
  FROM [AdventureWorks2014].[Sales].[vSalesPerson]
Creating Indicators in SSRS
In this example, we will create and add the Indicator on the right-hand side of the Sales YTD, and the Indicator should satisfy the below conditions:
- If the value of Sales YTD is less than Sales Last year, then display the Red Indicator.
- Anything Greater than Sales Last Year, Display Yellow Indicator.
First, let us create an Empty column by right-clicking on the Sales YTD column. Next, select the Insert Column option and then select the right option.
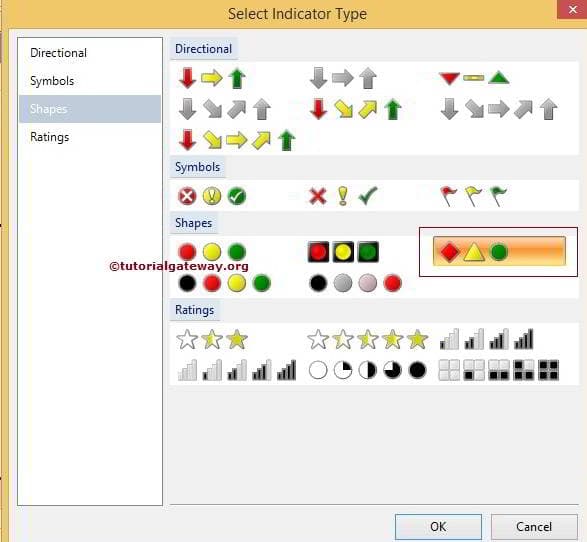
Next, Drag and drop the SSRS Indicator from Toolbox to an Empty column. When you drop the Indicator to an Empty column, a new window called Select Indicator Type will open to select required Indicators (Directional, Symbols, Shapes, and Ratings) from the available ones.
In this example, we select Simple Shape Indicator, as shown in the screenshot below.
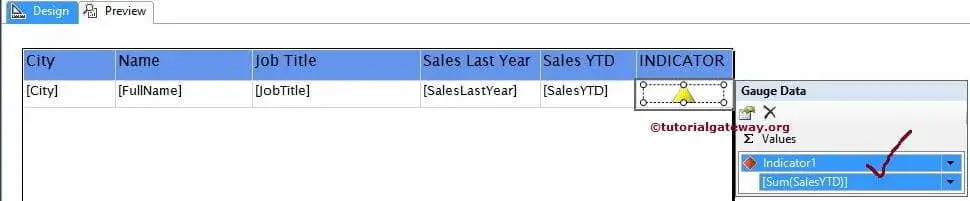
Click Ok to add an Indicator to a newly created empty cell. Now, we have to configure the Indicator value. First, Click on the SSRS Indicator to open the Gauge Data window.
In this example, we want to show the Indicator for Sales YTD. So, Please drag and drop or select the Sales YTD as the Indicator Value.
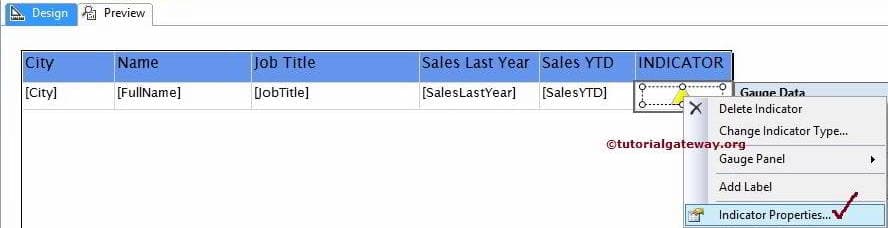
Next, we have to configure the Indicator Properties. So, right-clicking on the Indicator will open the context menu. Please select the Indicator Properties option from it.
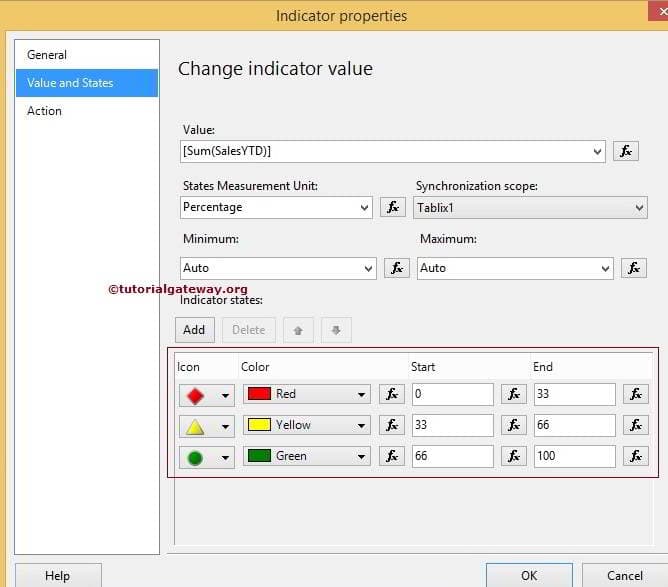
Once you select the Properties option, a new window will be opened to configure the values. First, go to the Values and State tab; you can notice the default settings of the SSRS indicator values here.
- Please refer to the Formatting Indicators article to see the format options.
By default, the State Measurement Unit value is Percentage, from 0 to 33 Red, 33 to 66 Yellow, and 66 to 100 Green Indicators. If you want to change the percentage values, you can replace the default value or use the fx button for custom expressions.
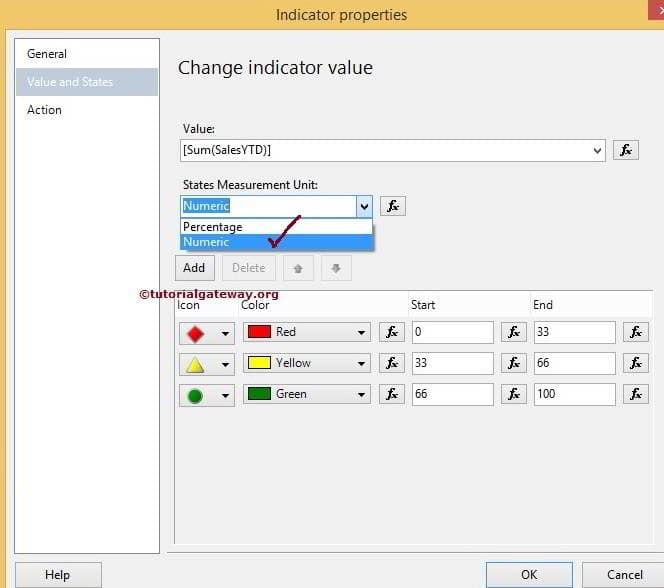
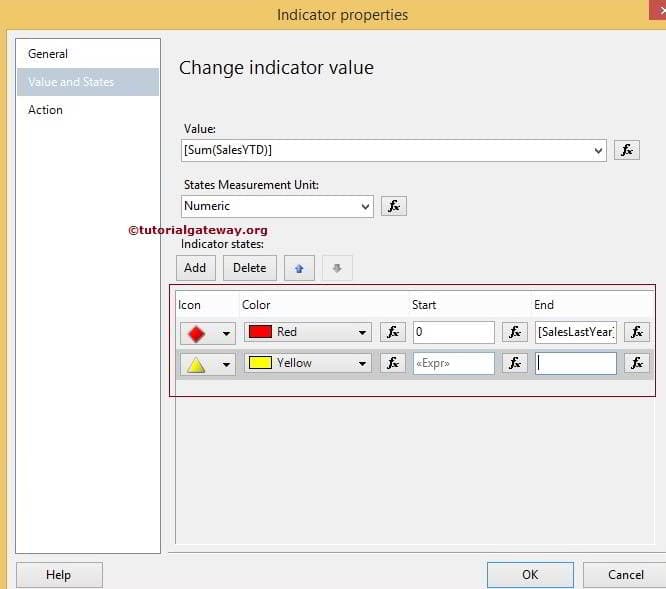
In this SSRS example, we want to display the indicators based on Numeric values. So, Please change the States Measurement Unit value from Percentage to Numeric. We are also removing Green Indicator by selecting Green and deleting it.
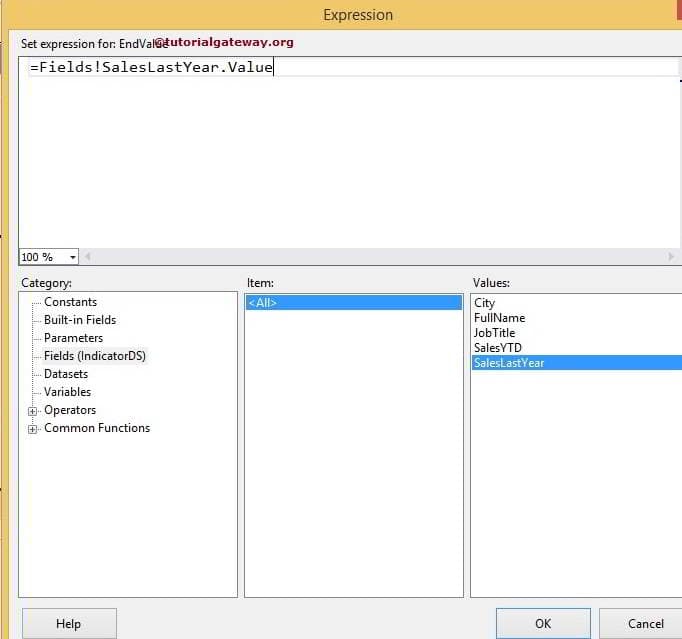
From the above screenshot, we are okay with the Start value of 0 for the Red indicator. However, we have to change the End value. So, we are selecting the fx button next to the End value Textbox and writing the following expression.

If the Sales YTD value is between 0 and the Sales Last Year’s Value, then Red Indicator will be displayed.
Next, We are changing the Starting value of the Yellow indicator. Click the fx button next to the Start value Textbox and write the following expression.
Next, We are leaving the End value of a Yellow SSRS Indicator empty. If the Sales YTD value is greater than the Sales Last Year, then a Yellow Indicator will be displayed.
Click OK to finish configuring the Indicator properties. Let’s see the Report preview by clicking on the preview tab.