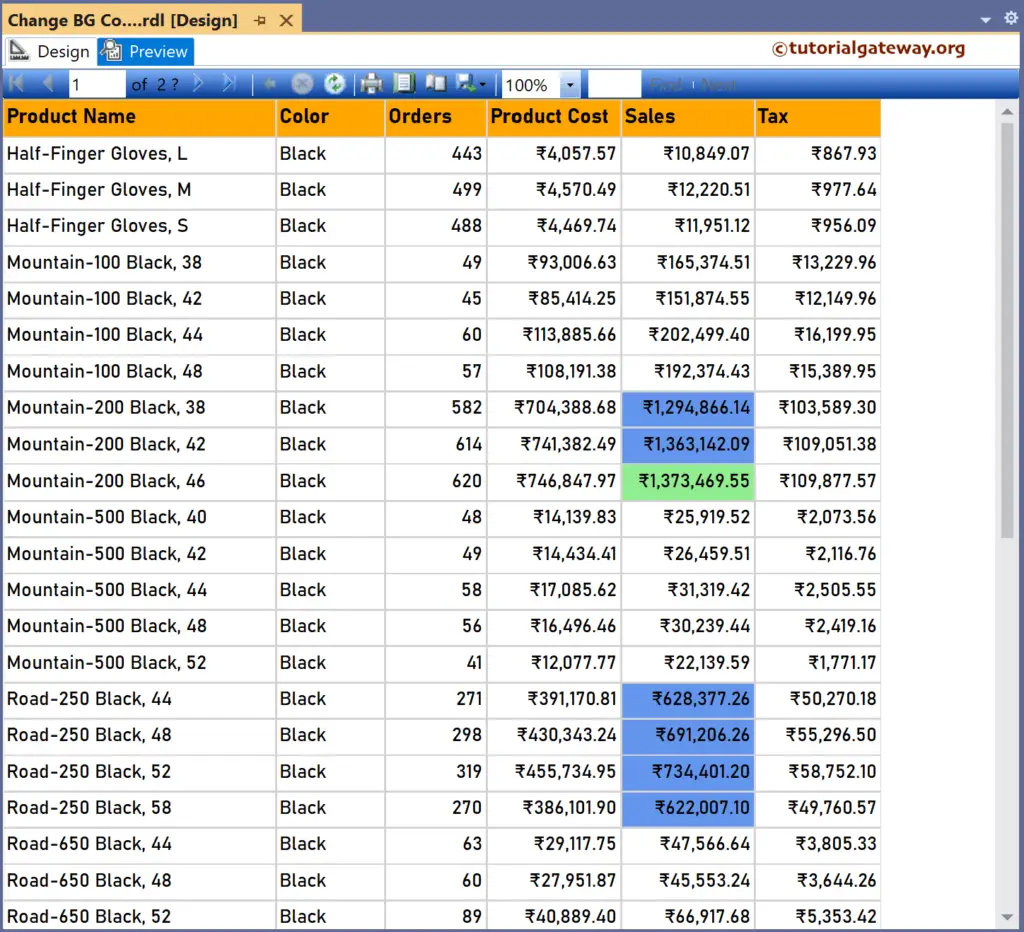
This SSRS article shows how to change the background colors of a column with min (minimum) and max (maximum) sales values to highlight them with an example.
Right-Click on the Datasets folder to create a new DataSet. The below screenshot shows the data set that we use for this example.
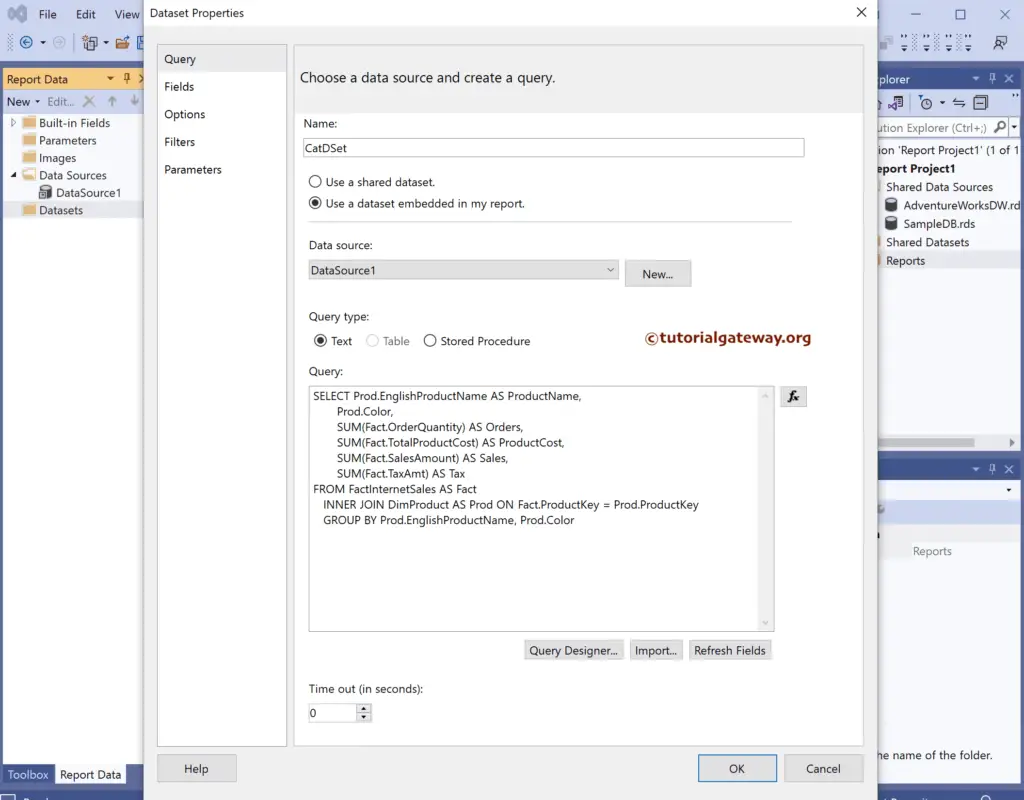
The Sql query that we used above SSRS example is:
SELECT Prod.EnglishProductName AS ProductName,
       Prod.Color,
       SUM(Fact.OrderQuantity) AS Orders,
       SUM(Fact.TotalProductCost) AS ProductCost,
       SUM(Fact.SalesAmount) AS Sales,
       SUM(Fact.TaxAmt) AS Tax
FROM FactInternetSales AS Fact
   INNER JOIN DimProduct AS Prod ON Fact.ProductKey = Prod.ProductKey
   GROUP BY Prod.EnglishProductName, Prod.Color
We have designed a simple table report of Product Sales and formatted the font and colors.
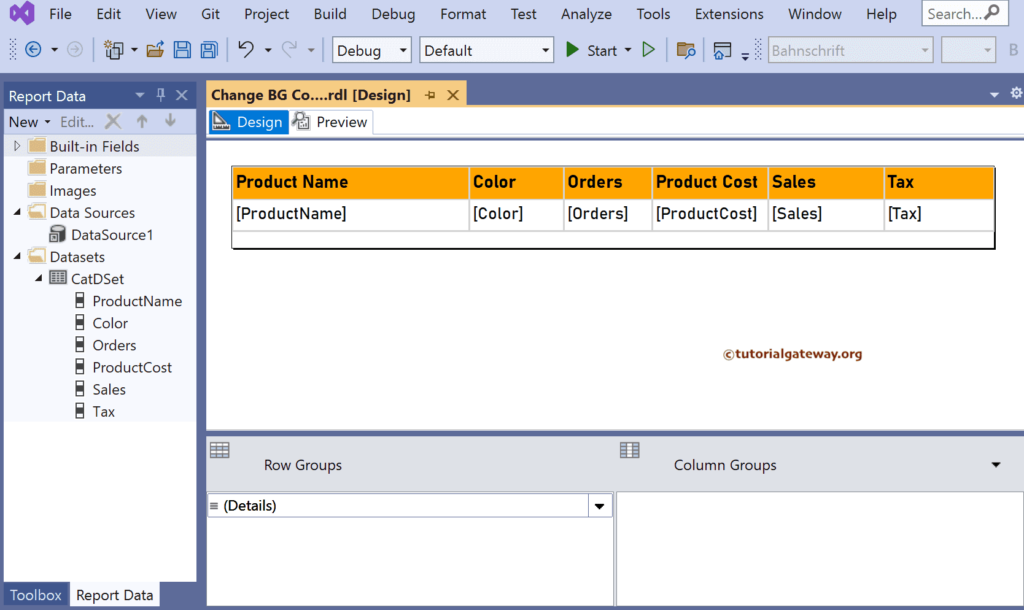
Change Background Colors of SSRS Min and Max Table Columns
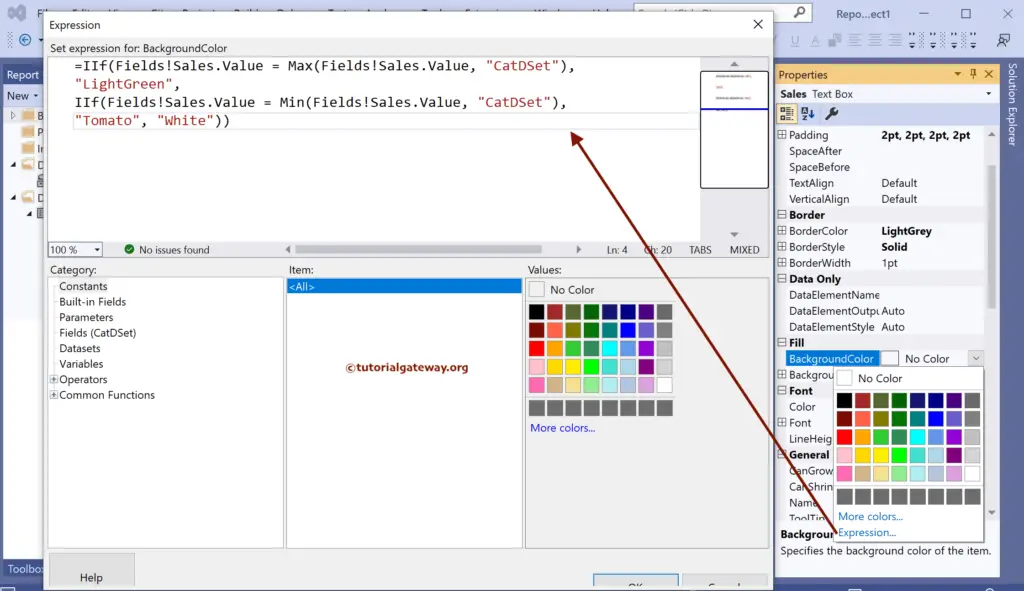
Select the Sales column and go to the Background color properties window. Next, click the Expression hyperlink to writing an expression.
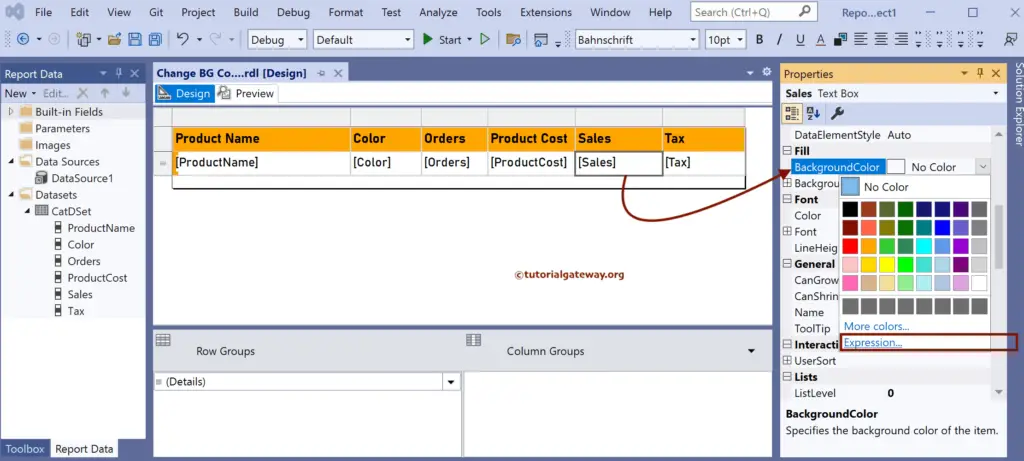
Here, we used the Nested IIF condition to check whether the Sales value equals Maximum or Minimum sales within the dataset. If True, assign Light Green for Max and Tomato for Min column. Otherwise, white.
Remember, if you forgot to place the Dataset name as the second argument, it treats every row as unique. Therefore, it will assign Light green for all the columns because each one is unique.
=IIf(Fields!Sales.Value = Max(Fields!Sales.Value, "CatDSet"), "LightGreen",
IIf(Fields!Sales.Value = Min(Fields!Sales.Value, "CatDSet"), "Tomato", "White"))
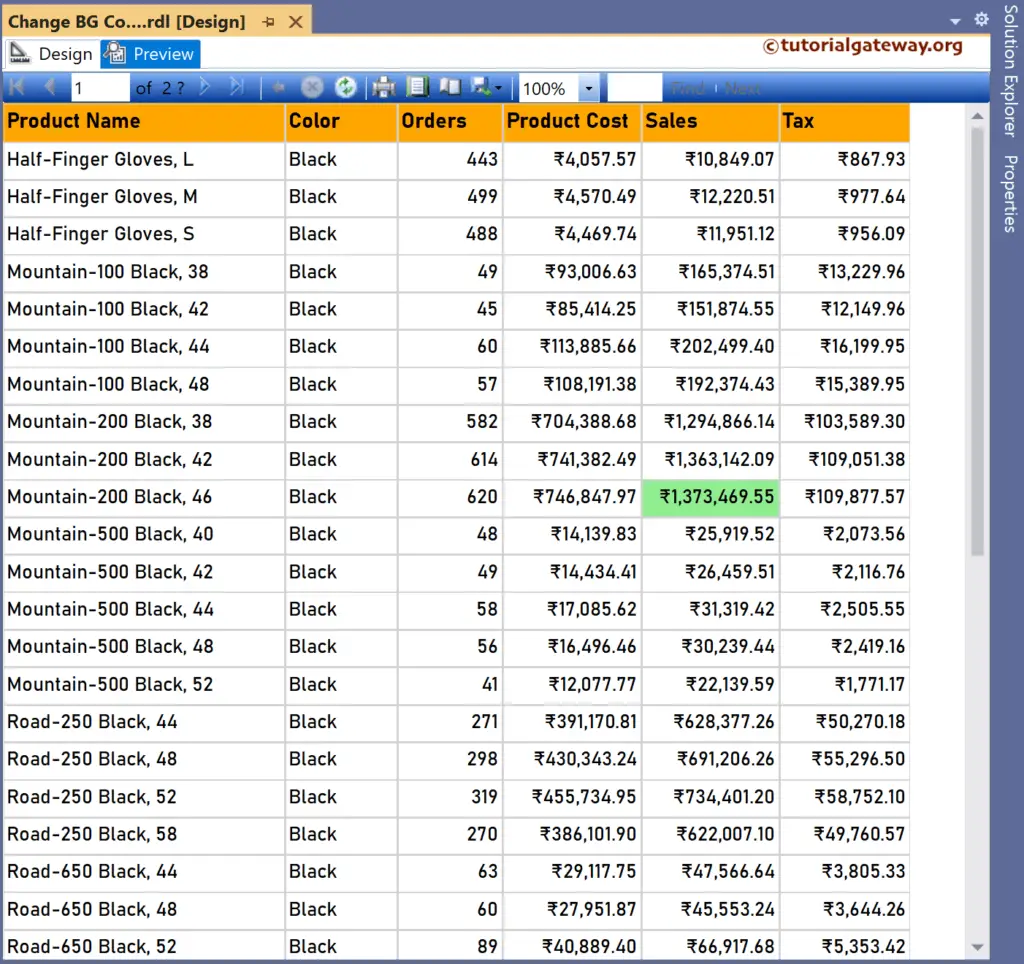
If you observe the report preview, the maximum Sales column highlights a light green background.
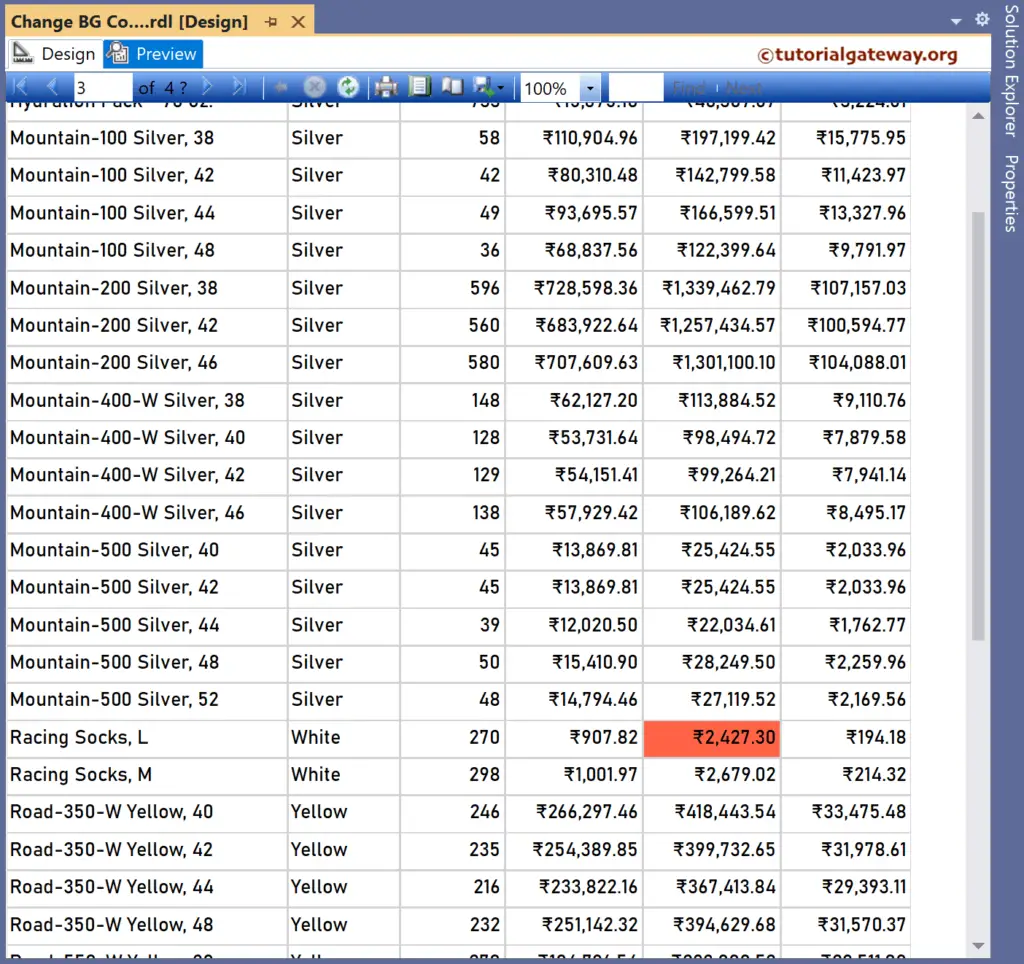
On the third page, you can see the Tomato color for the minimum sales column.
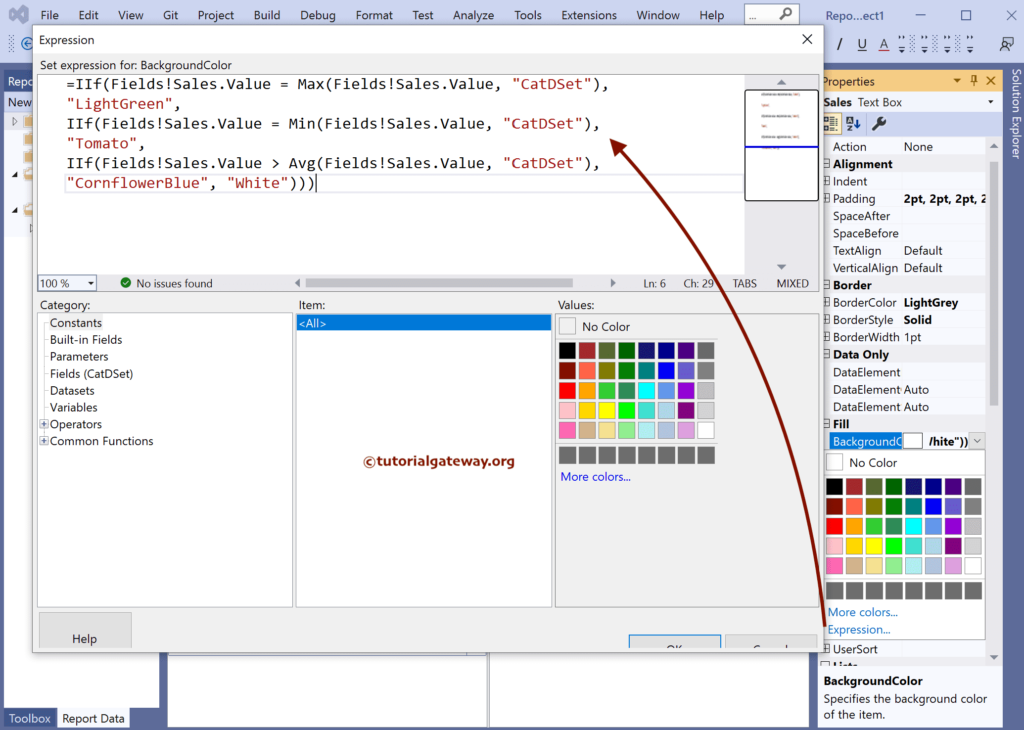
Let me edit the background color expression, and add cornflower blue for the columns with sales greater than average.
=IIf(Fields!Sales.Value = Max(Fields!Sales.Value, "CatDSet"),
"LightGreen",
IIf(Fields!Sales.Value = Min(Fields!Sales.Value, "CatDSet"),
"Tomato",
IIf(Fields!Sales.Value > Avg(Fields!Sales.Value, "CatDSet"),
"CornflowerBlue", "White")))
Preview the report.
