This SSRS article shows how to create a drill down table report with subtotals and grand totals with an example. It is effortless to design using a report wizard, but there is a workaround to create a drilldown report manually.
Right-click on the Datasets folder to create a new DataSet. The below section uses the Adventure Works DW database as the DataSource and embedded DataSet we use for the SSRS Drill Down Table Report with Totals example.
The Sql query that we used for this SSRS example is:
SELECT Cat.[EnglishProductCategoryName] AS Category,
       SubCat.[EnglishProductSubcategoryName] AS SubCategory,
       Prod.EnglishProductName AS ProductName, Prod.Color,
       SUM(Fact.OrderQuantity) AS Orders, SUM(Fact.TotalProductCost) AS ProductCost,
       SUM(Fact.SalesAmount) AS Sales, SUM(Fact.TaxAmt) AS Tax
FROM FactInternetSales AS Fact
   INNER JOIN DimProduct AS Prod ON Fact.ProductKey = Prod.ProductKey
   INNER JOIN DimProductSubcategory AS SubCat ON Prod.ProductSubcategoryKey = SubCat.ProductSubcategoryKey
   INNER JOIN DimProductCategory AS Cat ON SubCat.ProductCategoryKey = Cat.ProductCategoryKey
GROUP BY Cat.[EnglishProductCategoryName], SubCat.[EnglishProductSubcategoryName],
		Prod.EnglishProductName, Prod.Color
How to Create SSRS Drill Down Table Report with Totals?
We have designed a simple table report of product sales and formatted the font and colors. To create a drill down report, we need a group by column. So, under the Row group section, click the down arrow beside the details and select Add Group and Parent Group.
Let me choose the subcategory column as the group by option and checkmark the Add group header option. The Add group header option will add an empty row beside each subcategory.

Select all the empty columns below the Header and select the Merge Cells option. Right-click on the orders cell and choose the Add Total option to get the SSRS Drill Down Table Report subtotals. Do the same for the Product cost and sales columns. Next, Merge the empty columns below the product name and color (Totals) by right-clicking and choosing the Merge Cells option.
Next, select the subtotals row and go to its properties to change the Row background color. To get the grand total, right-click on the Sales subtotal column and choose to add the total option. Then, do the same for the orders and Product Cost columns.
Select the SSRS Drill Down Table Report grand total row and change its background color. Also, right-click on empty columns to choose merge cells. Please refer to the Add Total and grand Total article to understand the steps.
Apply DrillDown
Go to the Details section, Group Properties.

Click the Visibility tab, and select the Hide option to hide the entire details row when the report initially runs. Next, checkmark the Display can be toggled by this report and select SubCategory from the available list.

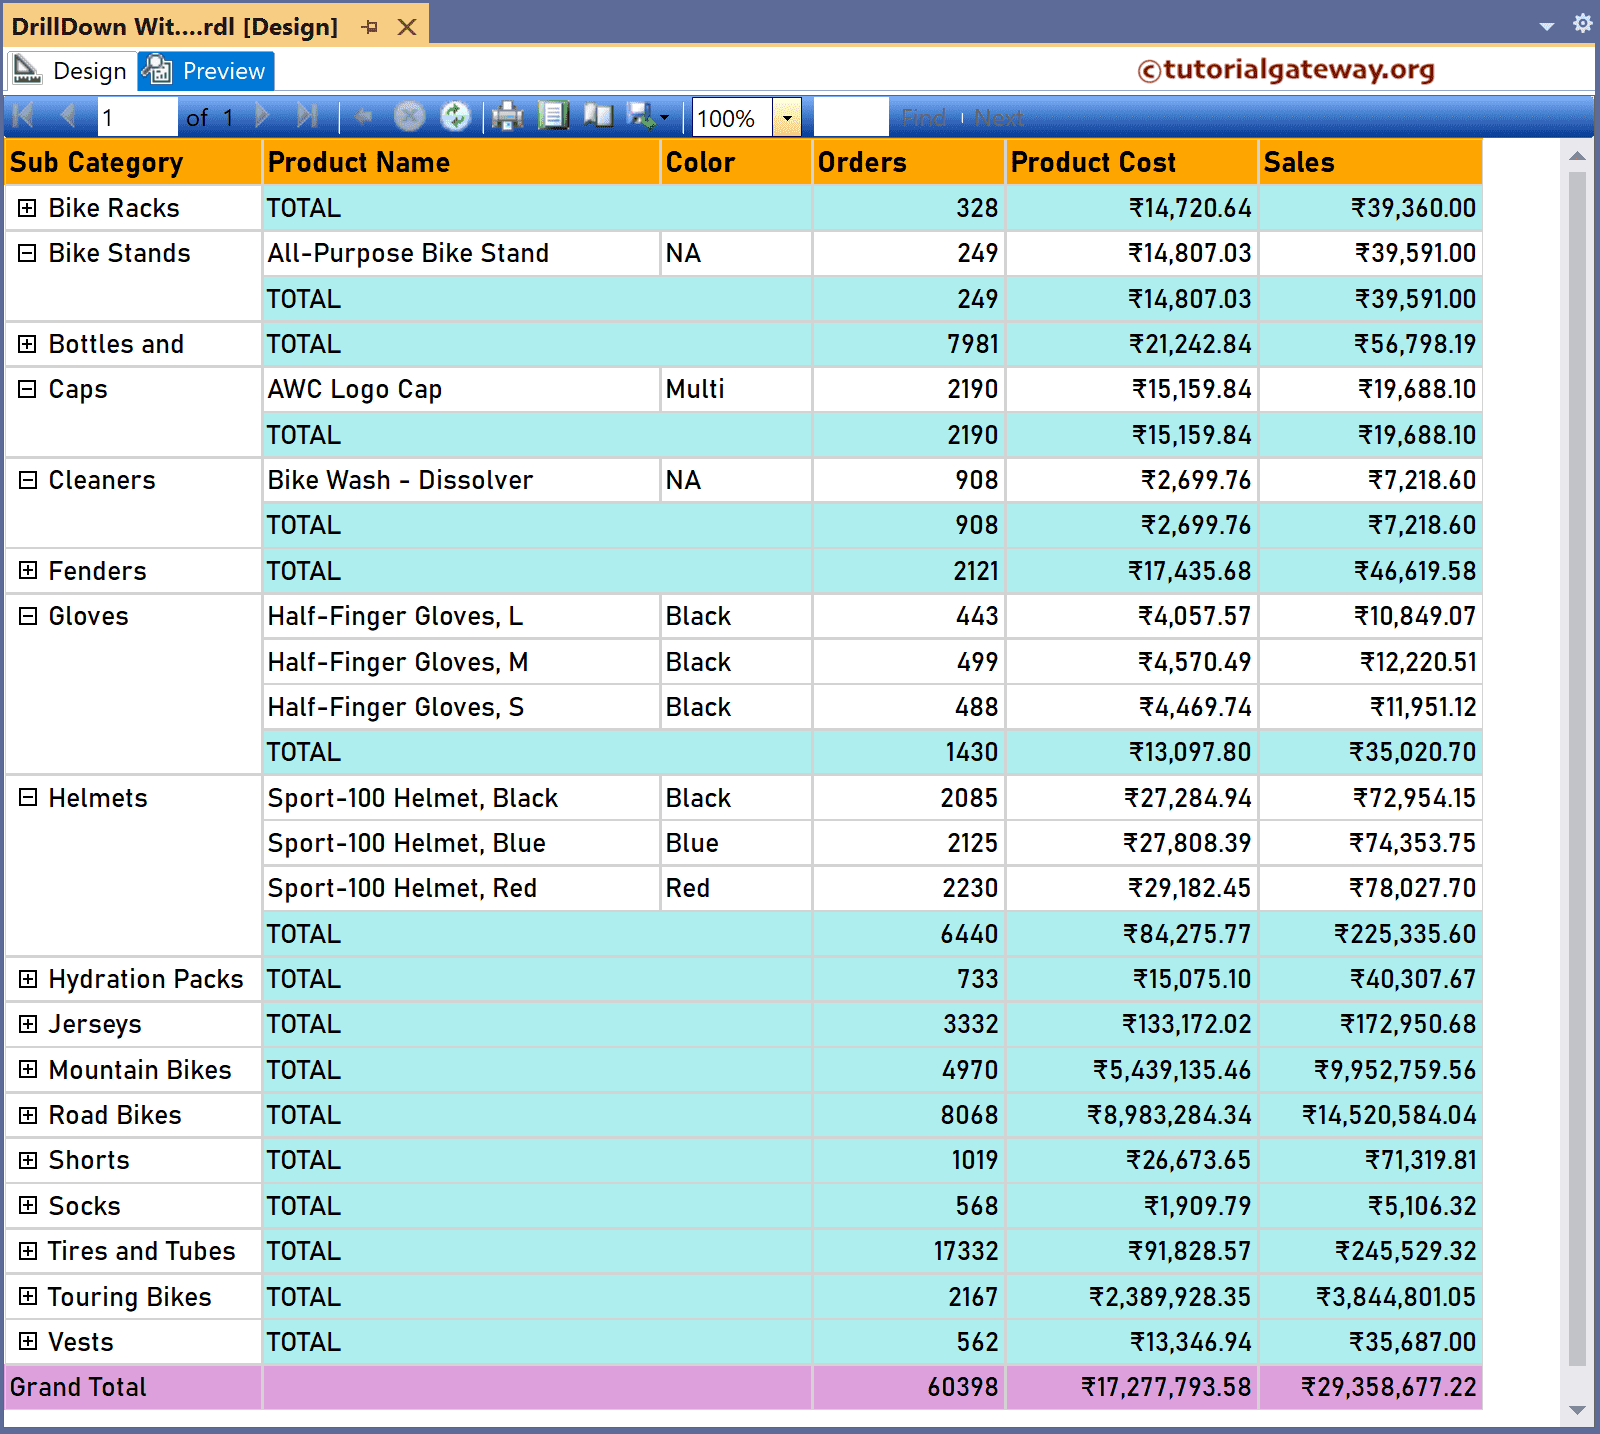
In the SSRS drill down table report preview, you can see a little plus button beside each sub-category, and it also displays the totals for each product subcategory. Click the plus button to view the detailed report of that particular sub-category.

If you are uncomfortable with extra empty row cells (at the top) besides the sub-category, right-click and select the delete rows option. As you can see, there is no empty row about the details.

Let me expand a few sub-categories and go to the end of the last page to see the subtotals and grand total. Let me show you the SSRS Drill Down Table Report with the Totals preview again. Again, it looks much cleaner than the previous one. You can see the block grouped drill down table report with subtotals and grand totals.