In this article, we will show you how to create and configure the Gauges in SSRS. For this, We are going to use the below-shown report.
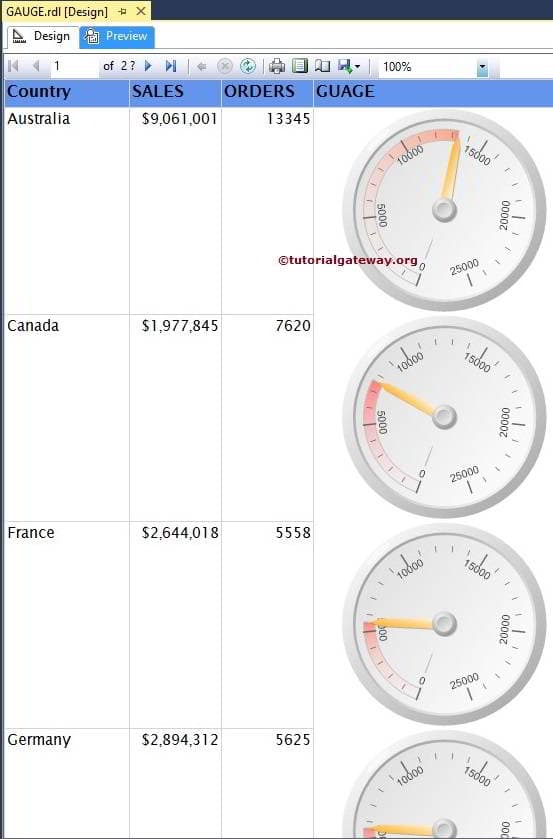
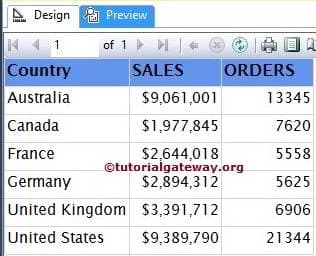
If you see the below screenshot, It was a regular Table report with Country Name, Sales, and Total Number of Orders columns.
Create Gauges in SSRS
In this example, We will create and add the SSRS Gauges on the right-hand side of the Orders column. So, First, create an Empty column by right-clicking on the Orders column, selecting the Insert Column option, and then selecting the right option.
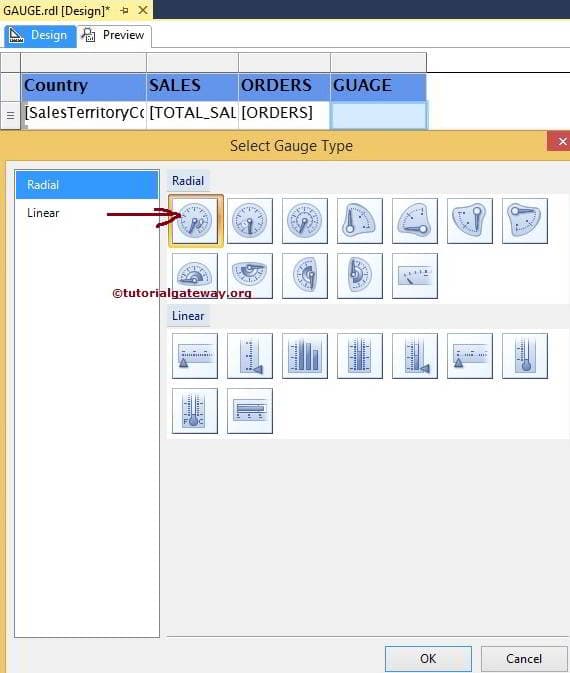
Next, Drag and drop the Gauges from the Toolbox to an Empty column. When you drop the Gauges into an Empty column, a new window called Select Gauges Type will be opened to select the required Gauges (Radial and Linear) from the available ones.
Please refer to the Table Report, Data Source, and Dataset articles to understand the creation of the Data Source, Dataset, and Table report. In this SSRS example, we used the Embedded Dataset for the above report, and the SQL Command we used as the Dataset is:
-- Query required to demonstrate Gauges
SELECT [SalesTerritoryCountry]
      ,SUM ([OrderQuantity])AS ORDERS
      ,SUM ([SalesAmount])AS [TOTAL SALES]

  FROM [DimSalesTerritory]
  INNER JOIN FactInternetSales ON
  [DimSalesTerritory].SalesTerritoryKey = FactInternetSales.SalesTerritoryKey
  GROUP BY [SalesTerritoryCountry]
  ORDER BY [SalesTerritoryCountry]
In this example, we are selecting SSRS Simple Radial Gauges.
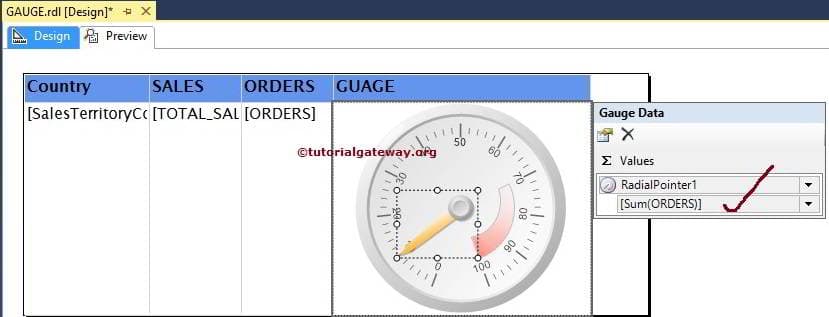
Click Ok to add Radial Gauge to a newly created empty cell. Now, we have to configure the Gauges value. First, Clicking on the Gauges will open the Gauge Data window.
In this example, we want to show the Radial Pointer for Orders. So, Please drag and drop or select the orders as the Indicator Value.
Next, we must configure the Scale Properties of a Gauge in SSRS. So, Right Click on the Scale will open the context menu. Please select the Scale Properties option from it.
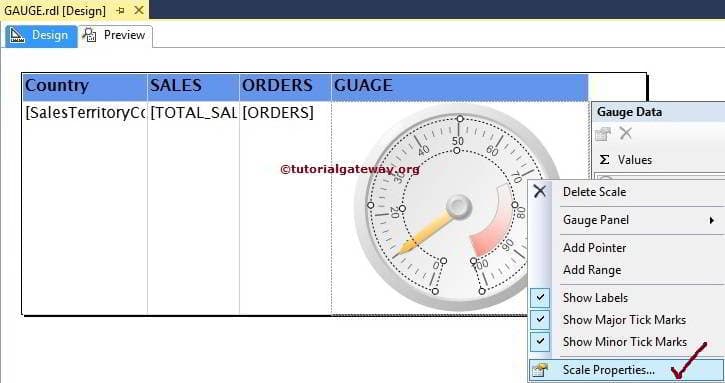
Once you choose the Scale Properties option, a new window will be opened to configure the SSRS Gauge Scale. From the General tab, you can notice a Radial gauge scale’s default Minimum and Maximum values.
By default, The Minimum and maximum values of the Radial Scale will be between 0 and 100. Here, we leave the minimum value at 0 and the maximum value at 25000. You also use the fx button for custom expressions.
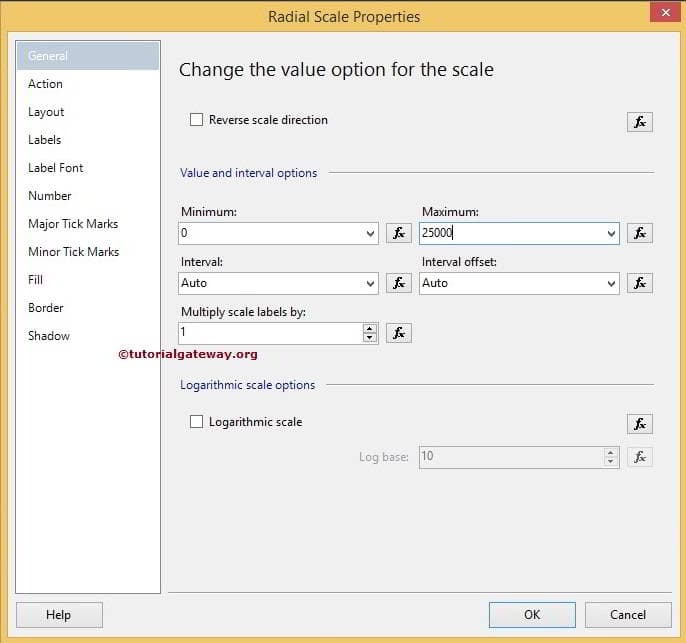
NOTE: You can also customize the Gauges intervals between Minimum and Maximum values using the Interval property.
Click Ok to finish configuring the SSRS Radial Gauge properties. Let’s see the Report preview by clicking on the preview tab.
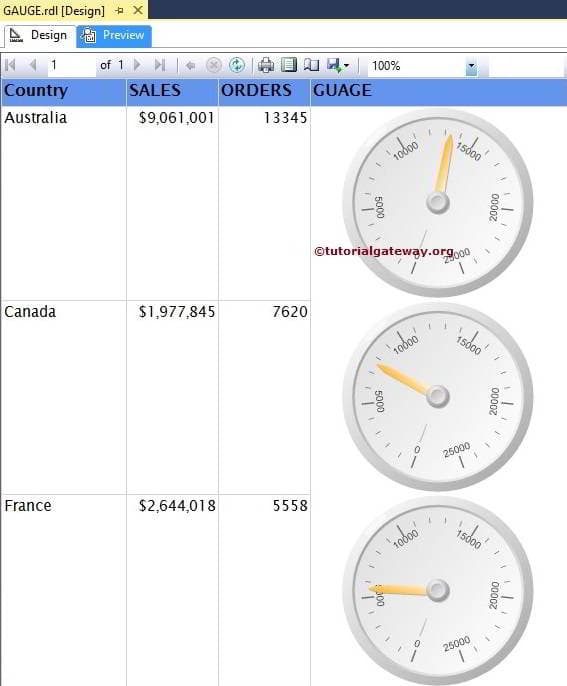
We successfully created the basic Radial Gauge.
- Please refer to the Formatting Gauges article to see the formatting options.
How to add Range to Gauges in SSRS
If you observe the speed meter of a Car or Bike, you can see the Green, Red, and Default White colors inside the Radial Gauge, and each color has a meaning. If you want to apply the same in the Reports, you can use the Range property of gauges.
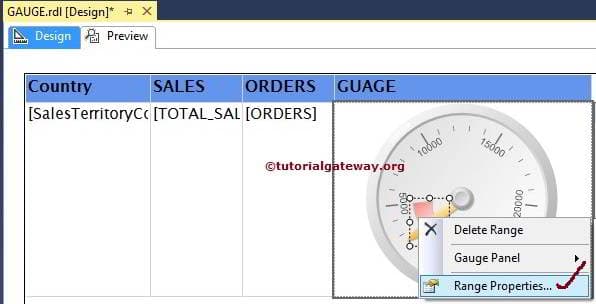
To add the Range, right-click on the Scale, which will open the context menu. Please select the Add Range option from it, as shown in the below screenshot.
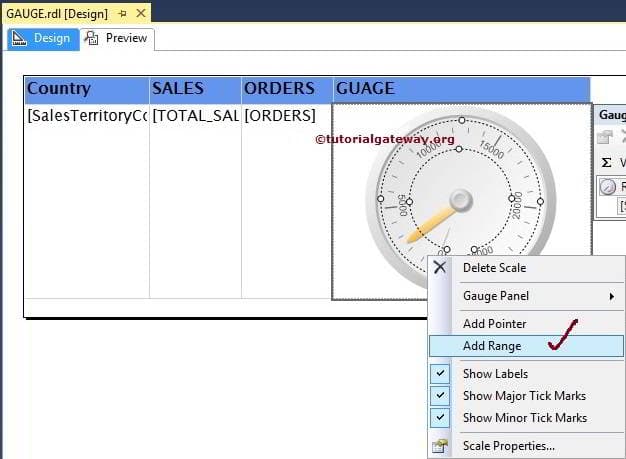
Next, we have to configure the range properties by right-clicking on the range and selecting Range Properties.. option.
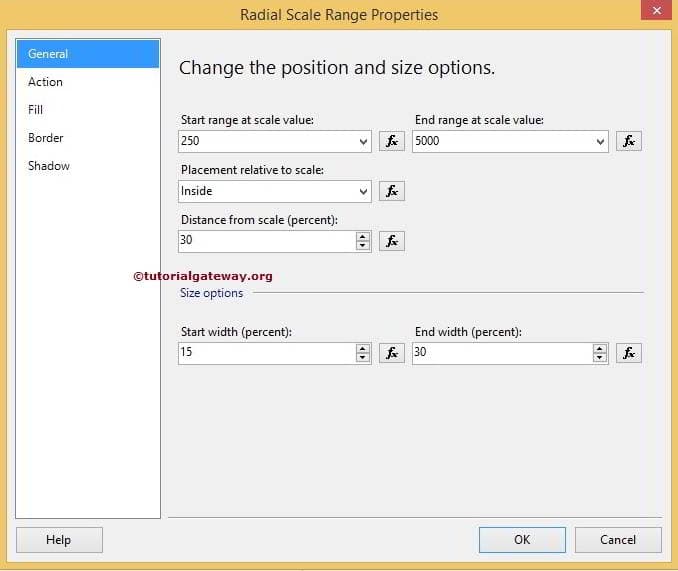
Once you choose the Range Properties.. option, a new window called Radial Scale Range Properties will be opened to configure the Range scale of an SSRS gauge.
- Start range at Scale Value: The default value is 250, which means the range will start at 250, but you can change it as per the requirements.
- End range at Scale Value: By default, 5000, which means the Gauge range will End at 5000—change as per the requirements.
- Placement relative to scale: Here, decide whether you want to place the range inside the scale, outside the scale, or across the scale.
- Start width: Range width at the starting position. By default, 15, but you can change it accordingly.
- End width: Ending position Range width. By default, 30. Change as per your needs.
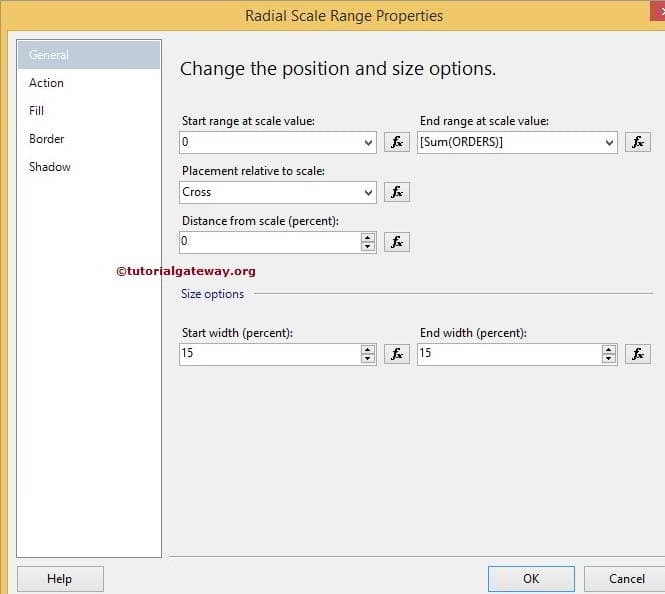
In this example, we changed the starting position to 0 and the end position to Sum(Orders). Range will start at 0 and finish at Sum(Orders) value.
Click Ok to finish configuring the Range properties of a Radial range. Let’s see the Gauges Report preview by clicking on the preview tab.