This SSRS article explains how to highlight the minimum (min) and maximum (max) rows in a table report using the IIF condition or Switch statement expressions.
Right-click on the Datasets folder to create a new DataSet. The below URLs show the DataSource and data set that we use for this example.
The Sql query that we used for this SSRS example is:
SELECT [FirstName] +  ' ' + [LastName] AS FullName
      ,[Education]
      ,[Occupation]
      ,[YearlyIncome]
      ,[Sales]
      ,[HireDate]
  FROM [Employee]
We have designed a simple table report of Employee Sales and formatted the font and colors. Let me show you the preview of the report.
Highlight SSRS Table Min and Max Rows
Select the complete details row and go to the Background color properties window. Next, click the Expression hyperlink to write an expression.

Here, we used the Nested IIF condition to check whether the Sales value equals. the DataSet Maximum. If True, assign a Sea Green Color to that row. Otherwise, the second iif condition checks whether the Sales value equals DataSet Minimum. If True, Orange; else, Transparent color.
=IIf(Fields!Sales.Value = Max(Fields!Sales.Value, "EmpDataSet"), "SeaGreen",
IIf(Fields!Sales.Value = Min(Fields!Sales.Value, "EmpDataSet"),
"Orange","Transparent"))

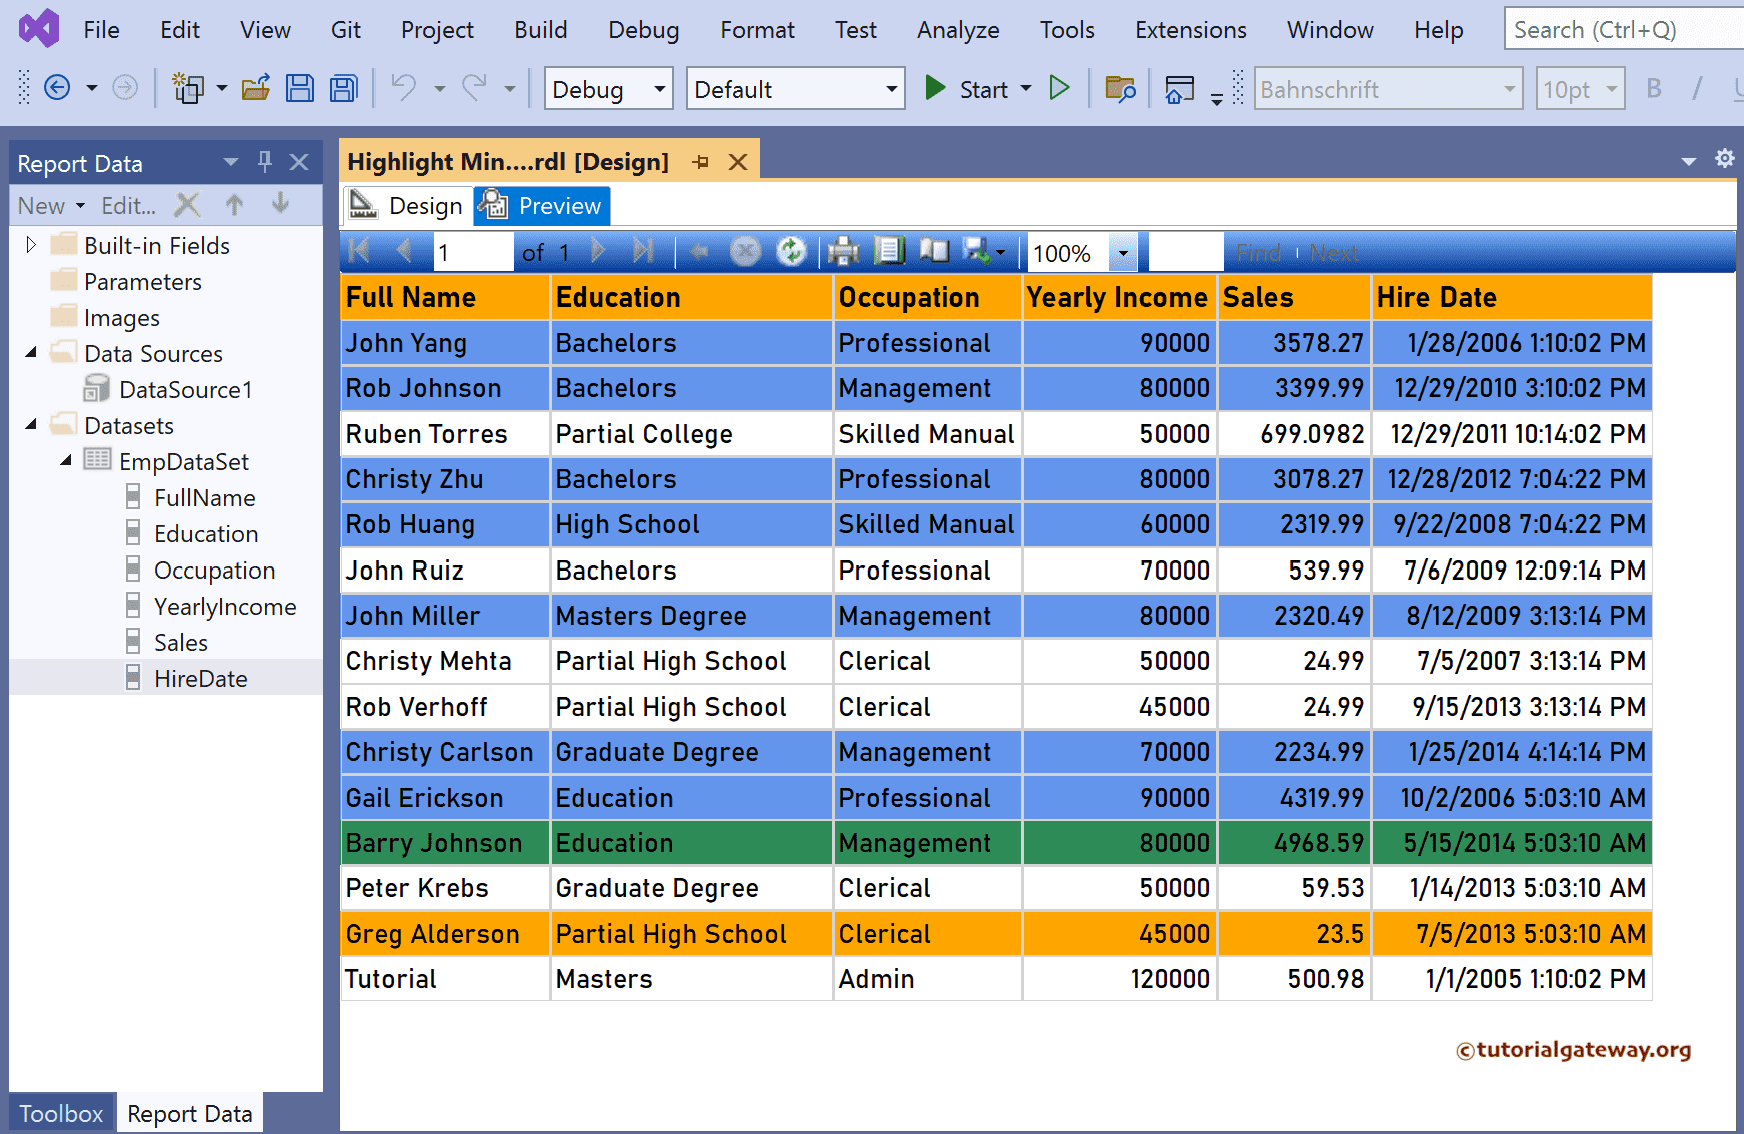
Now, if you see the table report preview, the Minimum and maximum rows are highlighted.

Let me replace the IIf condition with the below switch expression. It changes the background color of Minimum, Maximum, and sales greater than average sales highlights table rows. To do so, click the expression as shown in the first image and replace the code in the second image with the below expression.
=Switch(Fields!Sales.Value = Max(Fields!Sales.Value, "EmpDataSet"), "SeaGreen",
	Fields!Sales.Value = Min(Fields!Sales.Value, "EmpDataSet"), "Orange",
	Fields!Sales.Value >= Avg(Fields!Sales.Value, "EmpDataSet"), "CornflowerBlue",
	Fields!Sales.Value < Avg(Fields!Sales.Value, "EmpDataSet"),"Transparent")
Preview the report with the switch case.