This SSRS article shows how to use the report parameter value to show or hide the columns in a table report with an example. To do this, right-click on the Datasets folder to create a new DataSet.
The below code shows the data set we use for this SSRS Parameter Value to Show or Hide Table Columns example and it returns 15 records.
The Sql query that we used above SSRS example is:
SELECT [FirstName] +  ' ' + [LastName] AS FullName,[Education]
      ,[Occupation],[YearlyIncome],[Sales],[HireDate]
  FROM [Employee]
SSRS Parameter Value to Show or Hide Table Columns
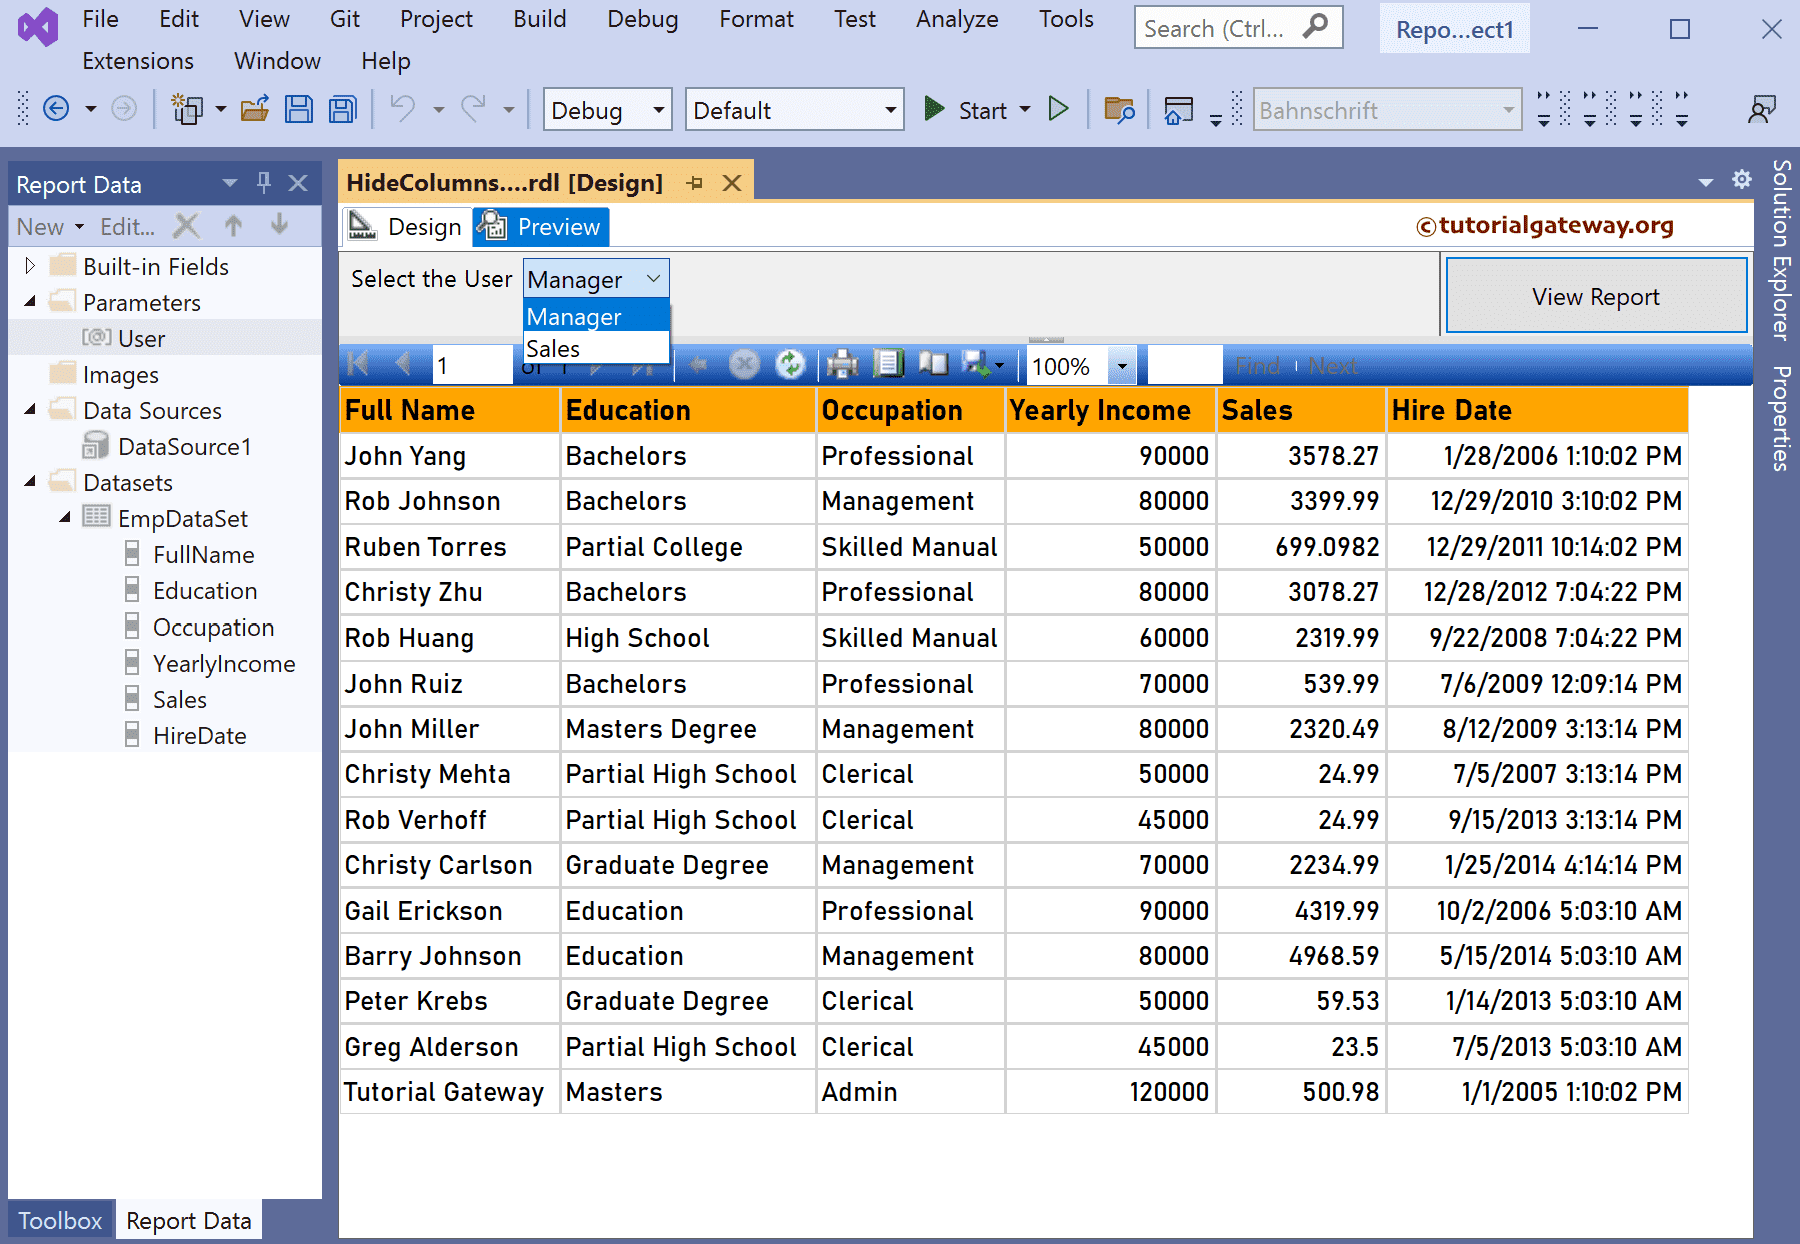
We have designed a simple table report of employee sales and formatted the font and colors.
Right-click on the Parameters folder and choose the Add Parameter option. It will open the following window. Add User as the name and Select the User as prompt text.

Under the Available Values tab, select the Specify values option and click the Add button. Next, enter the available parameter values as Manager and Sales.
For example, if we select Manager, it has to display all the columns, and if Sales is picked, then Hide a few columns.

Next, click the down arrow under the Column group section and select Advanced Mode.

We want to hide the Employee yearly Income column. So, under the Column Group, click the Static representing the Income column and go to the Properties window.
Under the Visibility section, change the Hidden property from default False to Expression.

We check whether the @User parameter value equals Sales in the expression window. If True, hide this Yearly Income Column. Otherwise, display it.
=Parameters!User.Value = "Sales"

Similarly, we used the same expression to hide the Hire Date Column. To do so, select the Hire Date header, change the visibility property expression, and write the below expression. If the user is Sales, hide the Yearly Income (previous step) and Hire Date column.
=Parameters!User.Value = "Sales"
Now, if you go to the report preview, it displays all the columns for the Manager.
If I select Sales as the parameter value, it does not show the Yearly Income and Hire Date Columns. However, the best part is it automatically adjusts the empty space between the columns.
