Tutorial Gateway

  • C
  • C#
  • Java
  • Python
  • SQL
  • MySQL
  • Js
  • BI Tools
    • Informatica
    • Talend
    • Tableau
    • Power BI
    • SSIS
    • SSRS
    • SSAS
    • MDX
    • R Tutorial
    • Alteryx
    • QlikView
  • More
    • C Programs
    • C++ Programs
    • Go Programs
    • Python Programs
    • Java Programs

Create SSRS Report using Views

by suresh

In this article, we will show you how to Create an SSRS Report using Views with an example. It is one of the frequently asked questions by SSRS followers. To demonstrate the same, we are going to use the SalesPerson View that comes with the Adventure Works database.

Below screenshot will show you the data inside the View:

TIP: 
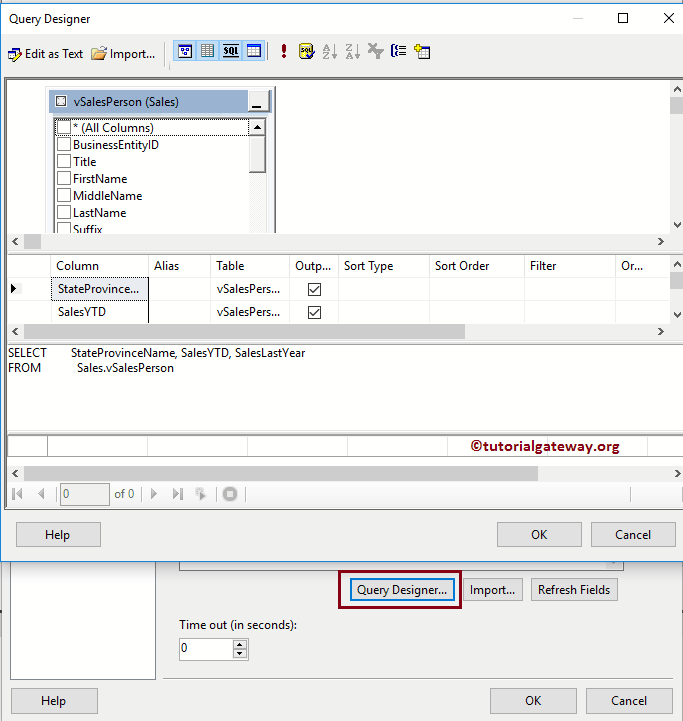
If you want to create a custom view on your own, then I suggest you refer to the SQL VIEWS article that we mentioned in the SQL Server Tutorial.

Create SSRS Report using Views 1

For this example, we are going to write the Custom SQL query to select three column from the Sales Person View:

USE [AdventureWorks2014]
GO
SELECT [StateProvinceName] 
      ,[SalesYTD]
      ,[SalesLastYear]
  FROM [Sales].[vSalesPerson]

and the data for the above query is:

Create SSRS Report using Views 0

Create SSRS Report using Views

In this example, we are going to create a Column Chart to display the step by step approach to create an SSRS report using Views.

The below SSRS screenshot will show you the Data Source and Dataset we used for this Column Chart Report.

Create SSRS Report using Views 2

If you find it difficult to write the Custom SQL Query, then use the Query Designer to design the required query.

Create SSRS Report using Views 3

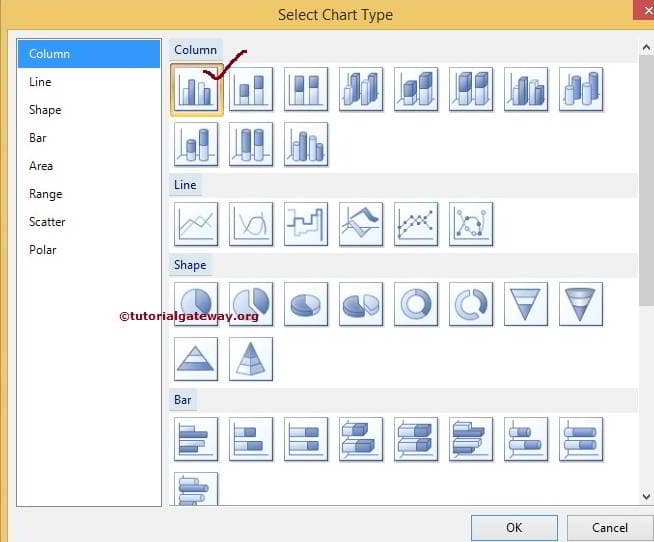
Right-click on the report designer and select the Insert -> Chart option

Create SSRS Report using Views 4

For this Create SSRS Report using Views example, we are selecting Column Chart.

Create SSRS Report using Views 5

Clicking the Ok button displays the Column chart in the design region with dummy data.

Create SSRS Report using Views 6

Clicking on the empty space around the Column Chart will open the Chart Data window. In this example, we will create a Column chart for the Sales YTD and Sales last Year. So, Drag and drop them from dataset to chart data values and State Province name in the category group.

I suggest you to refer to Create Column Chart in SSRS article to understand the creation of Column chart

Create SSRS Report using Views 7

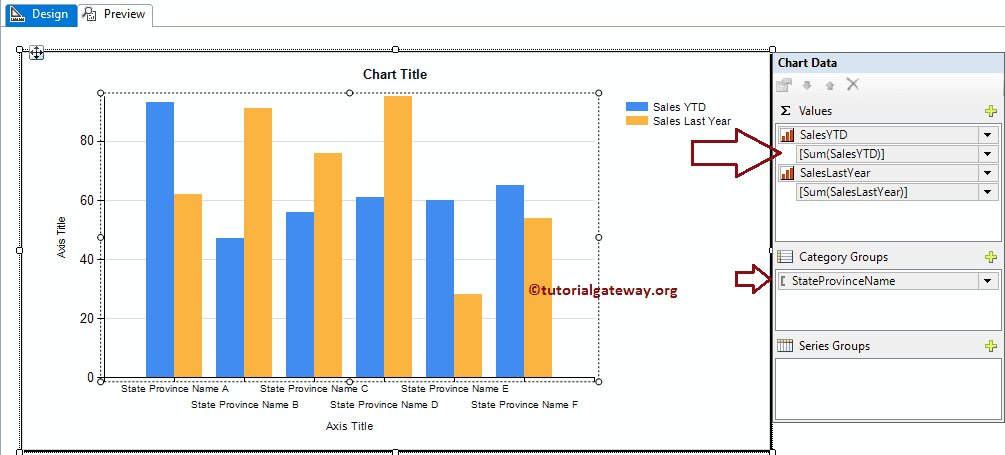
Click on the Preview button to see the report preview.

Create SSRS Report using Views 8

From the above screenshot, you can see that we created a SSRS Column report using the Sales Person View. Let me Format the chart a bit for the classy look.

Remember, we already explained the Formatting options in Formatting Column Chart.

Create SSRS Report using Views 9

Placed Under: SSRS

  • Learn SSRS in 28 Days
  • Create New SSRS Project
  • Create a New SSRS Report
  • SSRS Query Designer
  • SSRS Shared Data Source
  • SSRS Shared Dataset
  • SSRS Embedded Dataset
  • SSRS Embedded Data Source
  • SSRS Lookup – combine datasets
  • SSRS Report Items
  • SSRS Table Report
  • SSRS Table using report wizard
  • Format SSRS Table Report
  • SSRS Matrix Report
  • SSRS Matrix with report wizard
  • Display Image in SSRS Report
  • Add Rectangle to SSRS Report
  • Add TextBox to SSRS Report
  • Create a SSRS List Report
  • Grouping in SSRS Matrix Reports
  • Grouping in SSRS Table Reports
  • Create SSRS Report using Views
  • SSRS report with store procedure
  • Add Total and Subtotal to Report
  • Add Headers & Footers to Report
  • SSRS Global References
  • Export Report to PDF, XML, Excel, Word
  • Format SSRS Table Report
  • Format Textbox Fonts & Bg Color
  • Format Numbers in SSRS Report
  • Format SSRS Report Date, Time
  • Add Row Numbers to Report
  • Headers Visible While Scrolling
  • Repeat Headers on Each Page
  • SSRS Sorting
  • SSRS Interactive Sort
  • Filters at Dataset Level in SSRS
  • Filters at Tablix Level in SSRS
  • Page Breaks in SSRS Report
  • Custom Code in SSRS Report
  • SSRS Calculated Fields
  • SSRS Dashboard Reports
  • SSRS Document Map
  • SSRS Drill Through Reports
  • SSRS Drill Down Reports
  • SSRS Drill Down Matrix Report
  • SSRS Go To URL Action
  • SSRS Subreports
  • SSRS Report Parameters
  • SSRS Cascading Parameters
  • SSRS Multiple Parameters
  • SSRS Multi Value Parameter
  • SSRS Drop Down List Parameters
  • SSRS Charts
  • SSRS Area Chart
  • SSRS Bubble Chart
  • SSRS Column Chart
  • Format SSRS Column Chart
  • SSRS Data Bars
  • Data Bars in SSRS Matrix Reports
  • Format SSRS Data Bars
  • SSRS Funnel Chart
  • SSRS Linear Gauges
  • SSRS Radial Gauges
  • Format SSRS Gauges
  • SSRS Indicators
  • Format SSRS Indicators
  • SSRS Line Chart
  • SSRS Pie Chart
  • Format SSRS Pie Chart
  • SSRS Pyramid Chart
  • SSRS Range Chart
  • SSRS Radar Chart
  • SSRS Scatter Plot
  • SSRS Sparkline
  • SSRS Stacked Bar Chart
  • SSRS Configuration Manager
  • Change Report Manager Title
  • SSRS Deploying Reports in BIDS
  • Deploy using Report Manager
  • SSRS Report Manager Shared DataSource
  • SSRS Cached Reports
  • SSRS Linked Reports
  • SSRS Report Parts
  • SSRS Report Snapshot
  • SSRS Report History Snapshot
  • SSRS Report Subscription
  • SSRS Security
  • Upload File to Report Manager
  • Install SSRS Report builder
  • Report Builder – Create a Report
  • Report Builder – Create a Dataset
  • Report Builder- Create Bar chart
  • Report Builder – Create Pie Chart
  • Report Builder – Create report without wizard

Copyright © 2021 · All Rights Reserved by Suresh

About Us | Contact Us | Privacy Policy