This SSRS article shows how to limit the total number of rows displayed per Page in a table report by dividing the row number by 10 with an example. To do this, right-click on the Datasets folder to create a new DataSet.
The below screenshot shows the data set that we use to this limit the number of rows per page in the SSRS report example.
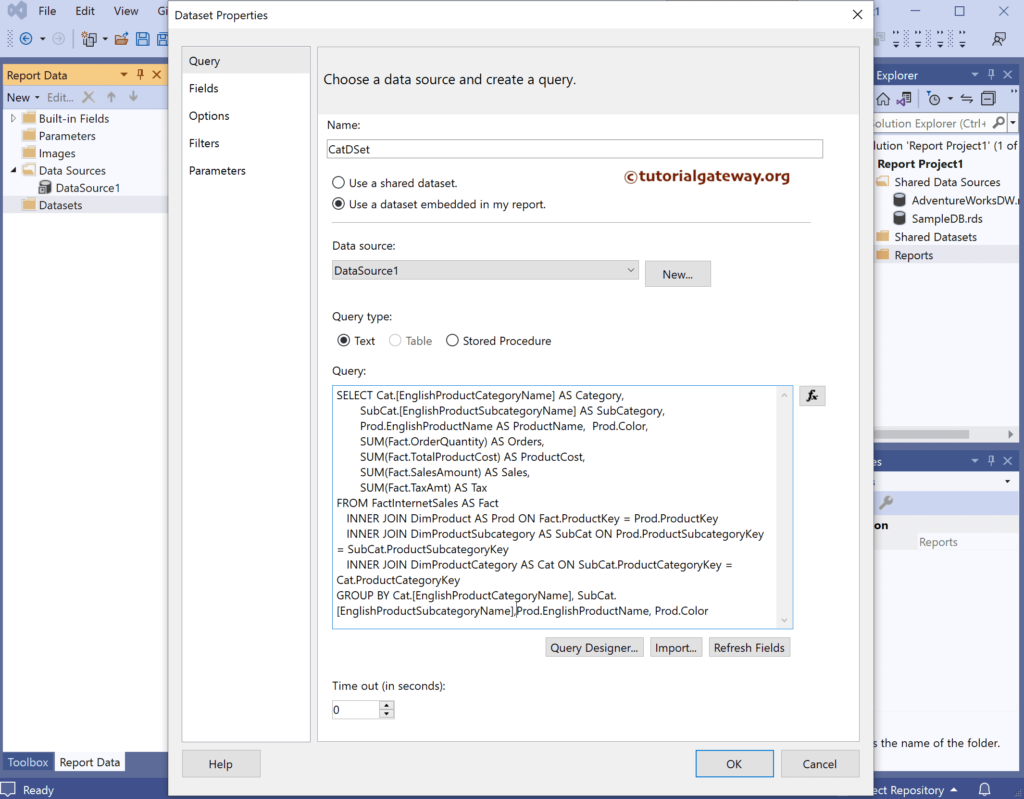
The Sql query that we used above SSRS example is:
SELECT Cat.[EnglishProductCategoryName] AS Category,
       SubCat.[EnglishProductSubcategoryName] AS SubCategory,
       Prod.EnglishProductName AS ProductName,
       Prod.Color,
       SUM(Fact.OrderQuantity) AS Orders,
       SUM(Fact.TotalProductCost) AS ProductCost,
       SUM(Fact.SalesAmount) AS Sales,
       SUM(Fact.TaxAmt) AS Tax
FROM FactInternetSales AS Fact
   INNER JOIN DimProduct AS Prod ON Fact.ProductKey = Prod.ProductKey
   INNER JOIN DimProductSubcategory AS SubCat ON Prod.ProductSubcategoryKey = SubCat.ProductSubcategoryKey
   INNER JOIN DimProductCategory AS Cat ON SubCat.ProductCategoryKey = Cat.ProductCategoryKey
GROUP BY Cat.[EnglishProductCategoryName], SubCat.[EnglishProductSubcategoryName],
		Prod.EnglishProductName, Prod.Color
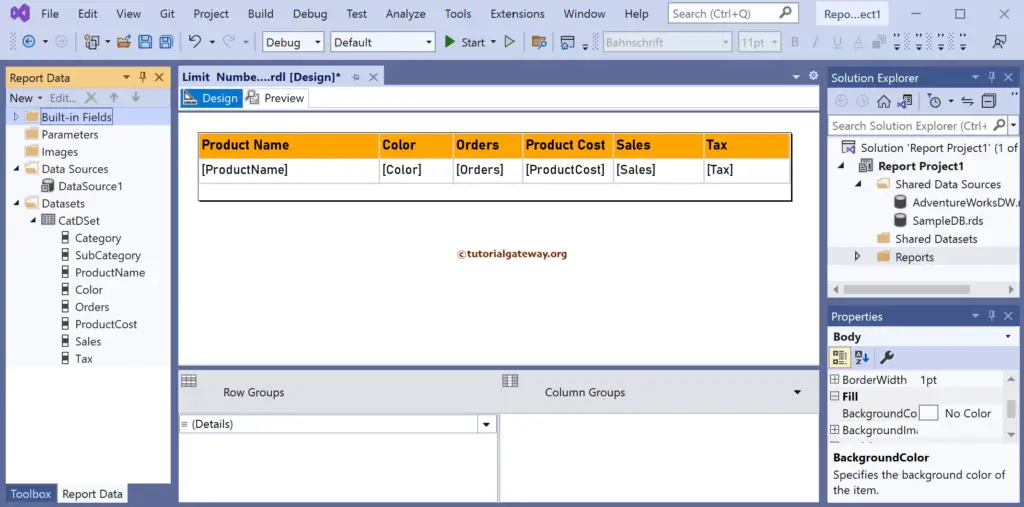
We have designed a simple table report of product sales and formatted the font and colors.
How to Limit the Number of Rows Per Page in the SSRS Report?
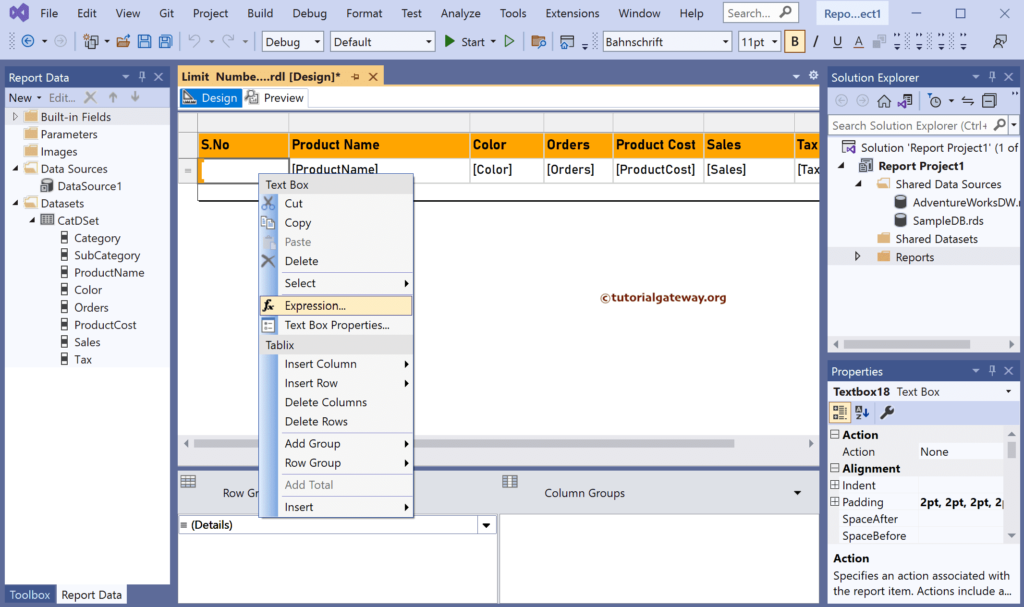
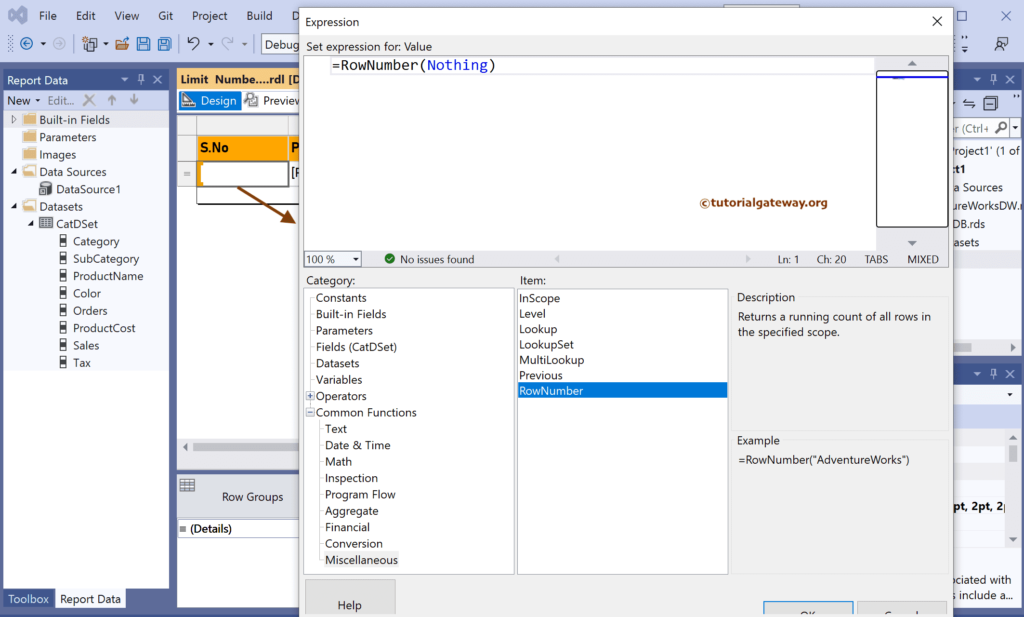
Next, we added a new column to the left side of the Product Name and named as S.No. To do this, right-click the Product Name column, choose the insert column, and then the Left option to create a new column on the left side. Next, right-click on the empty cell and select the Expression option.
Within the Expression window, we used the RowNumber() function to display the row numbers.
RowNumber(Nothing)
- Guide to Limit Rows Per Page using Report Parameter article.
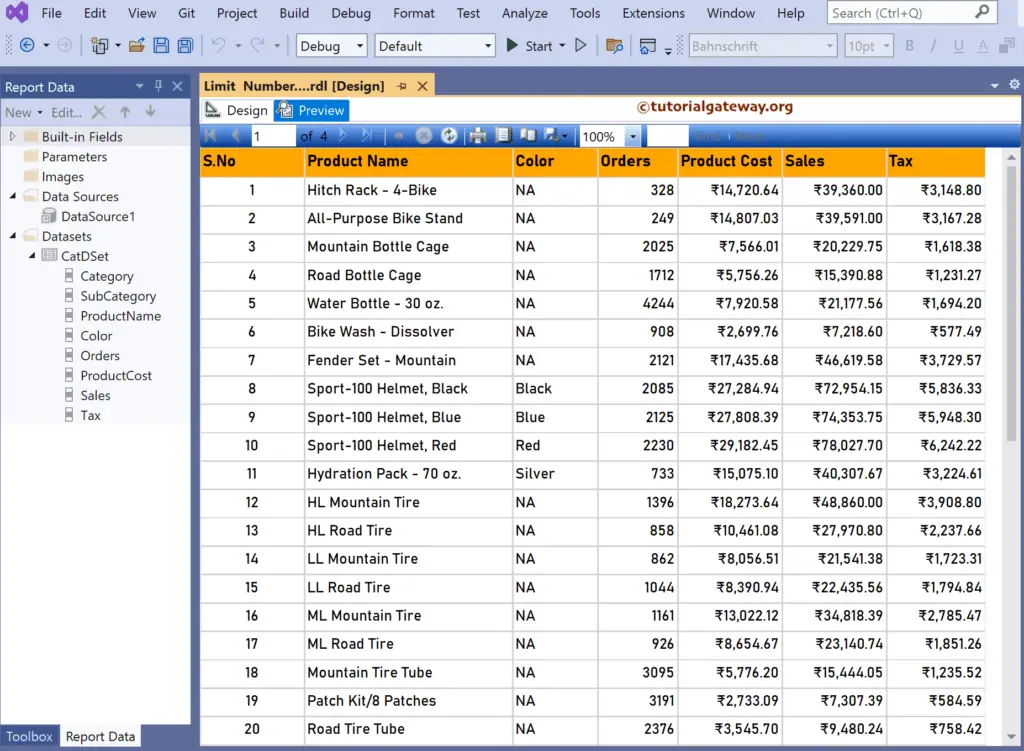
The table report preview with row numbers.
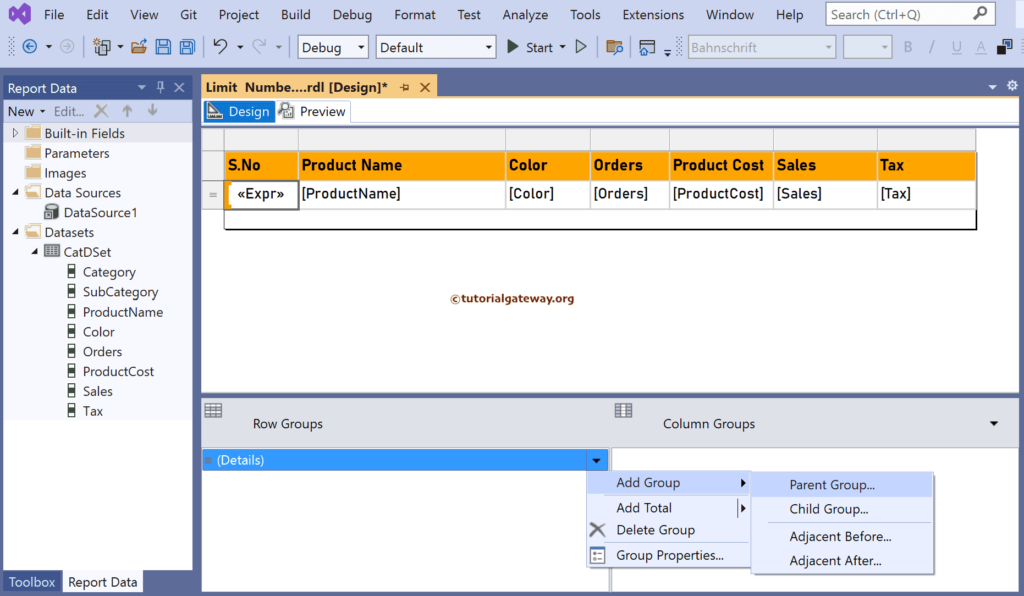
Next, under the Row group section, click the down arrow beside the details and select add group and parent group.
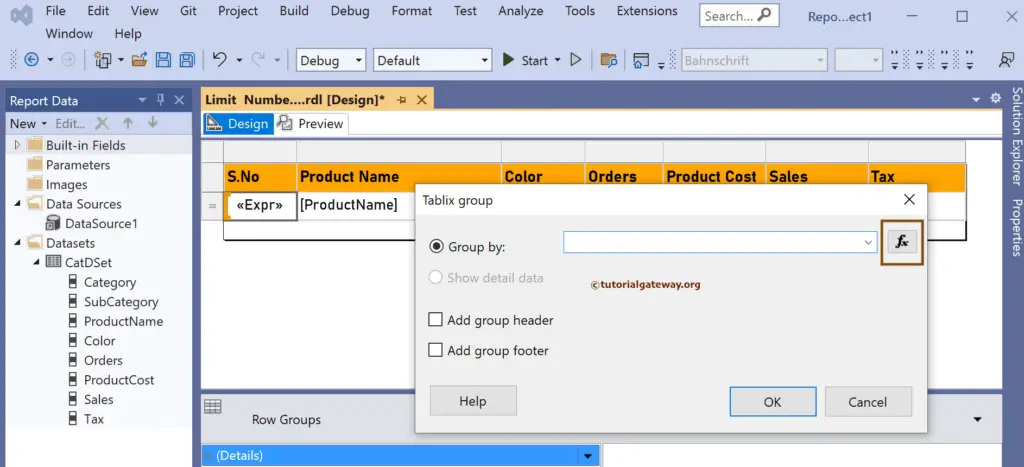
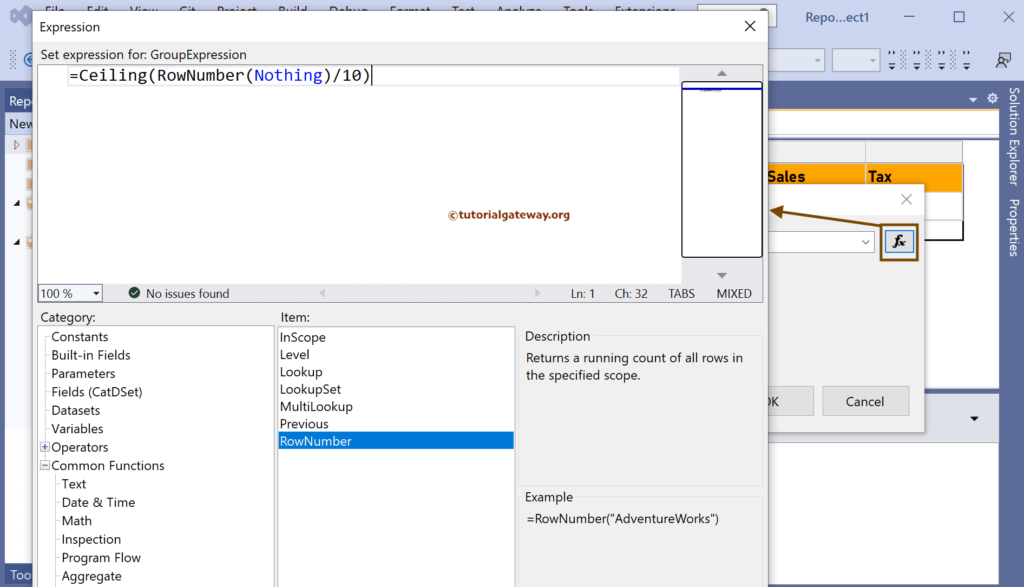
Let me click the ƒx button to write an expression for grouping.
In the expression window, we divide the RowNumber by ten because we want to display or limit ten rows per Page. Here, we also used Ceiling to get the smallest integer value greater than or equal to the result.
The expression to limit the number of rows per page in the SSRS report is:
Ceiling(RowNumber(Nothing)/10)
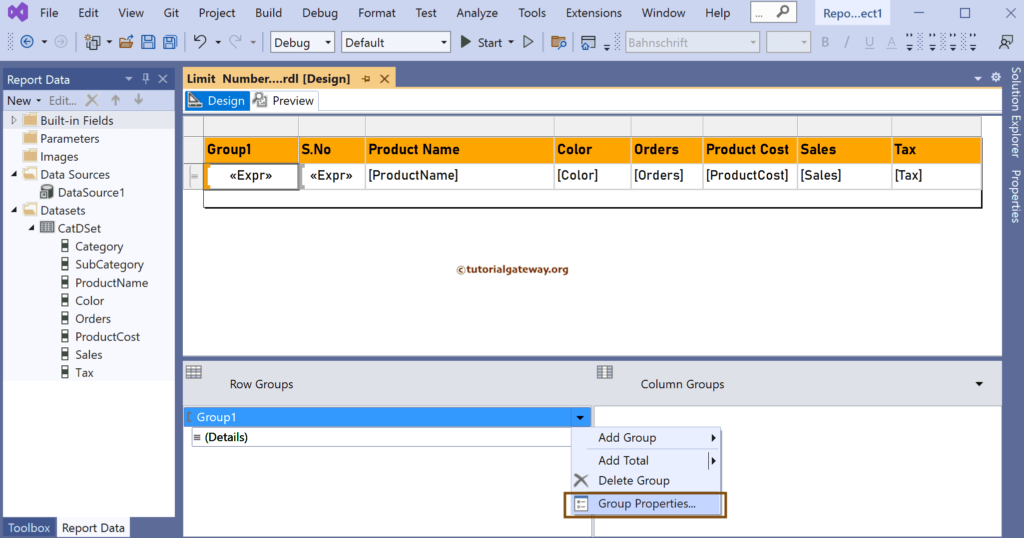
The grouping will default sort the table records based on the given column. Here, it is an expression, and it will throw an error. So, right-click Group1 and choose the Group Properties window.
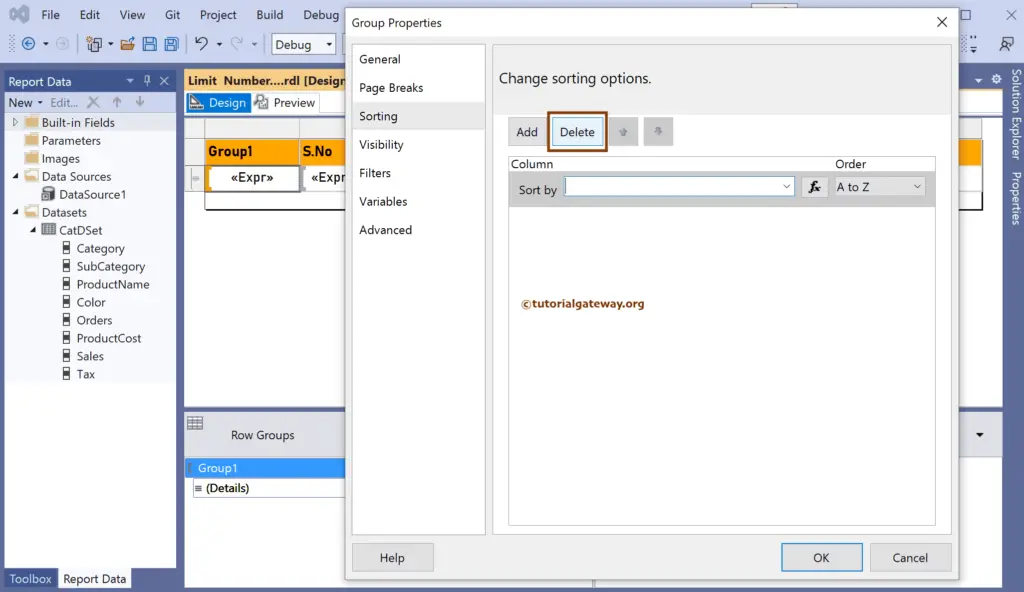
Go to the Sorting tab, and click the Delete button to delete the Sort by.
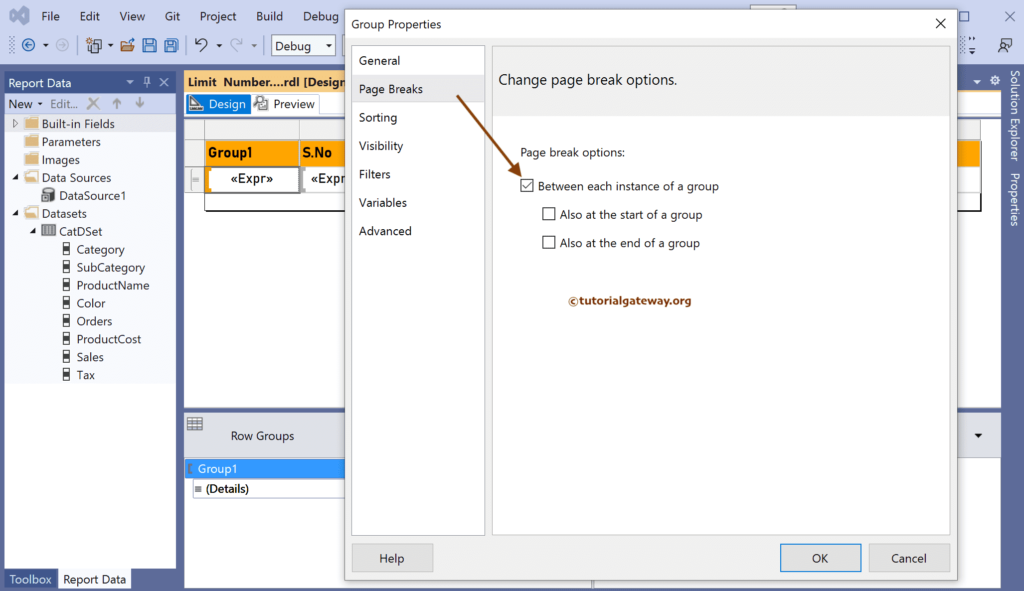
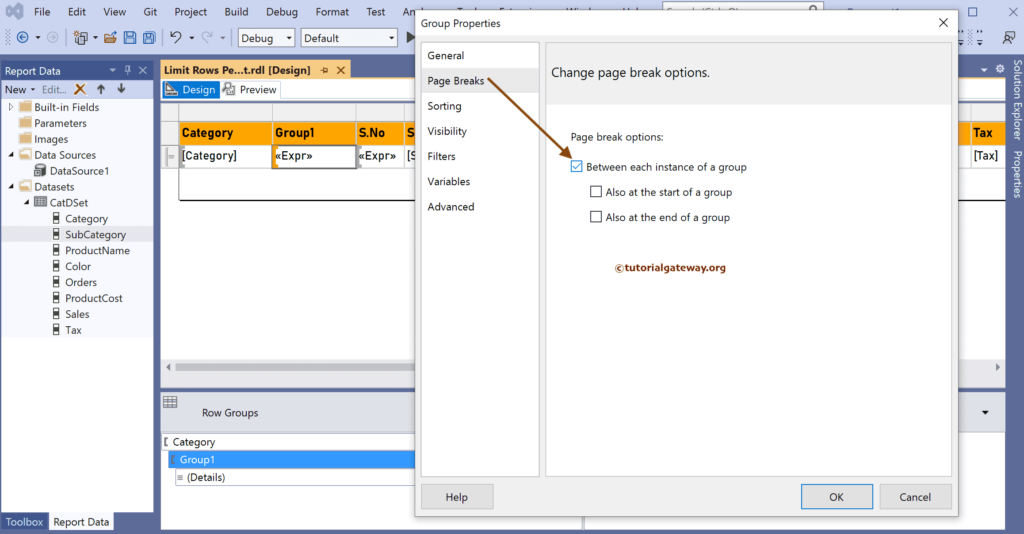
Select the Page breaks option between each instance of a group option under the Page Breaks tab.
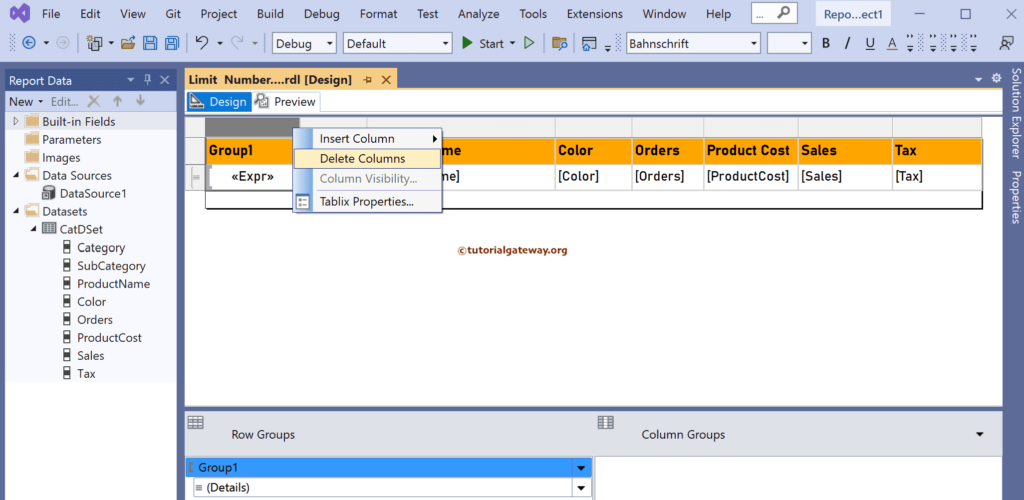
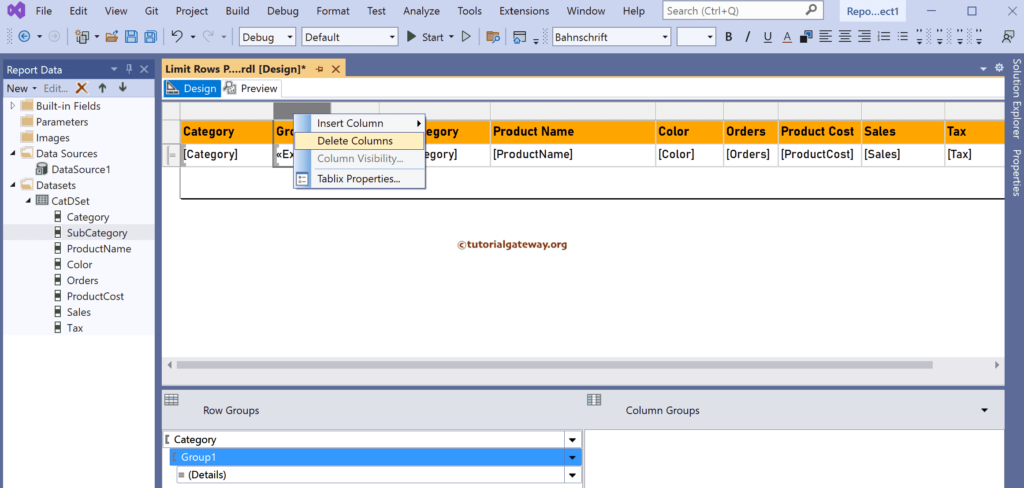
I don’t want this extra group column to display in the final report. So, let me right-click on it and select the Delete Columns option. Then, if you wish, leave it.
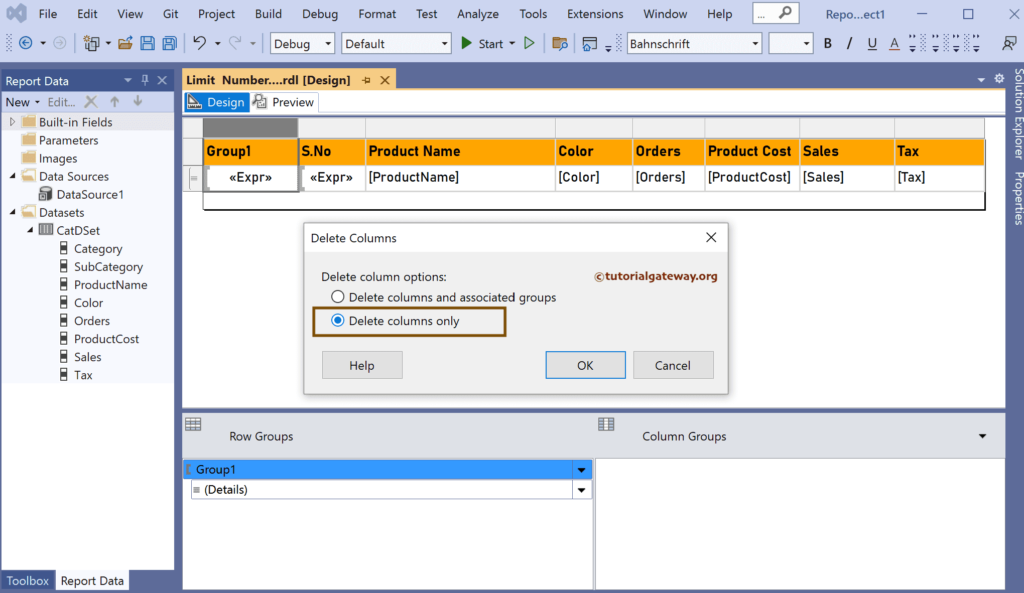
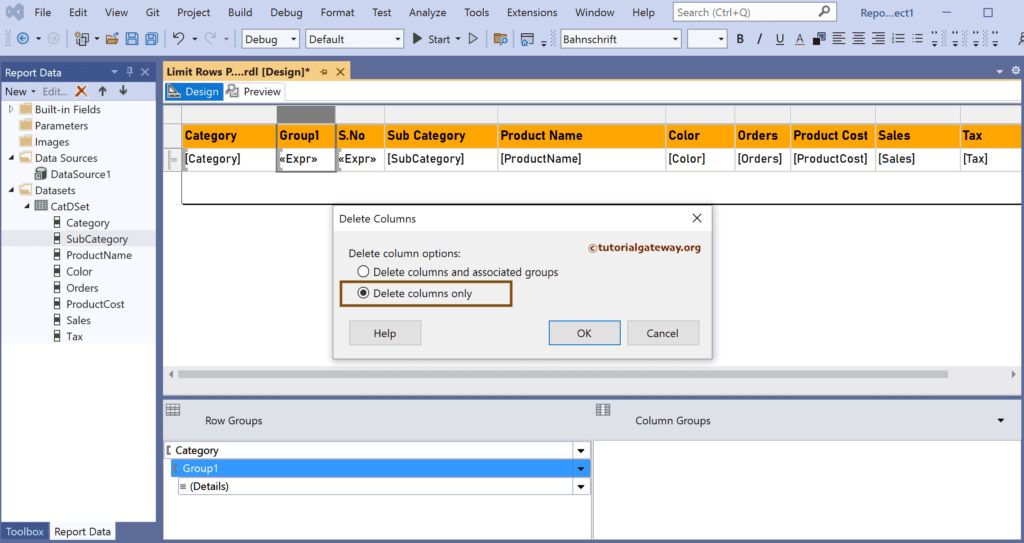
It will open a pop-up window; choose Delete Columns only option. If you choose the first option, it will also delete the group we created earlier.
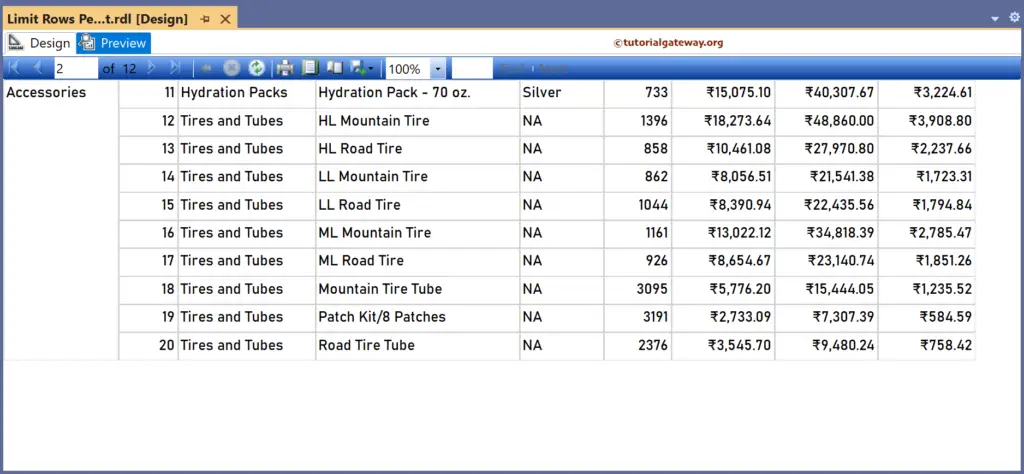
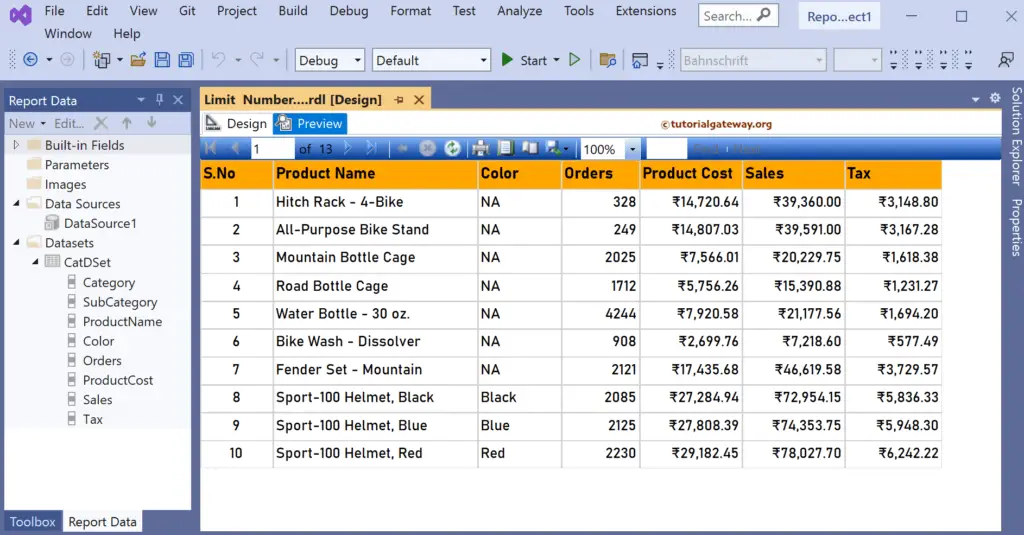
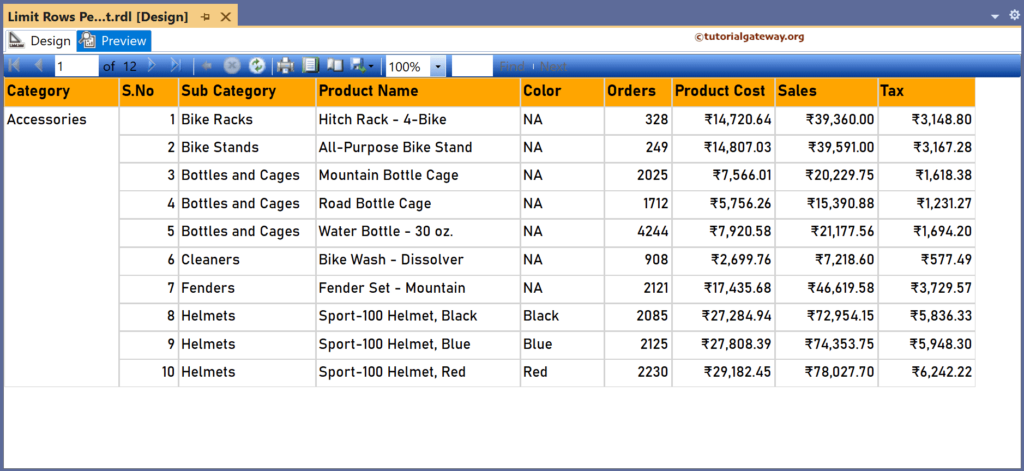
Now, if you look at the limit of the number of rows per page in the SSRS report preview, it shows 10 rows per Page.
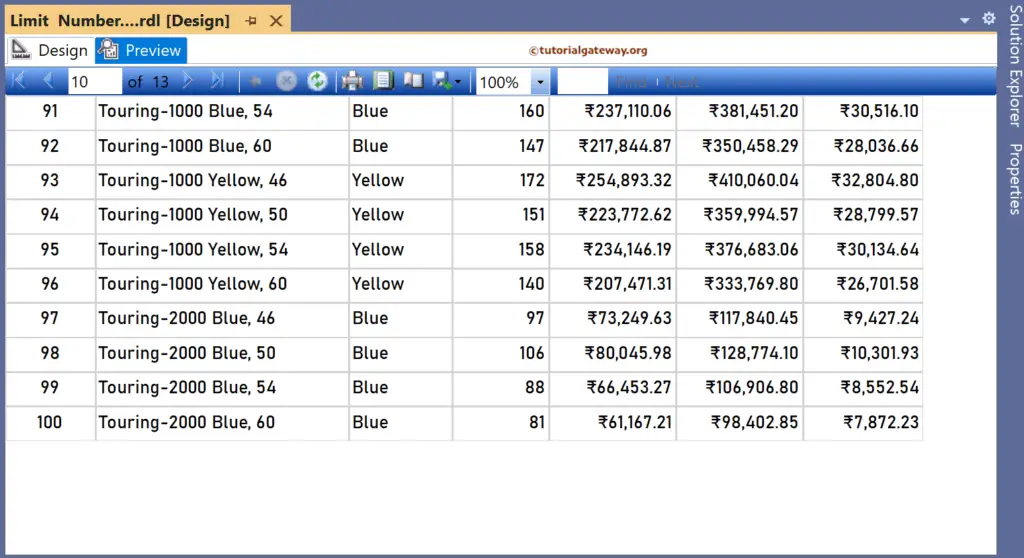
Let me navigate to another page.
Limit Rows on each Page of the SSRS Grouped Table Report
This SSRS article shows how to limit the total number of rows displayed on each Page of a grouped table report with an example. To do this, right-click on the Datasets folder to create a new DataSet.
We have designed a simple table report of product sub-category sales and formatted the font and colors.
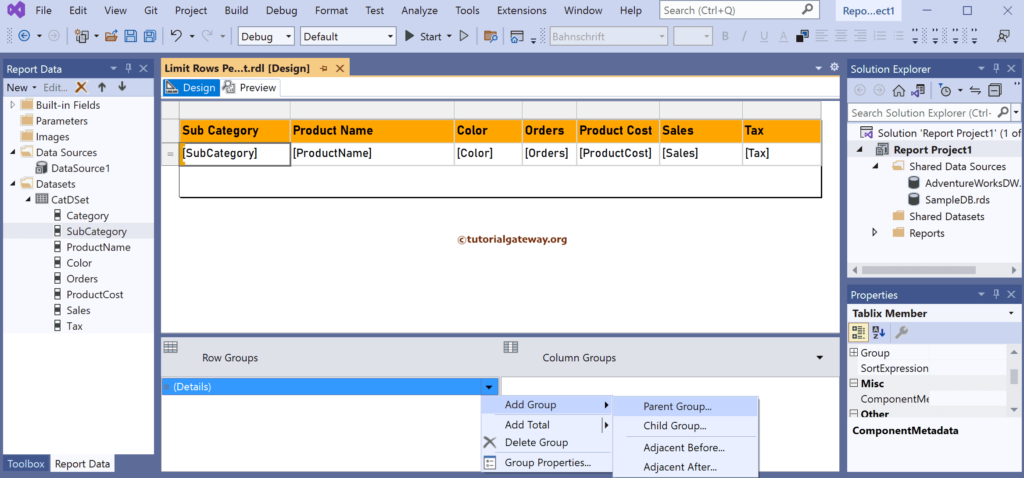
Under the Row group section, click the down arrow beside the details and select add group and parent group.
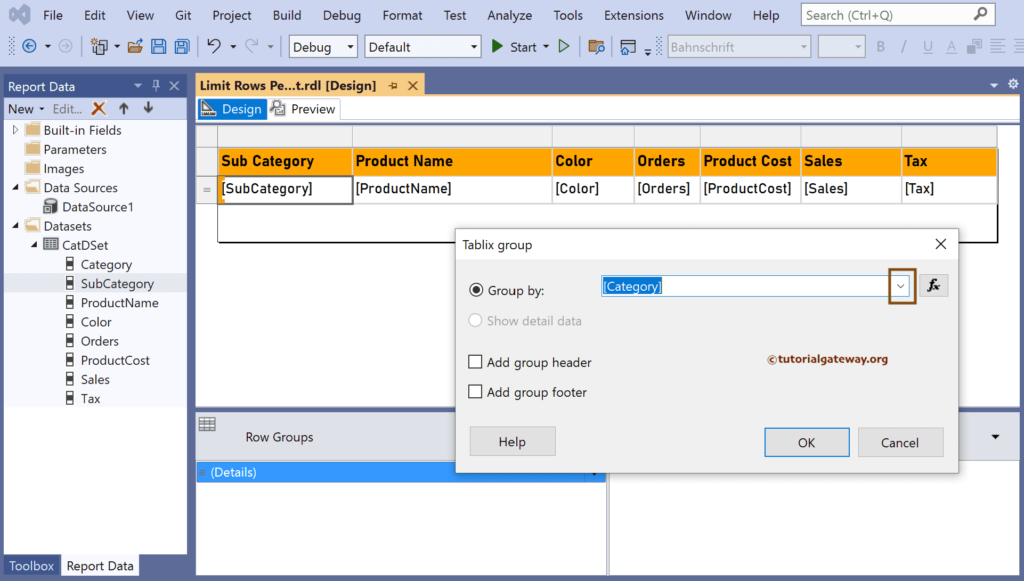
Choose the Category column as the group by option and click the OK button.
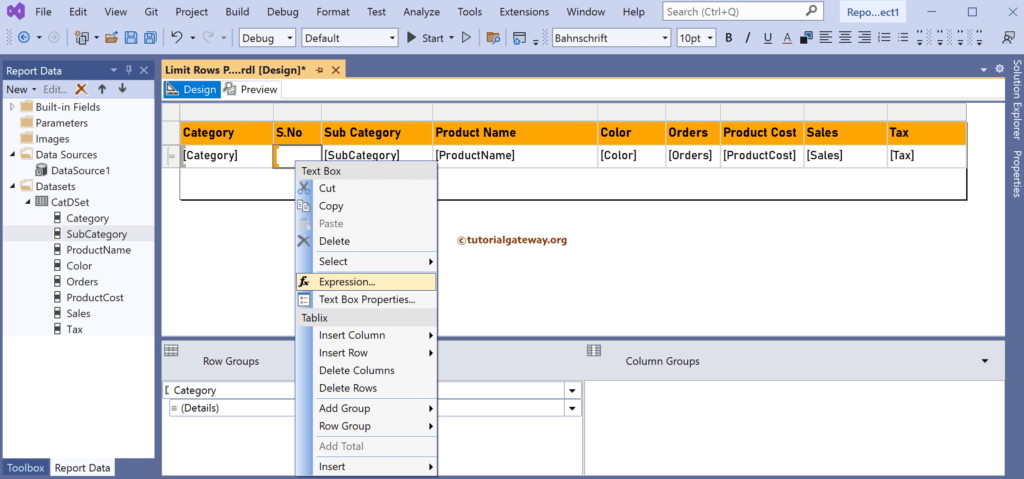
Next, we added a new column named S.No in the middle of the Category and Sub-Category. To do this, right-click the Sub Category column, choose the Insert column, and then the Left option. Next, right-click on the empty cell and select the Expression option.
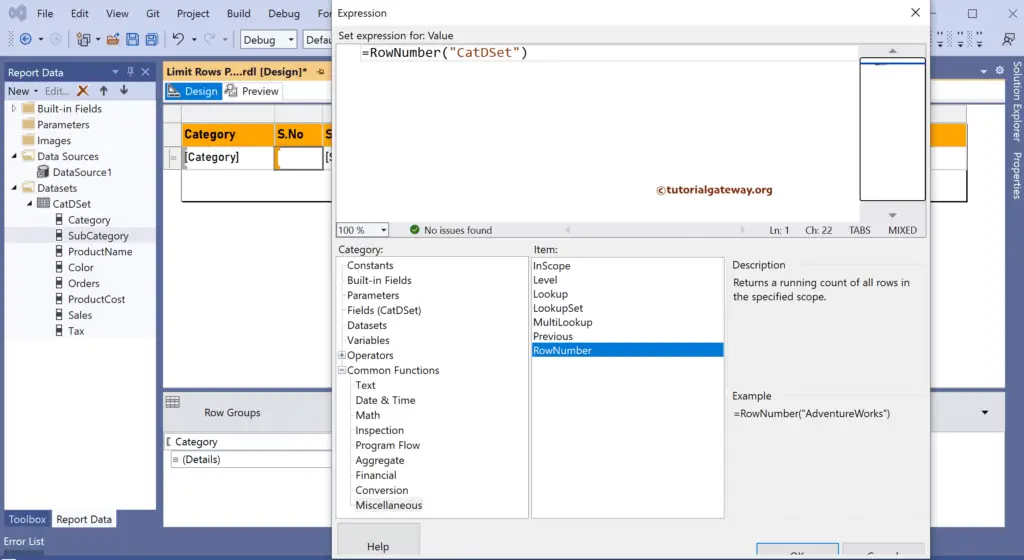
Within the Expression window, we used the RowNumber() function with the DataSet name as the argument value to display the row numbers. It is optional.
RowNumber("CatDSet")
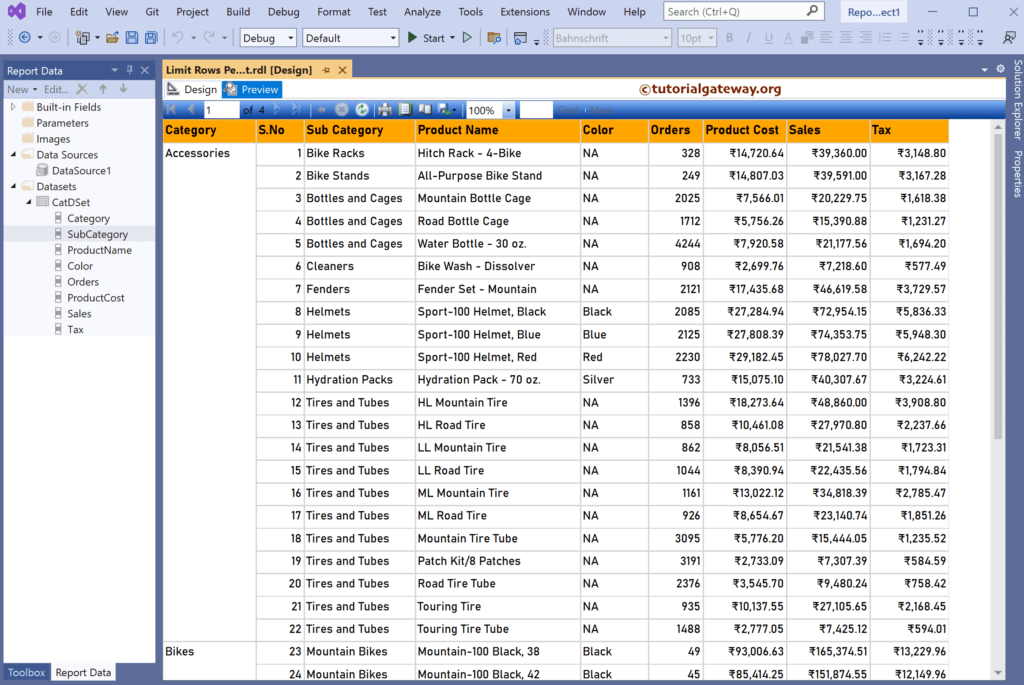
Let me show you the report preview. It has four pages, products are grouped by category, and S.No column returns the serial or row numbers.
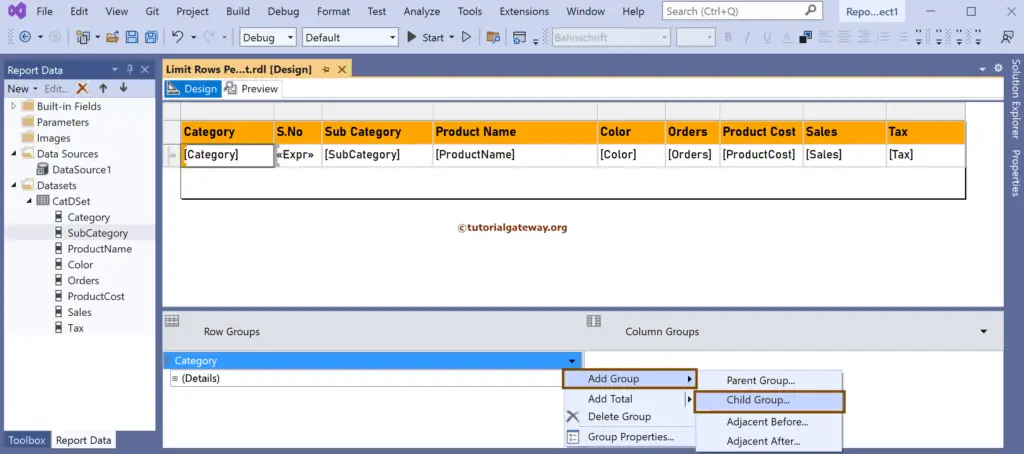
Next, under the Row group section, click the down arrow beside the Category and select add group and Child Group.
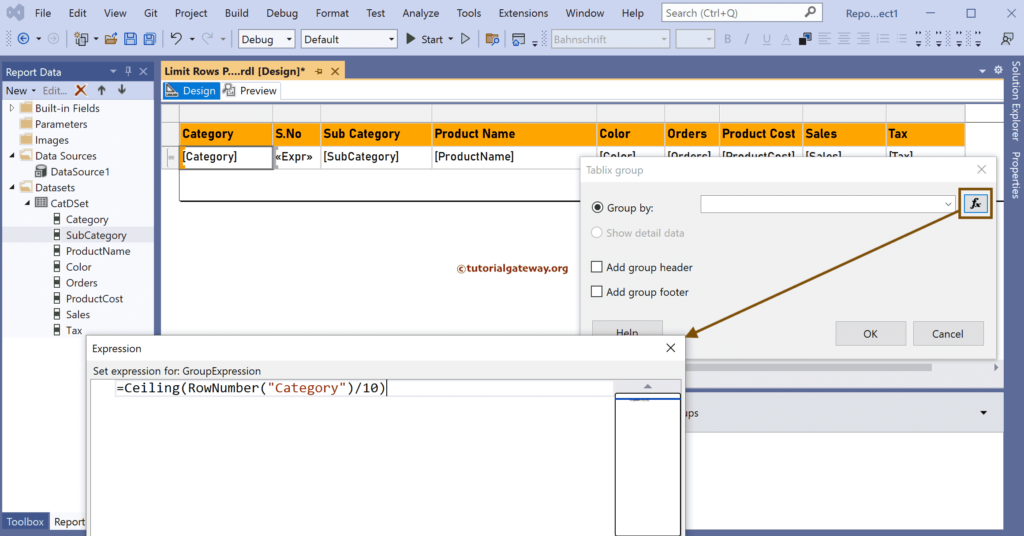
Click the ƒx button to write the grouping expression. In this example, we want to limit 10 rows on each Page, so we divide the RowNumber by 10. Here, the Ceiling function is to get the smallest integer value greater than or equal to the result. Remember, don’t forget to place the Group name, i.e., Category, as the RowNumber argument.
The expression to Limit Rows on each Page of the SSRS Grouped Table Report
=Ceiling(RowNumber("Category")/10)
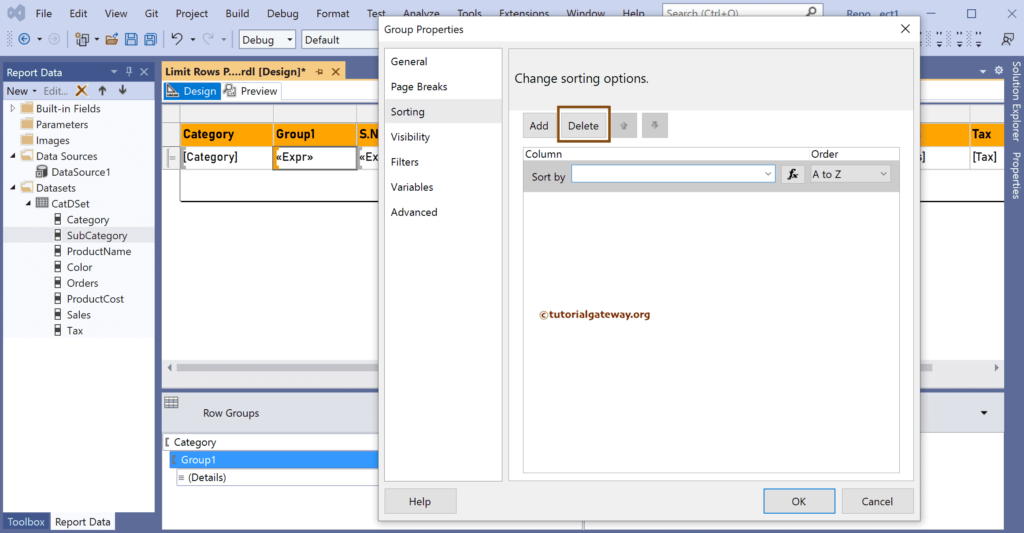
By default, the grouping will apply to sort the entire table. Here, we are not grouping by any column; instead, it is an expression that will throw an error. So, right-click Group1 and choose Group Properties. Next, go to the Sorting tab, and click the Delete button to delete the Sort by.
Select the Page Breaks option between each instance of a group option under the Page Breaks tab.
Right-click on the extra group column and select the Delete Columns option to remove it from the final report. If you want, leave it.
Choose the Delete Columns only option from the pop-up window. Please don’t choose the first option; it will delete the earlier created group.
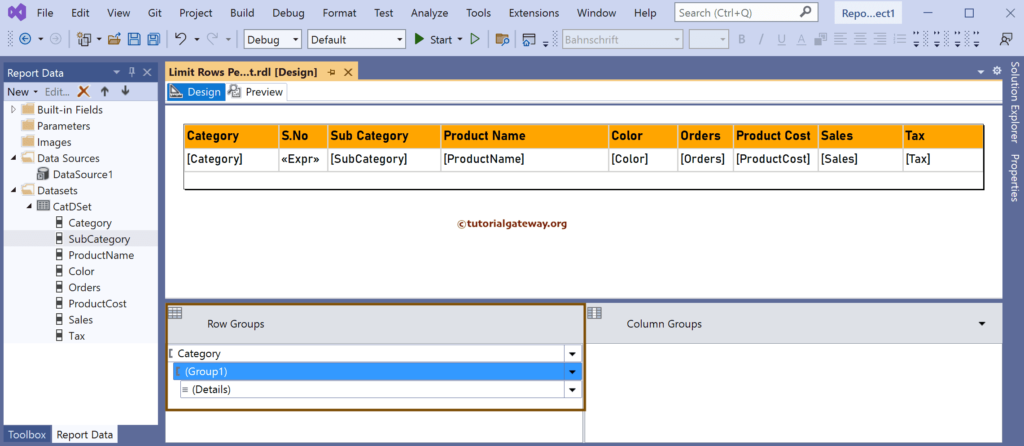
The final report is.
Now, if you look at the Limit Rows on each Page of the SSRS Grouped Table Report preview, it shows 10 rows from the group.
Let me check another page.
