This SSRS article shows how to use the reports as parameter values or call reports from parameters using the sub-reports with an example.
Right-click on the Datasets folder to create a new DataSet. In general, we don’t need any columns. First, we must create a data set to work with the report. The below code shows the data set that we use for this SSRS Reports as a Parameter Value example.
The Sql query that we used in this SSRS example is:
SELECT 1 AS EmpID
SSRS Reports as Parameter Value
To add a Table, right-click the report area, choose Insert, and then the Table option from the context menu. Otherwise, drag and drop the Table from the toolbox to the report area. Next, select and right-click the details row and choose the Delete Rows option to remove it. Please refer to the Table Report article.

Right-click on the empty row, choose Insert Row, and then the Below option to add a few rows to below. As shown below, we have inserted three rows.
Now, we have to embed the reports into this table. For this, we have to use the sub-reports. So, right-click on the empty cell, choose Insert, and then select the Subreport option.

Similarly, add a Subreport for the remaining rows. Next, right-click on the Parameters folder and choose the Add Parameter option.

It will open the following window. Add Report as the name and Choose Report Name as the prompt text.

Under the Available Values tab, select the Specify values option and click the Add button. Next, enter the available parameter values.
Here, you can enter the label names as per your requirements. However, the Values have to match the existing report name. For example, if you look at the below image, each available parameter value is exactly equal to the rdl name.

Let me choose or enter the Running Tot report as the default value. It means when you open the report preview, it displays the running total report by default.

We used four reports as the default values. So, we have added one more table row and inserted <Subreport> into it.
Subreport Settings
For this SSRS Reports as Parameter Value demo, right-click on the <Subreport> and choose the Subreport properties option from the context menu.

Next, under the General Tab, click the down arrow and select the Report that it has to display.

Do the same for the remaining three rows. Next, please select the first row and right-click on it to select the Row Visibility option.

Change the Visibility from Show to Show or hide based on the expression option. Next, click the ƒx button and write the below expression.
This iif condition checks whether the parameter selected value is Running Tot. If True, display this row. Otherwise, hide it.
=iif(Parameters!Report.Value = "Run Tot", false, true)

Similarly, select each <Subreport> row and write the IIf statement.
=iif(Parameters!Report.Value = "Run Tot Group", false, true)
=iif(Parameters!Report.Value = "Running Avg", false, true)
=iif(Parameters!Report.Value = "Alternative Group Color", false, true)
Now, if you go to the SSRS report preview, it default displays the running total report based on the parameter value.

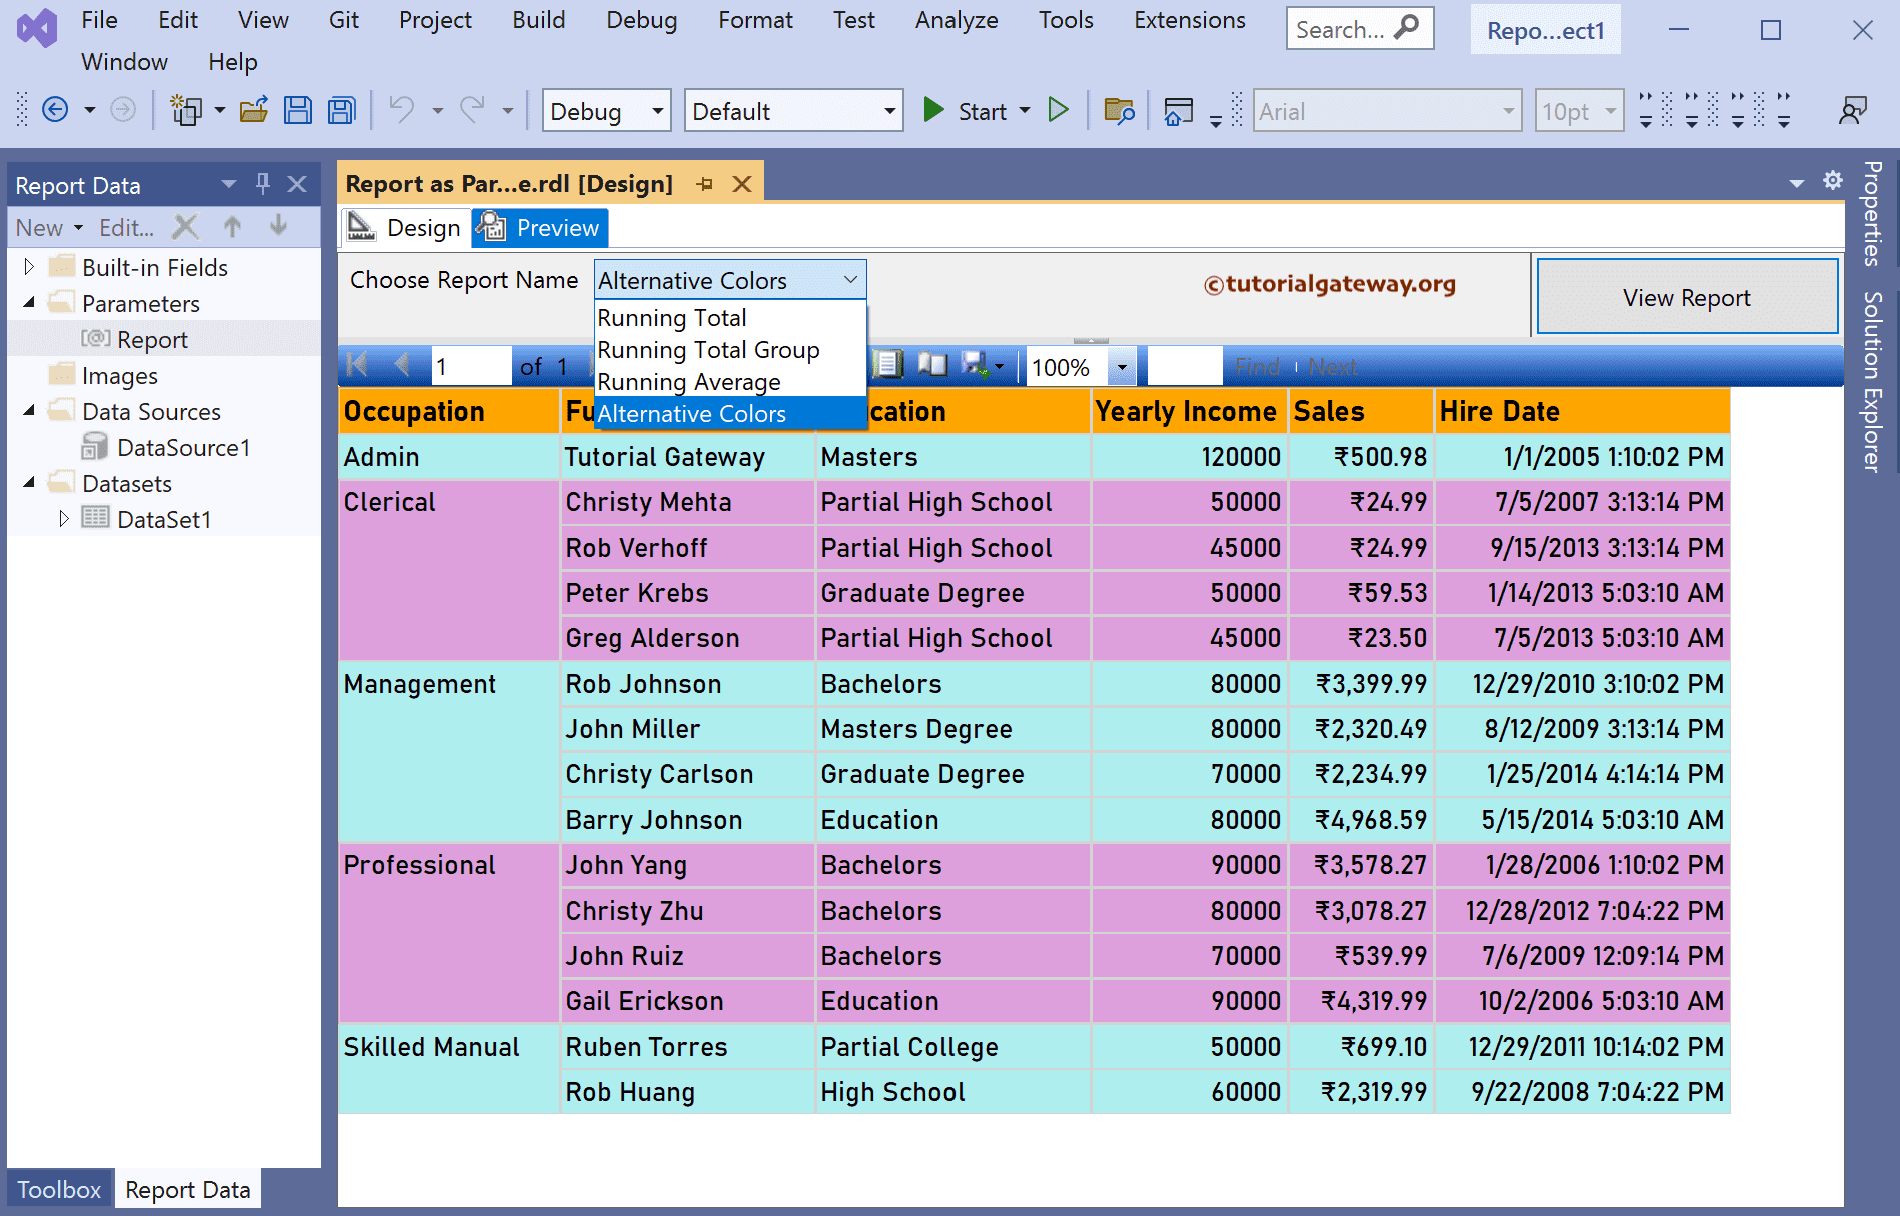
If we select the Alternative Colors parameter value, it displays another report.