In this article, we will show you how to create an SSRS Report using Stored Procedure with an example. It’s one of the frequently asked questions by SSRS followers. To demonstrate the same, we will create a Stored procedure on the Adventure Works DW database.
The below screenshot shows the stored procedure code that we are going to use to create the SSRS report:
To create a custom Stored Procedure, visit the Stored Procedure article in SQL Server. To design a report using the Parameters, use the following links.
- Create a Report using a Stored Procedure with a Parameter.
- Create a Report using Stored Procedure with Multi-Value Parameter.
Now, Let me write a query to create a Stored Procedure on Adventure Works DW:
USE [AdventureWorksDW2014]
GO

IF OBJECT_ID ( 'SP_ProductSales', 'P' ) IS NOT NULL
    DROP PROCEDURE SP_ProductSales;
GO

CREATE PROCEDURE [dbo].[SP_ProductSales]
AS
BEGIN
      SET NOCOUNT ON;
	  SELECT Prod.Color,
             Prod.EnglishProductName AS ProductName,
             Fact.SalesAmount,
	         Fact.OrderQuantity,
             Fact.TotalProductCost,
             Fact.TaxAmt
       FROM DimProduct AS Prod
         INNER JOIN FactInternetSales AS Fact
            ON Prod.ProductKey = Fact.ProductKey
END
GO
Create SSRS Report using Stored Procedure
In this example, we will create a 3D Clustered Column Chart to display the step by step approach to creating a Report using Stored Procedure. The below screenshot will show you the Data Source and Dataset we will use for this SSRS Clustered Column Chart Report.
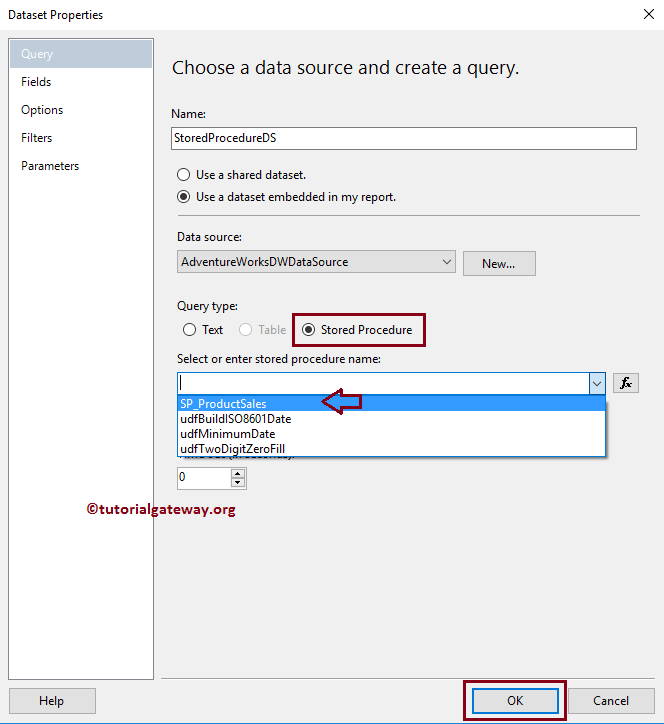
Here, we must change the Query type from Text (the default) to the Stored procedure. Next, Please select the required stored procedure name from the available list. From the screenshot below, you can see that we are choosing the one we created earlier.
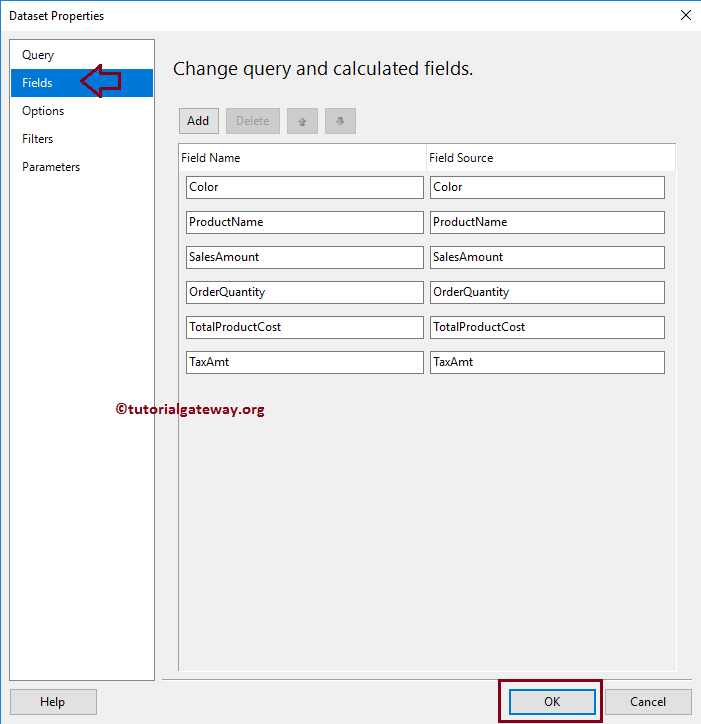
Lastly, please navigate to the Fields tab and check whether we got all the fields from our stored procedure. Here you can add Calculated Fields also.
In the create SSRS report using the stored procedure design window, we can add a Clustered Column chart by dragging the Chart property from the Toolbox to the Design space. Or right-click on the report designer to open the context menu. From the context menu, please select the Insert -> Chart option.
Once you select the Chart option, a new window called Select Chart Type will be opened to select the required chart from the available ones. For this example, we are selecting a 3D Clustered Column Chart. Once you click the OK button, the 3D Clustered Column chart will display in the design region with dummy data. Clicking on the space around the Clustered Column Chart will open the Chart Data window.
In this example, we will create a Clustered Column chart for the Total Product Cost and Sales Amount. So, Drag and drop them from the dataset to chart data values and Product Color in the category group.
I suggest you refer to the Create Column Chart article to understand the creation of a Clustered Column chart.
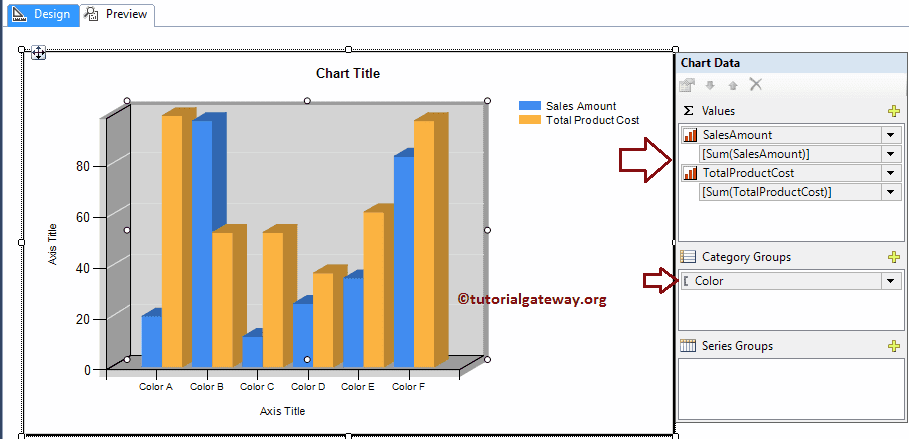
Click on the Preview button to see the report preview. Here, we created a 3D Clustered Column report using the SP_ProductSales stored procedure in SSRS. Let me Format the chart a bit for a classy look.
Remember, we already explained the Formatting options in the Formatting Column Chart article. So, Please refer to the article to understand the steps.
