The SSRS Drill Through Action is the most commonly used Action in real-time reporting. The Drill through reports allows the user to navigate from one report to another by clicking an object in the main. Drill Through Action can be defined on Matrix, Table, Charts, Data bars, Pie Charts, gauges, and so on.
Drill Through Reports in SSRS Example
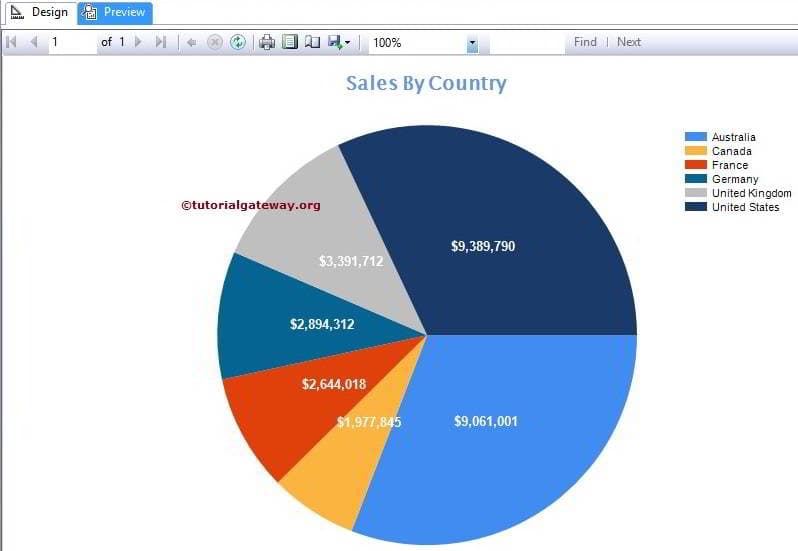
In this example, we will show you how to enable SSRS Drill Through Action on a Pie Chart with an example. For this Action demo, we are going to use the below-shown report. Please refer to the Pie Chart to understand the Data Source and Dataset we used in this SSRS report.
We aim to define Drill Through Action in each country region. If the user clicks on any country region, the second report has to display the corresponding state-wise sales. For instance, If the user clicks on the United Kingdom, then the second report has to show all the states present in that country.
NOTE: If you want to achieve this Drill through in the SSRS report, we have to pass the country value from the main to the second report. It means the second one should be a parametrized report.
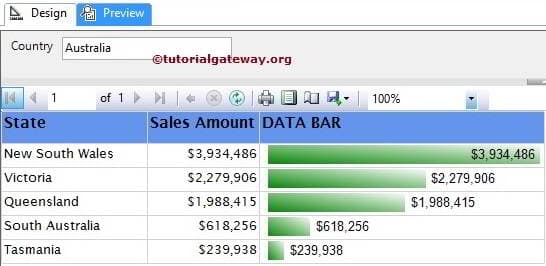
The below screenshot shows you the second report, and this is the one we are going to display on Users Drill through action. Please refer Data Bars article to understand the Data Source and Dataset we used in this chart, and we have done some formatting as well. If you observe, It’s just an ordinary one with Basic Parameters and its default value in Australia.
SSRS Drill Through Reports Action
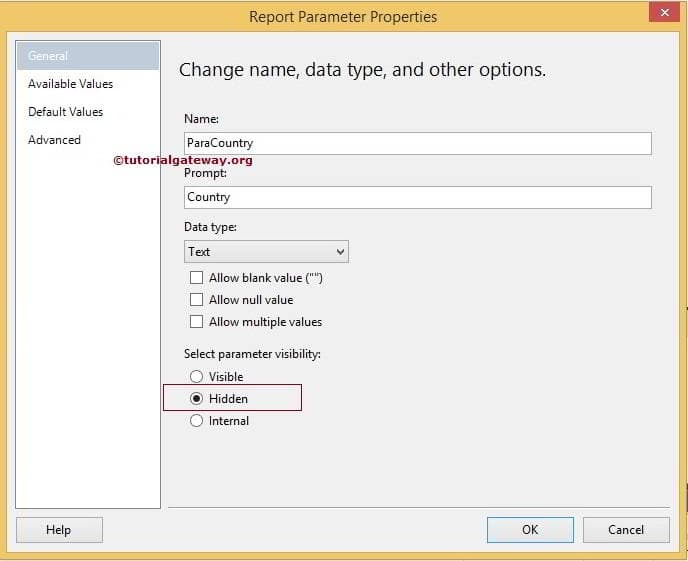
To enable the drill through Action on report parameters, first, We are going to hide the Parameter. Because we are going to pass the parameter value from the main, it will be annoying to display the Parameter in Drill Through reports.
To hide the Parameter, Right-click on the Parameter and select the Report Properties option. In the general tab, Please change the parameter visibility option from Visible to Hidden.
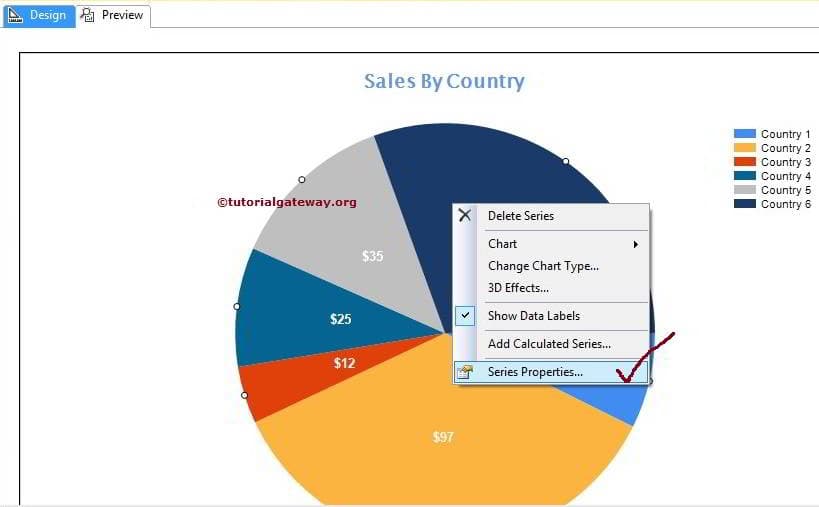
Here we are going to apply Go to Report Action (Drill Through Report Action) on the Countries column. So, Right-click on the Pie Chart and select the Series Properties.. option from the context menu
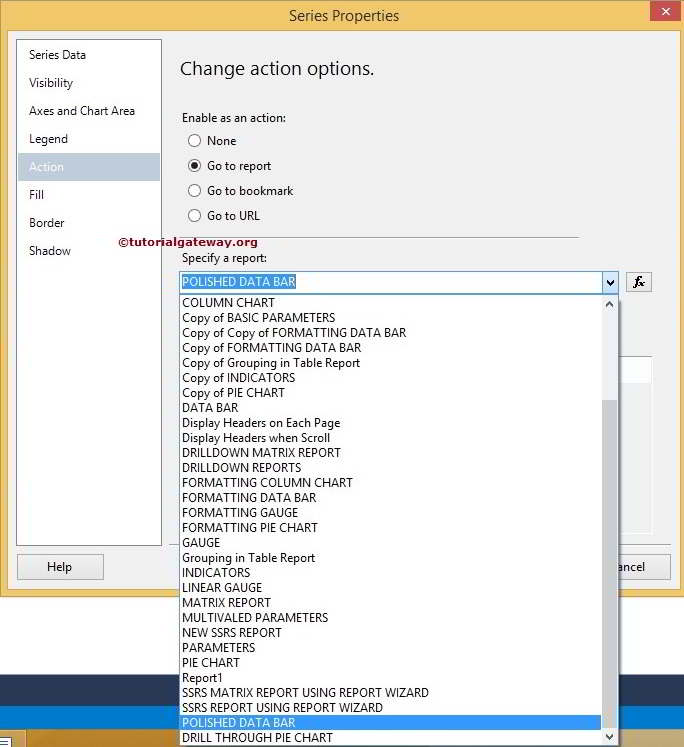
Once you choose the Series Properties.. option, a new window will open to configure the properties. Please Navigate to the Action tab, and choose the Go to report option to configure the SSRS Drill Through report action. Under the Specify a Report option, Please select the required chart from the drop-down list as shown below.
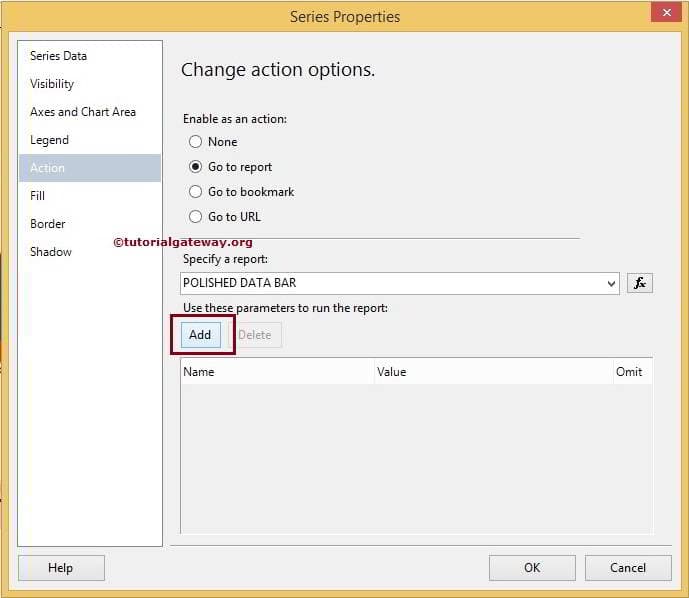
After selecting the required one, We have to assign the value(s) to parameters in a selected report. First, click on the Add button to configure parameter values.
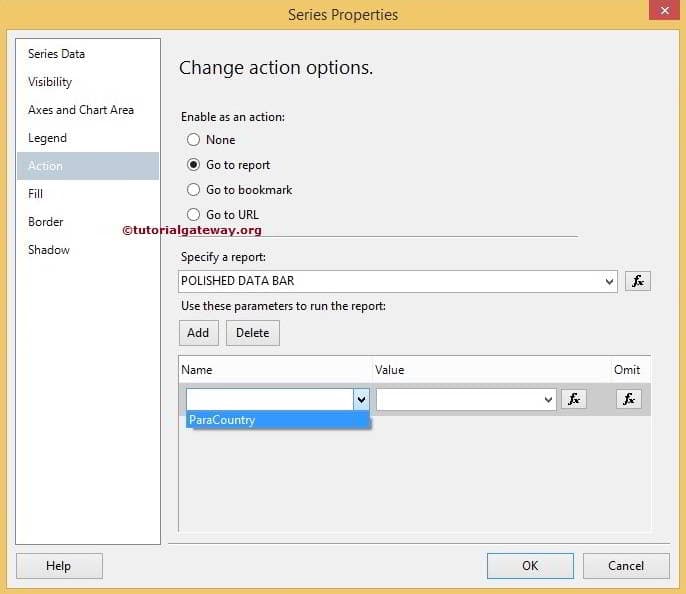
Under the name section, Please select the Parameter name of the selected report.
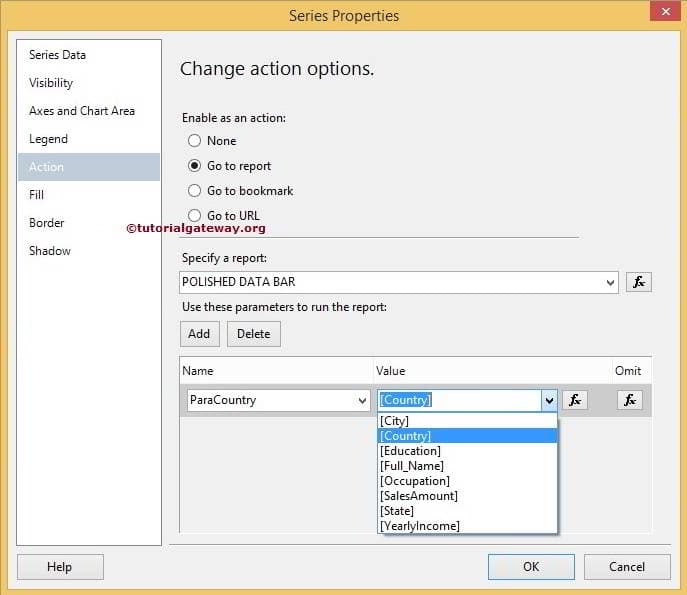
Next, We have to assign the proper values to the selected Parameter. Here, the ParaCountry Parameter is expecting country names. So we chose the Country column from the main report.
NOTE: If you don’t find the exact column in the main report, Use the fx button to create one.
Click Ok to finish enabling the Drill Through action on the Pie Chart. Let us see the report preview by clicking the preview tab. If you observe the below screenshot, it looks the same as a normal pie chart.
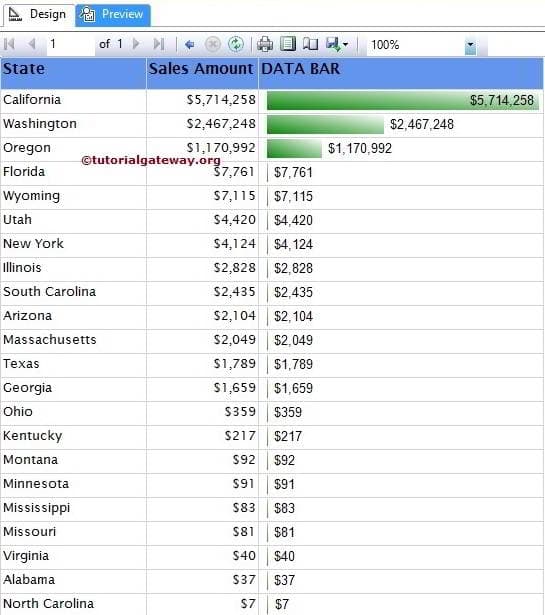
However, if you click on any region, the second one will be displayed with the state details present in that country. In the SSRS Drill Through report preview, We clicked on the United States.
If you observe the below screenshot, our second report displays the state-wise sales of the United States in our second report.
TIP: Please click on the Back button (Blue Arrow pointing to the left). It helps to navigate from the second report to the Main.
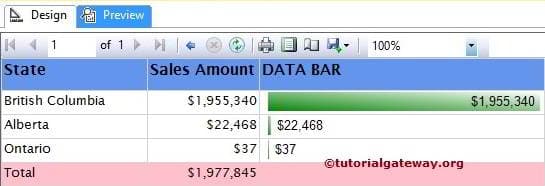
Let us add the total to the second one. This way, you can compare the totals displayed in the Pie Chart and the second report.
This time, We clicked on Canada. As you can observe from the above screenshot, the totals are perfectly matching.
Comments are closed.