In this article, we will show you the steps involved in the Formatting Data Bars in SSRS. It includes how to change the Data Bar Colors, Data Bar type, add Custom colours, and converting the Data bar to full chart in SSRS with an example.
Formatting Data Bars in SSRS
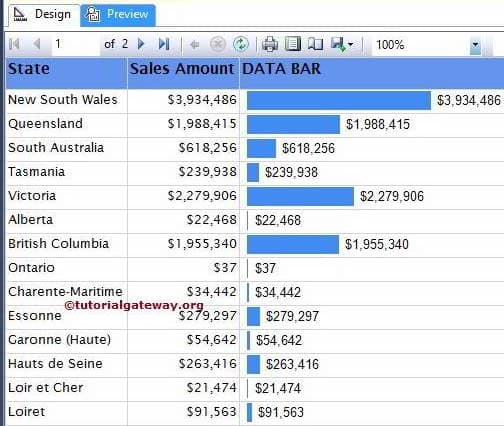
To explain the available Format options, We are going to use the below-shown Report. Please refer to the Data Bars article to understand the Data Source and Dataset we used for this SSRS Report.
Formatting Data Bar Color in SSRS
We usually change the data bar color using some conditions. For instance, if the sales amount is less than the threshold point, then Red color or something like that.
To Format the SSRS data bar color, Right-click on the Blue bars and select the Series properties… option from the context menu.
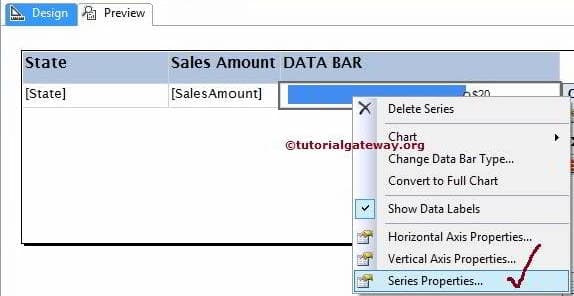
Once you click on the Series properties… option, a new window will open with many properties. Here, we can change the visibility, Border colors, Shadow effects, and Actions as well.
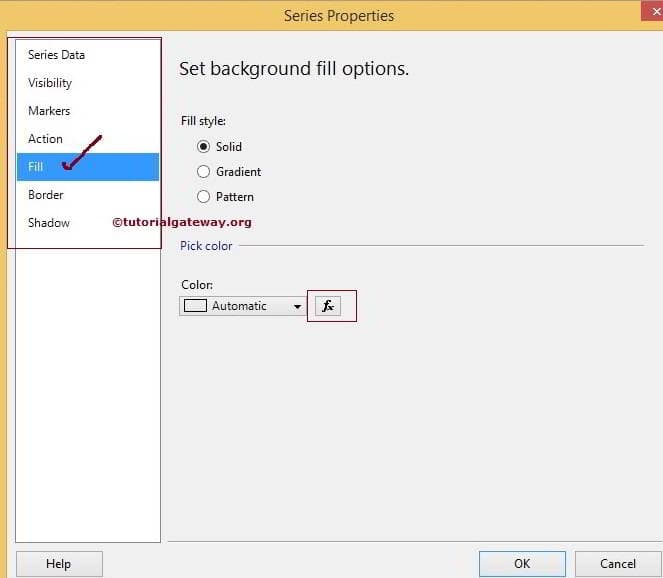
In this example, we will change the color of the data bars using the condition so, Goto Fill tab and click on the fx button
TIP: If you want to change the color without any condition, then select the color from the drop-down list.
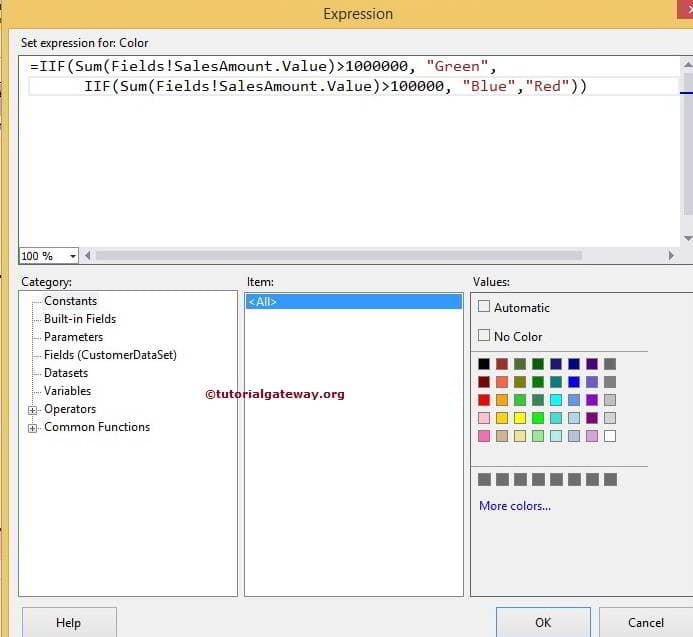
Once you click on the fx button, a new Expression window will be opened to write the custom expression for the color. We are going to use the below expression.
Expression:
=IIF(
      Sum(Fields!SalesAmount.Value) > 1000000, "Green",
           IIF(Sum(Fields!SalesAmount.Value) > 100000, "Blue","Red")
     )
Analysis:
- If the Sum of Sales Amount is greater than 1000000, then Data Bar will be filled with Green color
- If the Sum of Sales Amount is greater than 100000, then Data Bar will be filled with Blue color
- Otherwise Red color
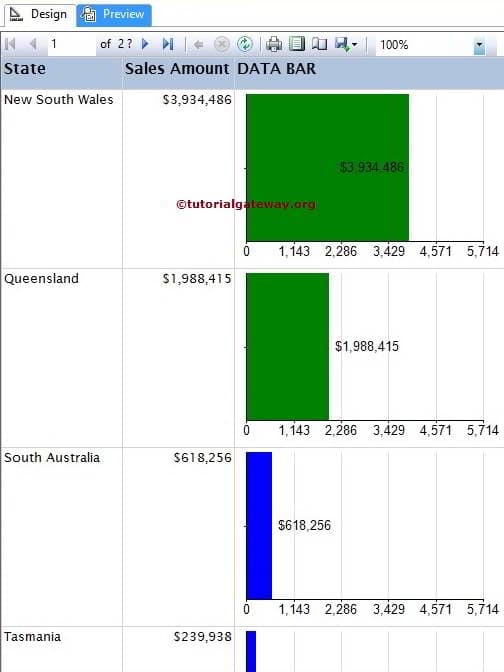
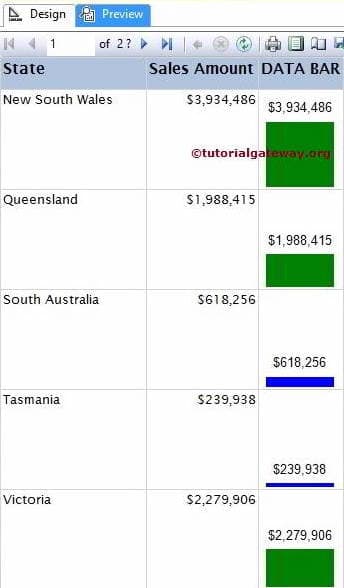
Click Ok to finish assigning colors. Click the preview button and see the Report preview
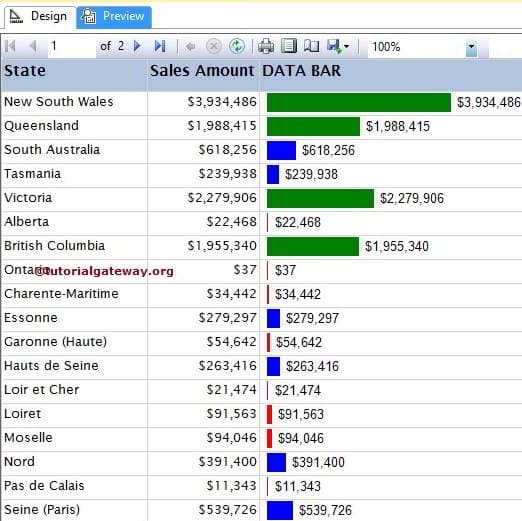
From the above screenshot, you can observe that the Report is generating three different colors based on the given expression.
Format Horizontal & Vertical Axis Properties of SSRS Data Bars
Right-click on the Blue bars will open the context menu. From the menu, please select Horizontal Axis Properties option as we have shown in below screenshot
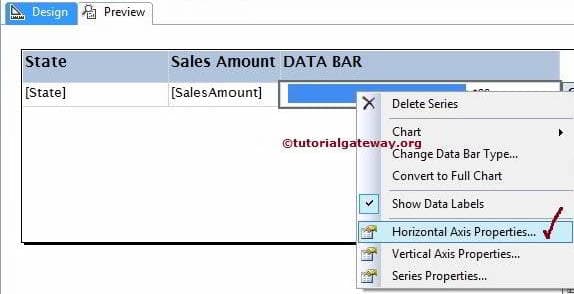
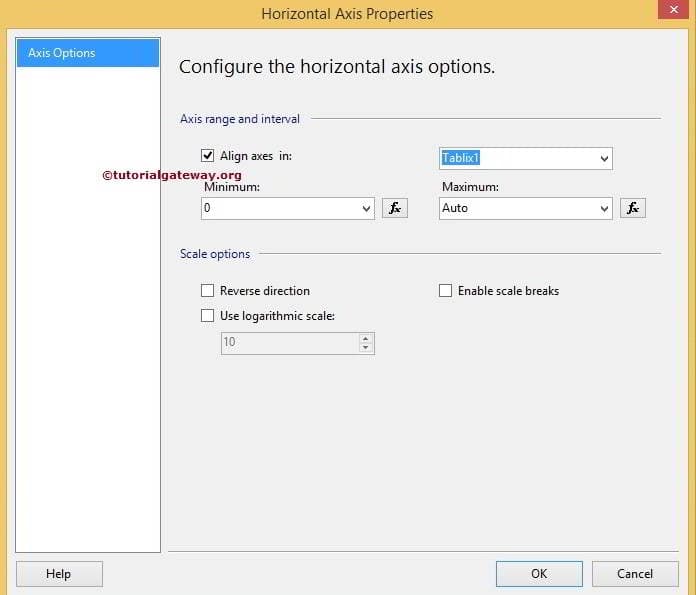
Once you choose the Horizontal Axis Properties option, a new window called Horizontal Axis Properties to configure the range and Scale options as per company requirements.
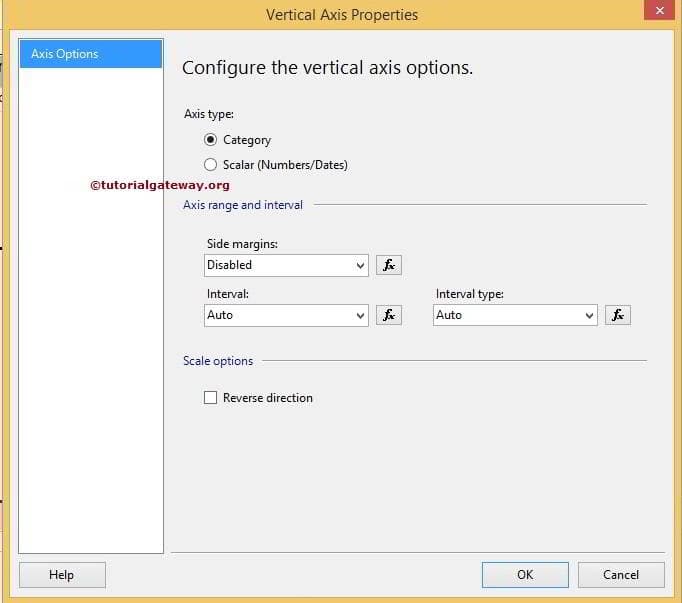
If you want to format the vertical Axis properties, select the Vertical Axis Properties option. Once you selected a new window called Vertical Axis Properties to configure the range, margins, and Scale options as per company requirements.
Change SSRS Data Bar Type
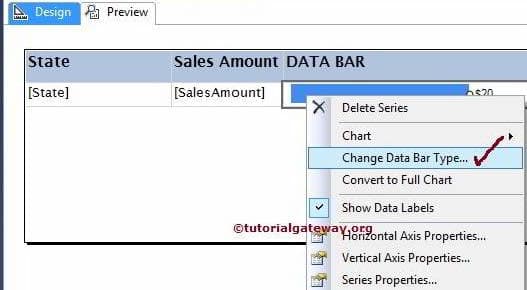
SSRS allows us to change the Data bar type even after creating the Data Bar. First, select the Data Bar, and right-click on it will open the context menu. Please select the Change Data Bar Type… option from the context menu
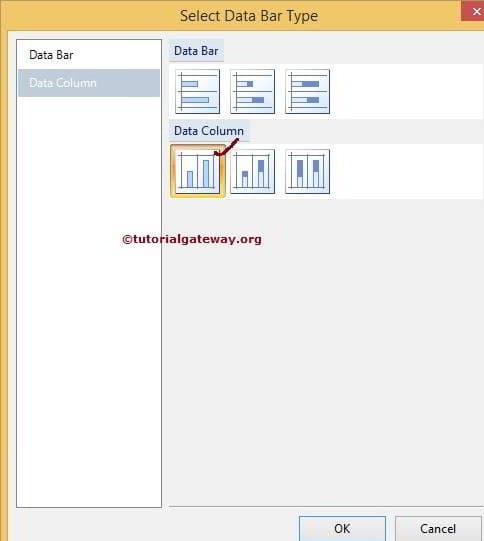
Once you select the Change Data Bar Type… option, it will open a new window to select the new Data Bar or data Column. Here we are selecting simple Data Column
Click Ok to finish and preview the report
Converting Data Bar to Full Chart in SSRS
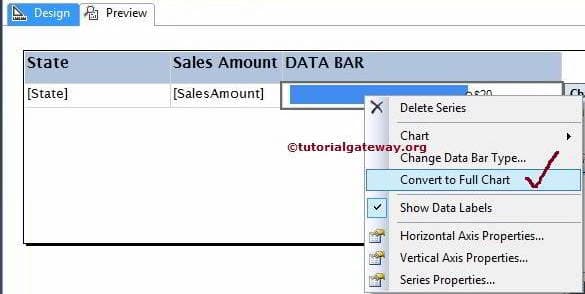
SSRS allows us to convert the Data Bar to Chart. First, select the Data Bar, and right-click on it will open the context menu. Please choose the Convert to Full Chart option
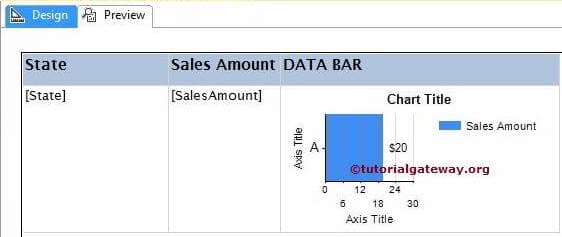
Once you select the Convert to Full Chart option, Data Bar will be replaced by the Column Chart with Vertical and Horizontal Axis as shown in below screenshot
Here, We removed the Axis Titles, Chart Title, Legend Title, and formatted the Numeric values as well.
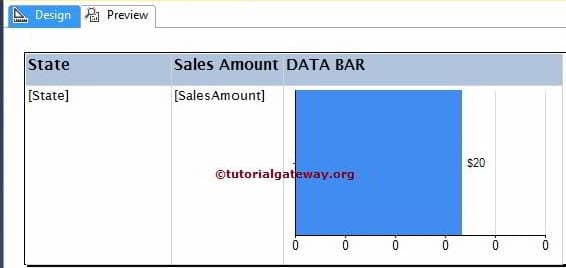
Let us click on the preview to preview the Data bar report