In this article, we will show you, How to create a Drill Down Matrix Report in SSRS manually?
- How to add Column Totals to Matrix reports?
- How to add Row Totals to Matrix reports?
- Add Grand Total to Matrix reports?
Drill Down Matrix Report in SSRS
We are going to use the below-shown report to Enable the Drill-Down in SSRS Matrix Reports. Please refer Matrix Report, Data Source, and Dataset articles to understand the creation of Data Source, Dataset, and Matrix report.
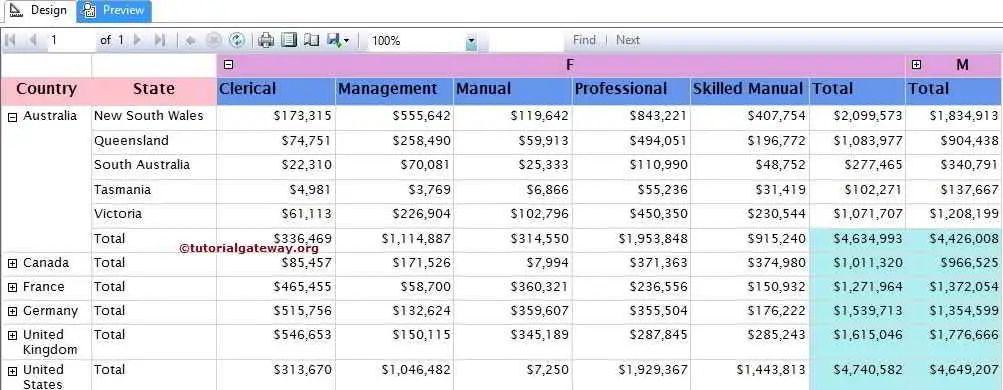
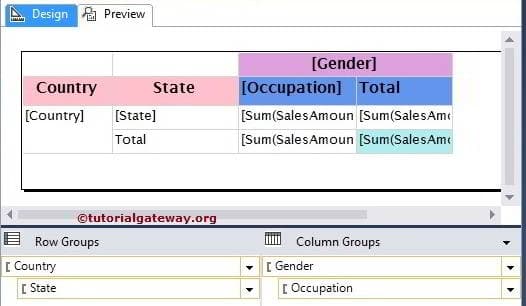
If you observe the below screenshot, It was a normal Matrix report with Country, State Column as Row Group and Gender, Occupation as Column Group.
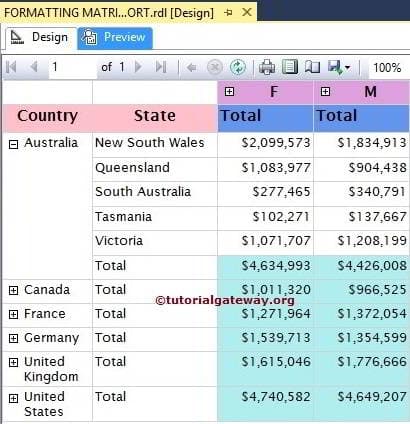
Add Totals to SSRS Matrix Report
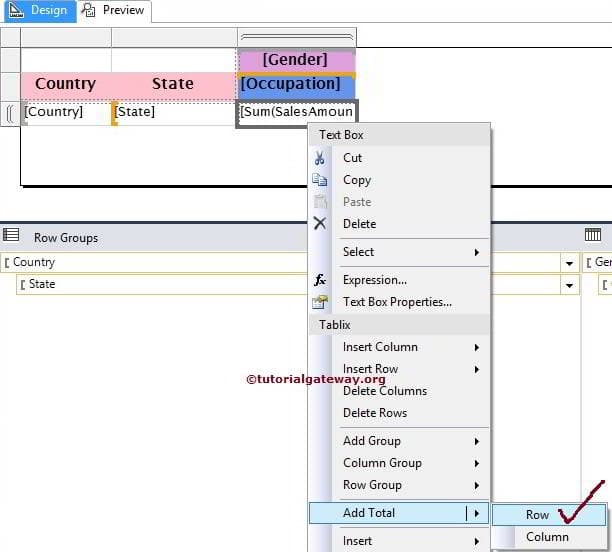
Right-click on the Aggregated data column will open the context menu with multiple options. Please select the Add TotalOption and then choose Row or Column as per your requirement. Here we are selecting Row. It will generate new Row below the existing Row with Row Total
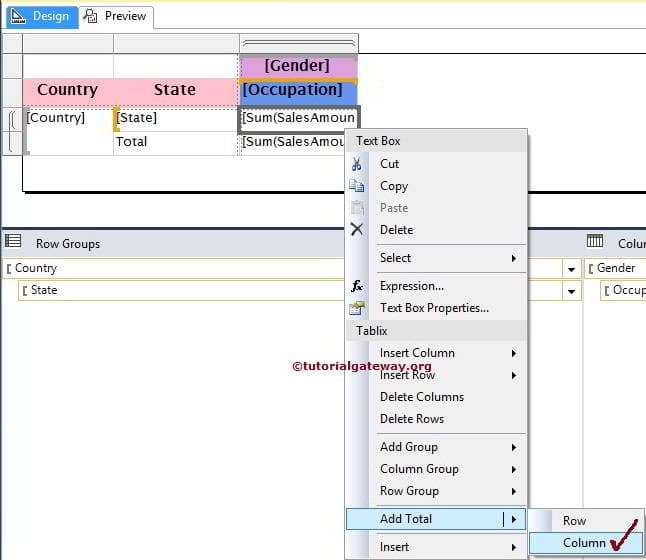
Next, we are selecting Column. It means It will create a new column on the right side to the existing row with Column Total
TIP: You can always change the default aggregate function SUM to other functions by selecting the fx Expression from the above screenshot.
We can add the Grand total by selecting the empty cell in between the Row Total and Column Total. Next, add the Sales Amount column to that cell.
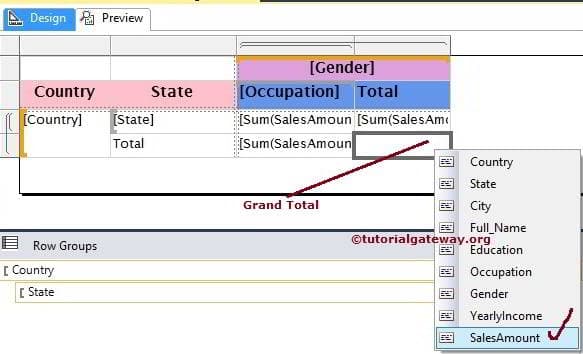
We changed the Background Color of the Grand Total cell to show you the difference between Row, Column, and Grand Total. Click on the Preview tab to see the Report Preview
Enable Drill Down in SSRS Matrix Report
It will be easy to enable the Drill Down option when we are creating reports using SSRS Report Wizard. However, to enable manually, we need some extra effort.
In this SSRS Drill Down Matrix report example, we will show you, How to hide State Names and Occupation Names and
- Allowing the user to select the Country Name to show or hide the state names
- Allowing the user to choose the Gender Name to show or hide the Occupation / Profession Column Names
First, go to Row groups pane, and right-click on the State Group will open the context menu. From the context, Please select Group Properties.. option.
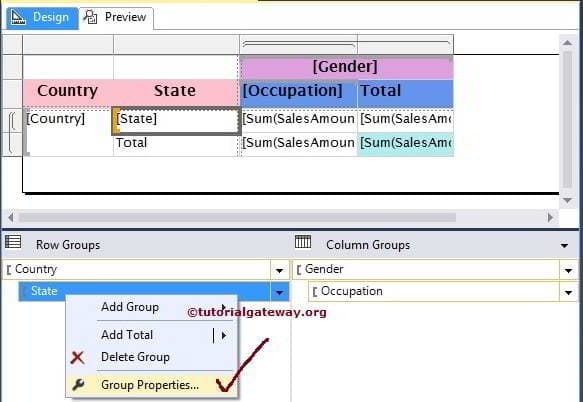
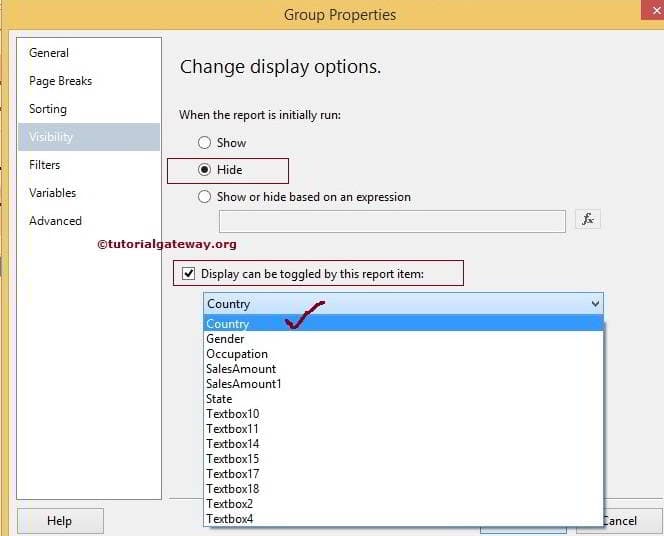
Once you select the Group Properties.. option, a new window will be opened to configure the Group Properties. Please select the Visibility tab on the left-hand side.
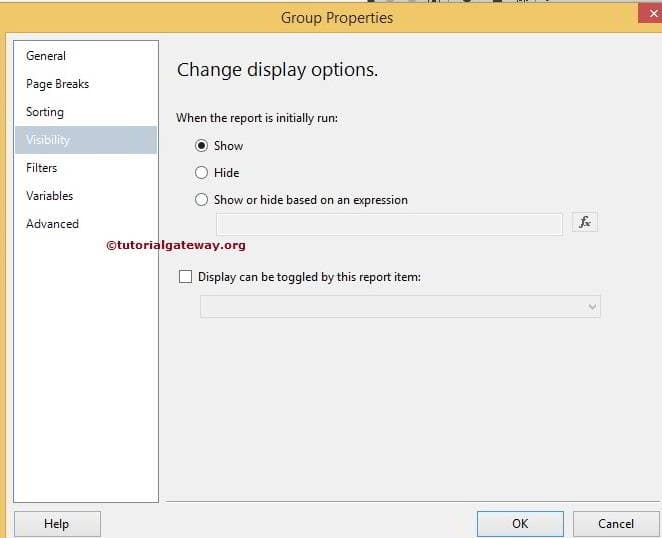
Visibility tab for the SSRS Drill Down Matrix report group Properties has multiple options:
- Show: When you run the report initially, If you want to show the state names then select the Show option
- Hide: When you run the report initially, If you want to Hide the state names, then select the Hide option. In this example, we want to hide the state names initially, so we chose this option.
- Show or Hide based on an Expression: You can write your own expression to show/hide the state names by clicking the fx button.
- Display can be toggled by this report time: If you select this option, State names will show/hide based on the report item we chose here. In this example, we want to toggle the state names based on the Country names selected by the user. So, select the Country column from the list.
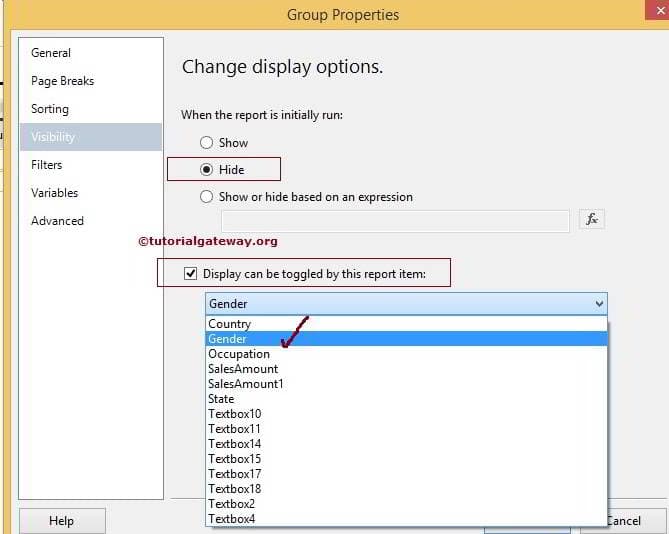
Now, Goto Column groups pane and right-click on the Occupation Group and select the Visibility tab on the left-hand side. In this example, we want to toggle the Occupation column names based on Gender chosen by the user to choose the Gender column from the list, as shown below.
Click Ok to finish enabling the Drill down functionality to Matrix report Manually.
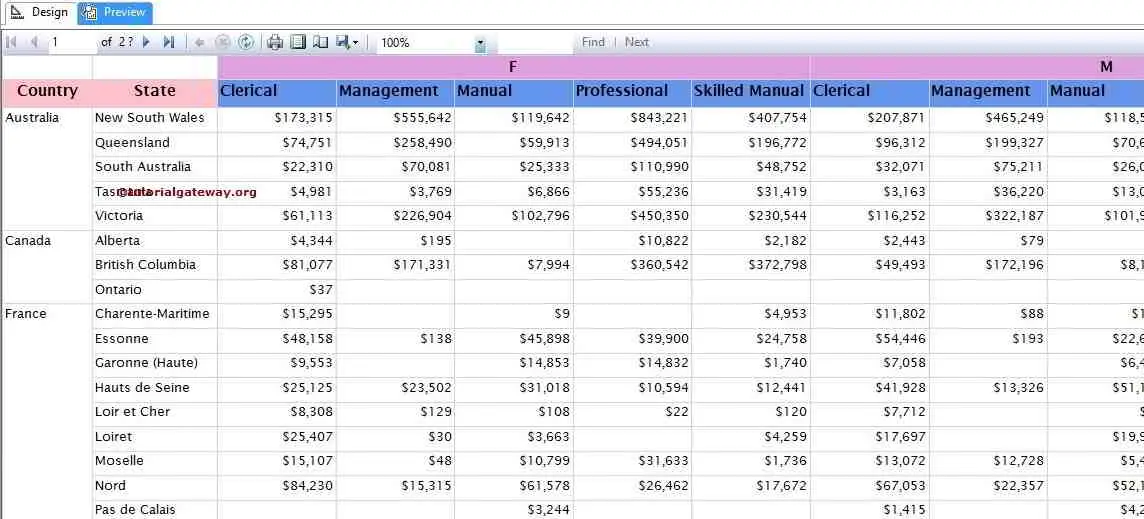
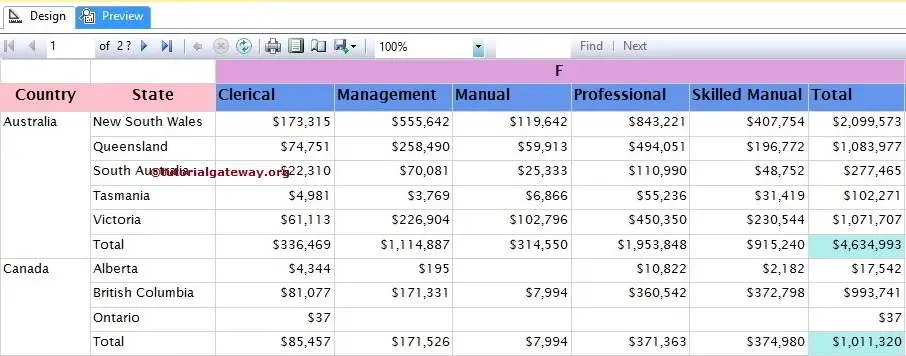
Click on the Preview tab to see the SSRS Drill Down Matrix Report preview. If you observe the below screenshot, State Names and Occupation Names are not displaying, and we have a + symbol beside the Country names and Gender Names to expand them.
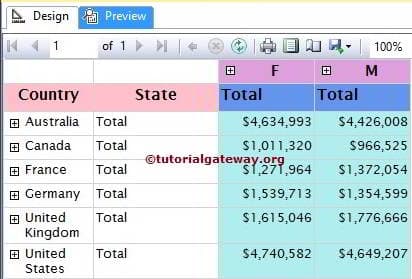
Once you click on the + symbol, corresponding state names will be displayed.
Let us preview the whole SSRS Drill Down Matrix report.