SSRS Report Items, also called Items, are the visual items placed inside the reports. To display any visual information to the end-user, we have to design the reports using these report items. This article will show the list of available SSRS Report Items.
SSRS Report Items
Before we get into the description, let me show you the list of SSRS Report Items inside the BIDS
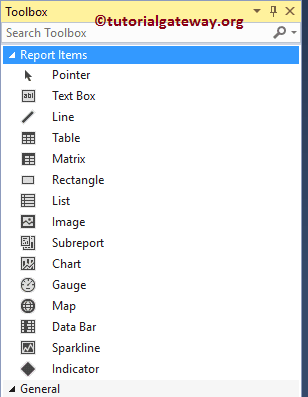
The following is the list of available SSRS Report Items, along with a small description:
- Charts: SSRS has various built-in reporting items to visualize the data, such as Column Chart, Stacked Bar Chart, Line Chart, Pie Chart, Funnel Chart, Pyramid Chart, Area Chart, Range Chart, Scatter Plot, Bubble Chart, and Radar Chart. We already explained these report items in our previous articles, so please refer to the Charts article to know the different charts. Otherwise, clicking on each hyperlink will show you a practical example.
- Data Bar: This Report Item is commonly used inside the Matrix or a Table. You can use this report item to visualize the High-level Data using bars. Please refer to Data Bars to understand the steps involved in configuring the Indicator inside a Table.
- Gauge: We use this SSRS report item mostly to visualize the KPIs. Please refer to Gauges to see the steps involved in configuring the Radial Gauges and Linear Gauges article for Linear gauges.
- Image: The Image is handy for displaying the Product Pictures, Company Logo, or any custom image in the report designer. Please refer to the How to Display Images in a Report and Display Image Based on Expression articles for the steps involved in inserting an image into the Report.
- Indicator: This SSRS Report Item is used inside the Matrix or a Table. Using an Expression, we can change the indicator colors per our requirements. Please refer to the Indicators article to see the steps in configuring the Indicator inside a Table.
- Map: This report item helps visualize the data in a geographical context.
- Matrix: Use this report item to display the data with both Row Groups and Column Groups. Please refer to the Matrix Reports article to understand the configuration of the Matrix reports.
- Line: As its name suggests, this is just a line to divide the report fields.
- List: This SSRS report item is similar to Table and Matrix, but the free flow nature of the List Item allows you to add new report Items inside the List. Please refer to Create a List Report article to understand the steps involved in configuring the List.
- Rectangle: This report item combines one or more items inside it. Please refer to How to Add a Rectangle to a report to understand the steps involved in adding a rectangle to the Report.
- Spark Line: Similar to the Data bars, it is handy inside the Matrix or a Table. It is beneficial to visualize the trends inside a Tablix. Please refer to Sparkline for further reference.
- Subreports: This SSRS report item is useful to add related reports to the existing Report. In our previous article, we already explained the concept in detail, so please refer Subreports article to understand the same.
- Table: This is the basic one to display the data in the two-dimensional table format. Please refer to the Table Report article to know the steps involved in creating and configuring the Table reports.
- Text Box: Use the textBox report item to place text inside a Report. You can place these text boxes inside the Report, Headers, or Footers. In our previous article, we already explained adding TextBox to report Designer. So, please refer to Add textBox to a Report.