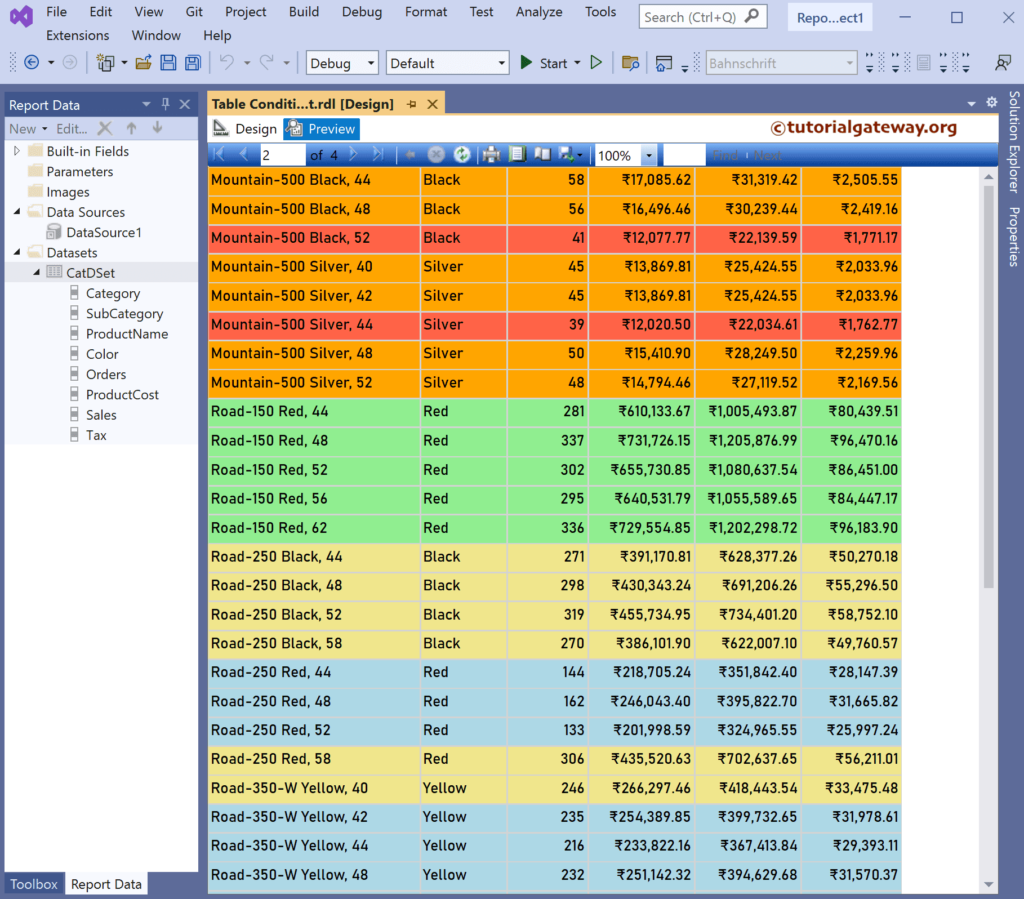
This SSRS article shows how to create a highlight table using conditional formatting with an example. For instance, you can use a highlight table to differentiate high-performing products from low or average ones. We can use either the SSRS IIF condition or the switch statement to perform conditional formatting, which eventually creates a highlight table.
Right-Click on the Datasets folder to create a new DataSet. The below screenshot shows the data set that we use for this example.
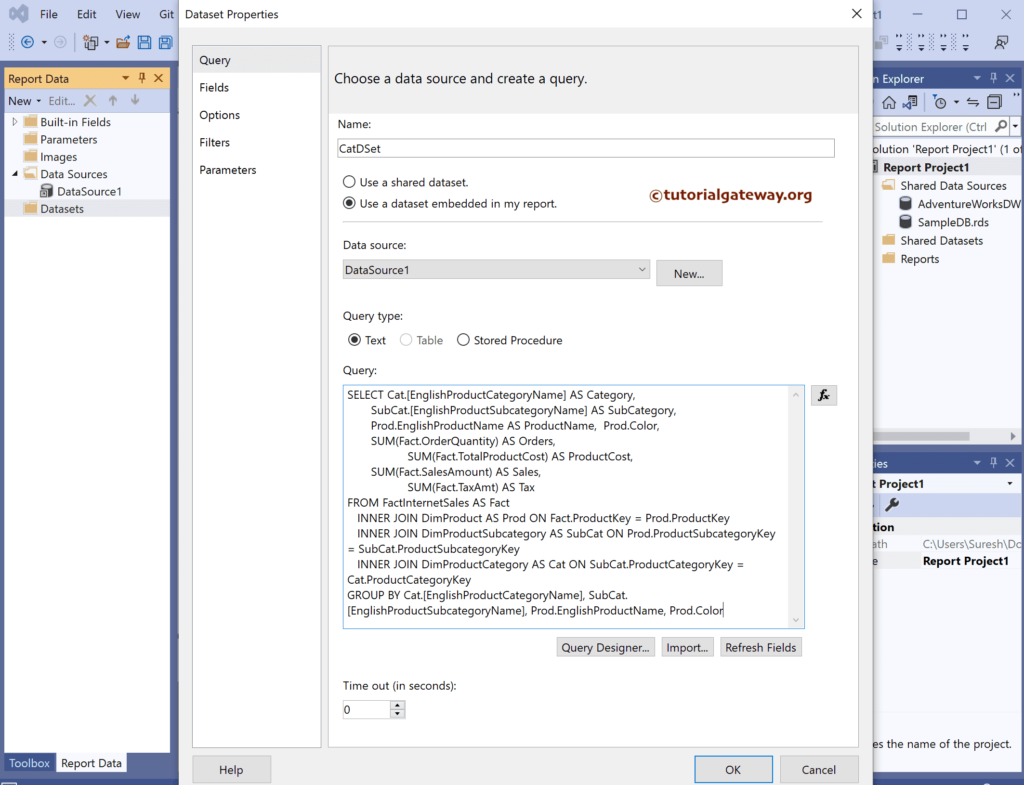
The Sql query that we used above SSRS example is:
SELECT Cat.[EnglishProductCategoryName] AS Category,
       SubCat.[EnglishProductSubcategoryName] AS SubCategory,
       Prod.EnglishProductName AS ProductName,
       Prod.Color,
       SUM(Fact.OrderQuantity) AS Orders,
       SUM(Fact.TotalProductCost) AS ProductCost,
       SUM(Fact.SalesAmount) AS Sales,
       SUM(Fact.TaxAmt) AS Tax
FROM FactInternetSales AS Fact
   INNER JOIN DimProduct AS Prod ON Fact.ProductKey = Prod.ProductKey
   INNER JOIN DimProductSubcategory AS SubCat ON Prod.ProductSubcategoryKey = SubCat.ProductSubcategoryKey
   INNER JOIN DimProductCategory AS Cat ON SubCat.ProductCategoryKey = Cat.ProductCategoryKey
GROUP BY Cat.[EnglishProductCategoryName], SubCat.[EnglishProductSubcategoryName],
		Prod.EnglishProductName, Prod.Color
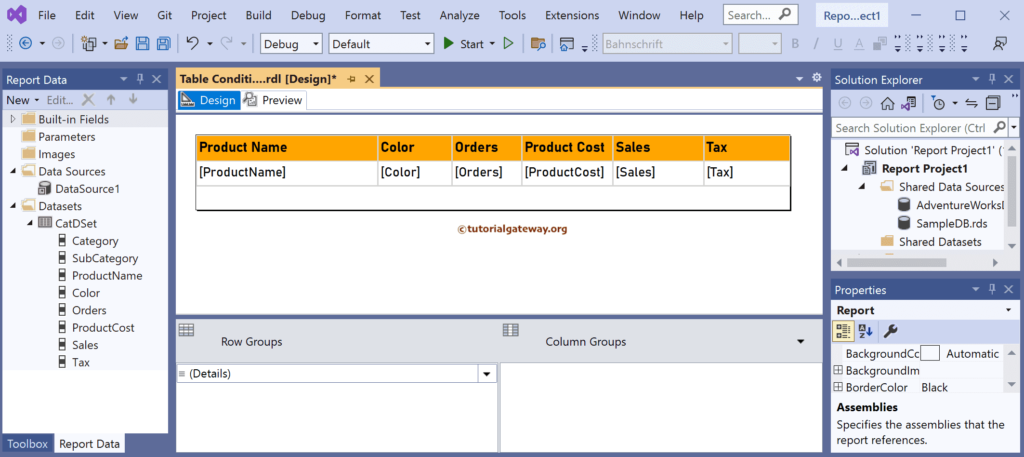
We have designed a simple table report of Product sales and formatted the font and colors.
Let me show you the report preview.
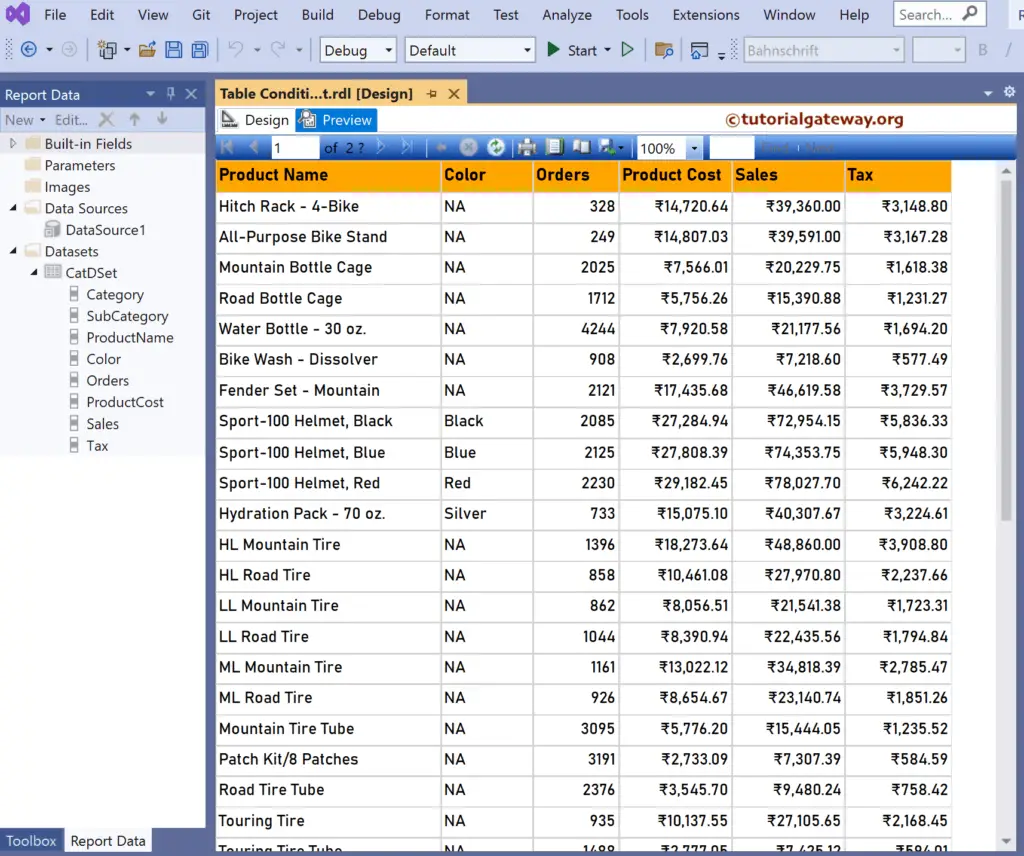
SSRS Highlight Table using Conditional Formatting
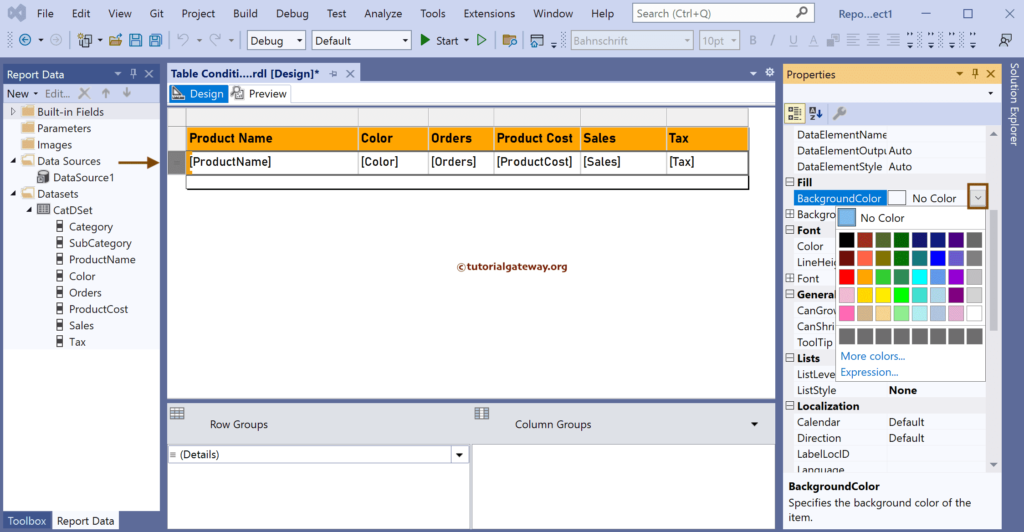
Please select the place where we pointed the arrow to choose the complete row and go to the properties to change the background color. Here, our job is to change the background color based on some expressions. So, click the Expression hyperlink.
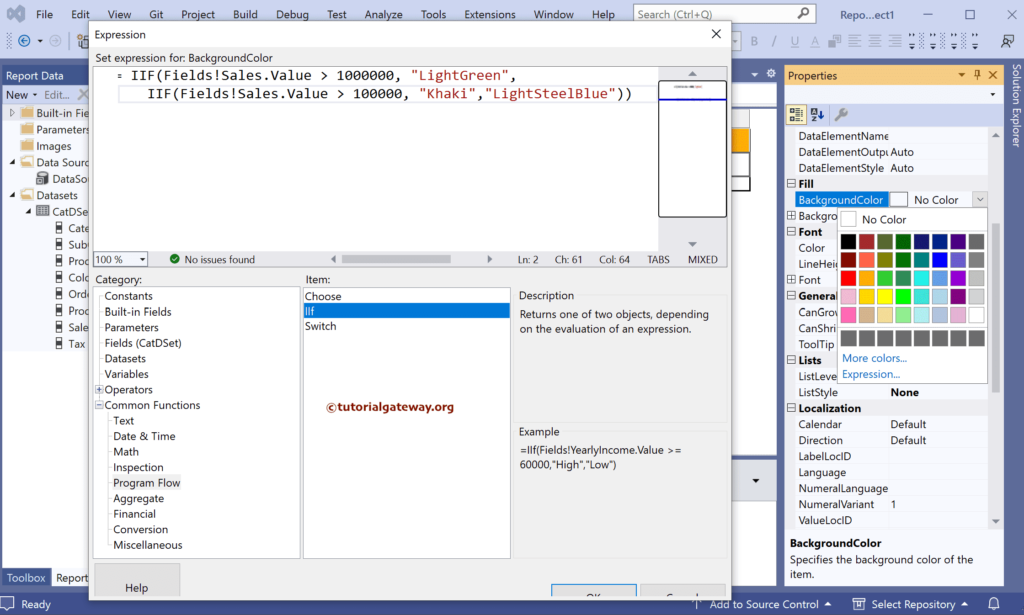
Here, we used the IIF condition to change the background color based on product sales.
- For above 1000000, it’s light green.
- For above 100000, it’s Khaki color.
- And for all the remaining rows, Light Steel Blue.
= IIF(Fields!Sales.Value > 1000000, "LightGreen",
	IIF(Fields!Sales.Value > 100000, "Khaki","LightSteelBlue"))
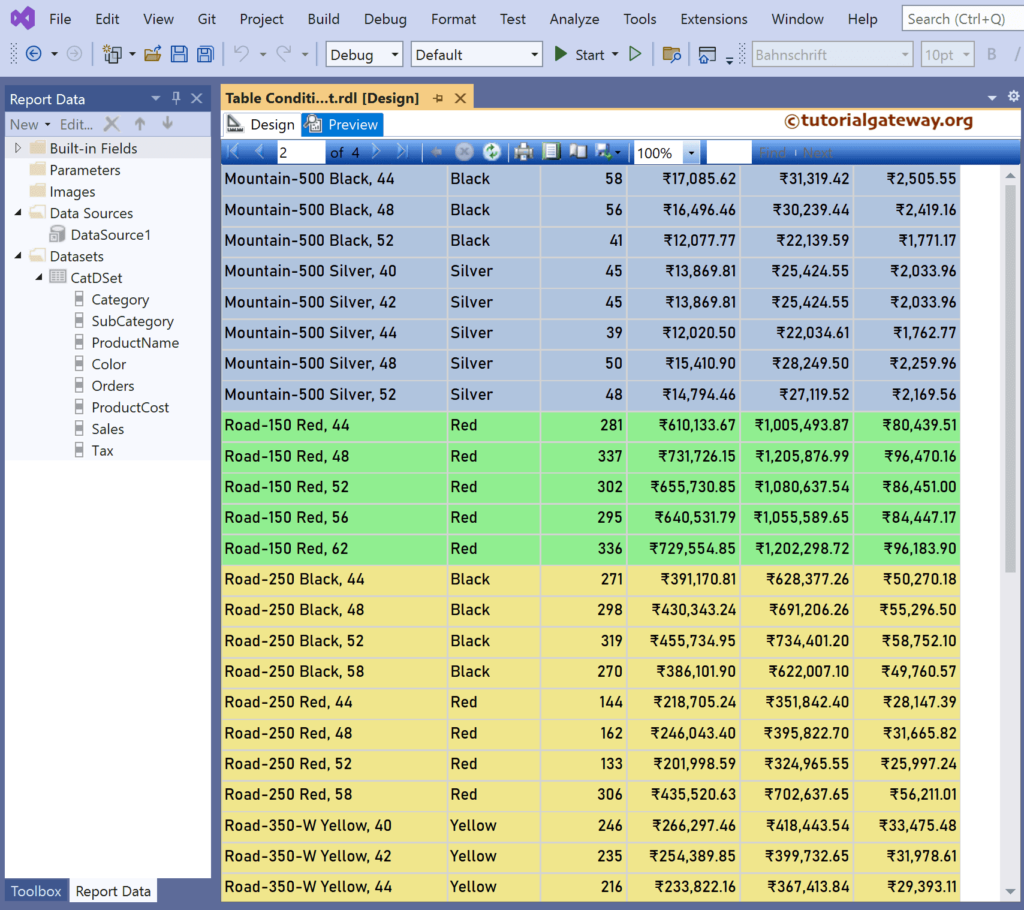
If you observe the report review, there are three different colors for the rows based on their sales.
Let me use the SSRS switch case to show more colors on the highlight table. For this, we have written the below expression.
=Switch(Fields!Sales.Value >= 1000000, "LightGreen",
		Fields!Sales.Value >= 400000, "Khaki",
		Fields!Sales.Value >= 100000, "LightBlue",
		Fields!Sales.Value >= 50000, "Plum",
		Fields!Sales.Value >= 25000, "Orange",
		Fields!Sales.Value < 25000, "Tomato"
		)
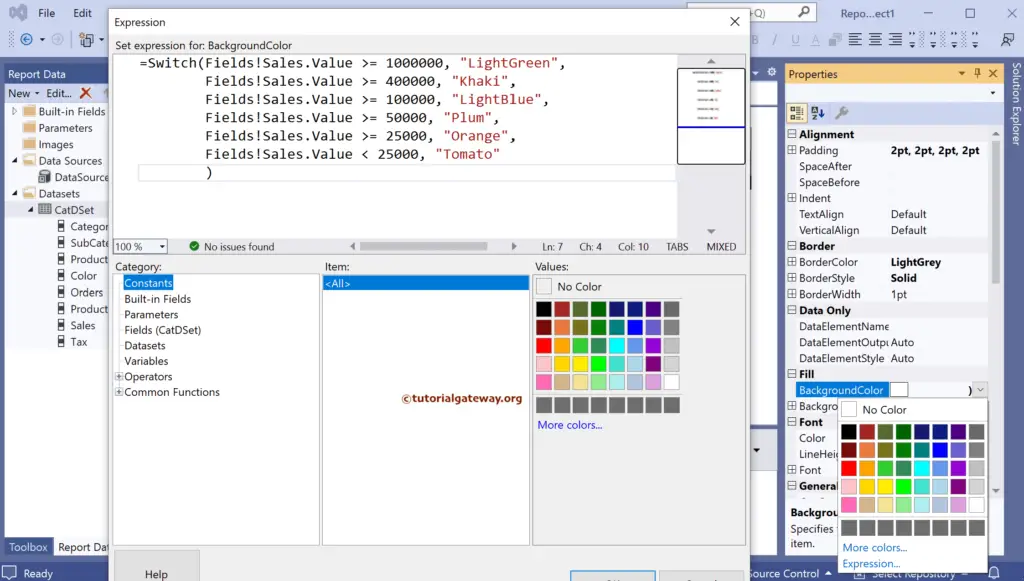
Now, you can select more colors for the table report.
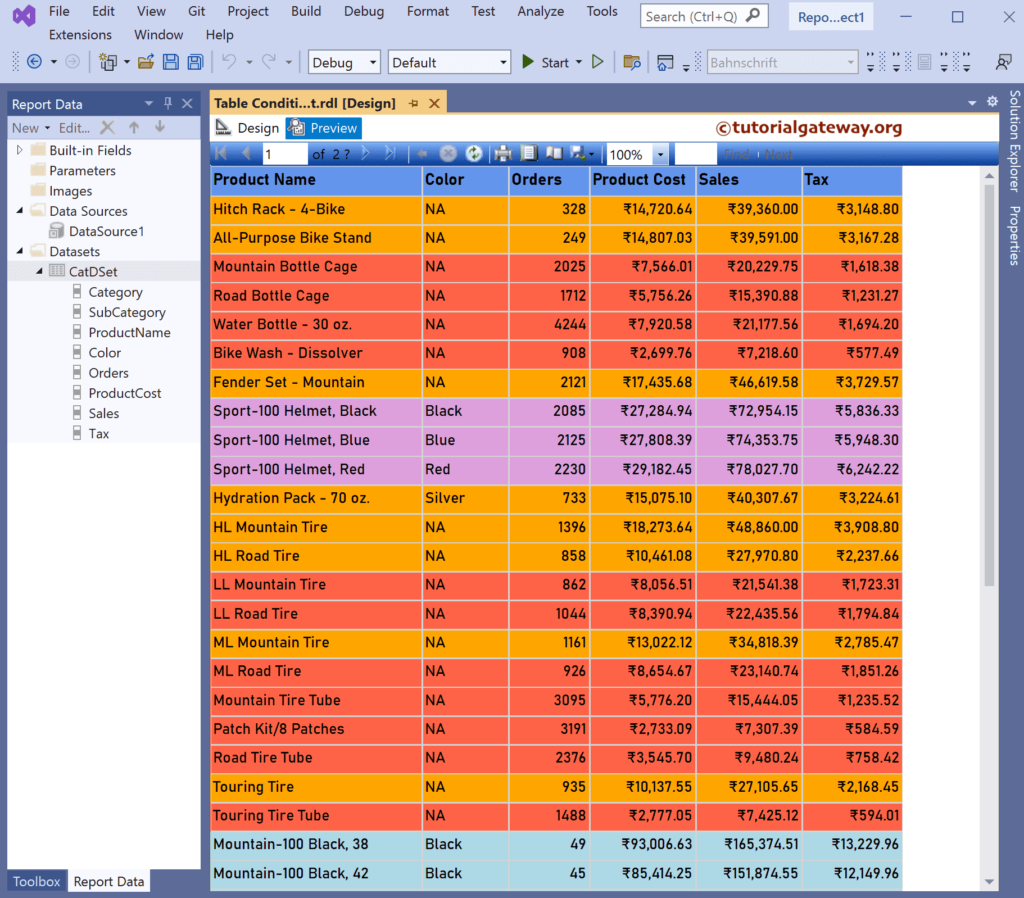
Let me also check the next page to see more colors of the highlight table.
