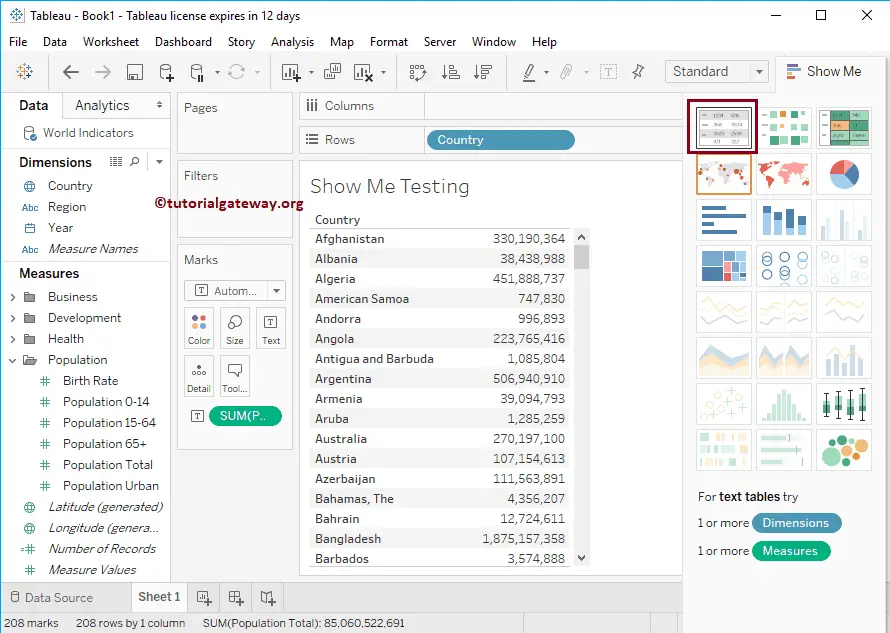
The Show Me window holds the most commonly used charts in Tableau. You can use any of these charts to view the data. Click Show Me on the toolbar to open this window, as we have shown below.
Tableau Show Me Window
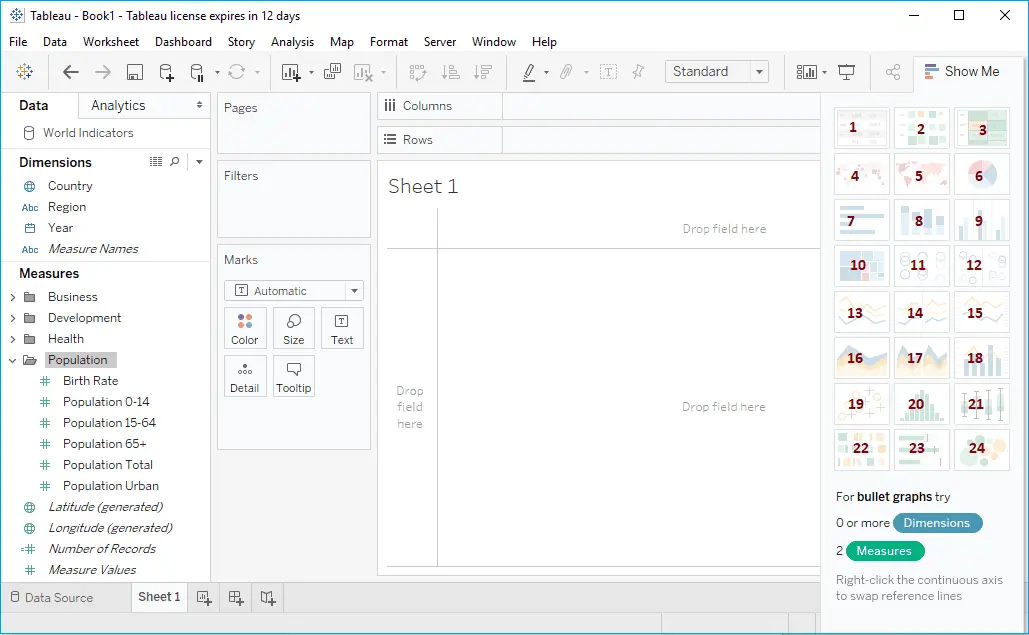
Clicking the tab will open the following window. The following is the list of charts that are available in the Show Me window.
- Text Label
- Heat Map
- Highlight Table
- Symbol Maps
- Maps
- Pie Chart
- Horizontal Bars
- Stacked Bars
- Side-By-Side Bars
- Treemap
- Circle Views
- Side-By-Side Circle Views
- Line Chart
- Discrete Lines
- Dual Lines
- Area Chart
- Discrete Area
- Dual Combination
- Scatter Plot
- Histograms
- Box and Whisker Plots
- Gantt Chart
- Bullet Graph
- Packed Bubbles
Use Show Me to create a Table
For the Demonstration purpose, we drag the Countries field from the Measures Region to the Rows field and the Total Population to the Column field.
Next, we selected the Text Labels from Show Me. As you can see from the below screenshot, Tableau has created the Table report.