Tableau Dashboard is a View that will display a collection of several worksheets. You can use a single dashboard to analyze the entire Business. This article will show you how to create a Dashboard and Device Preview with an example. Device Preview means creating a Dashboard View for Desktop, Tablet, and Mobile Phones.
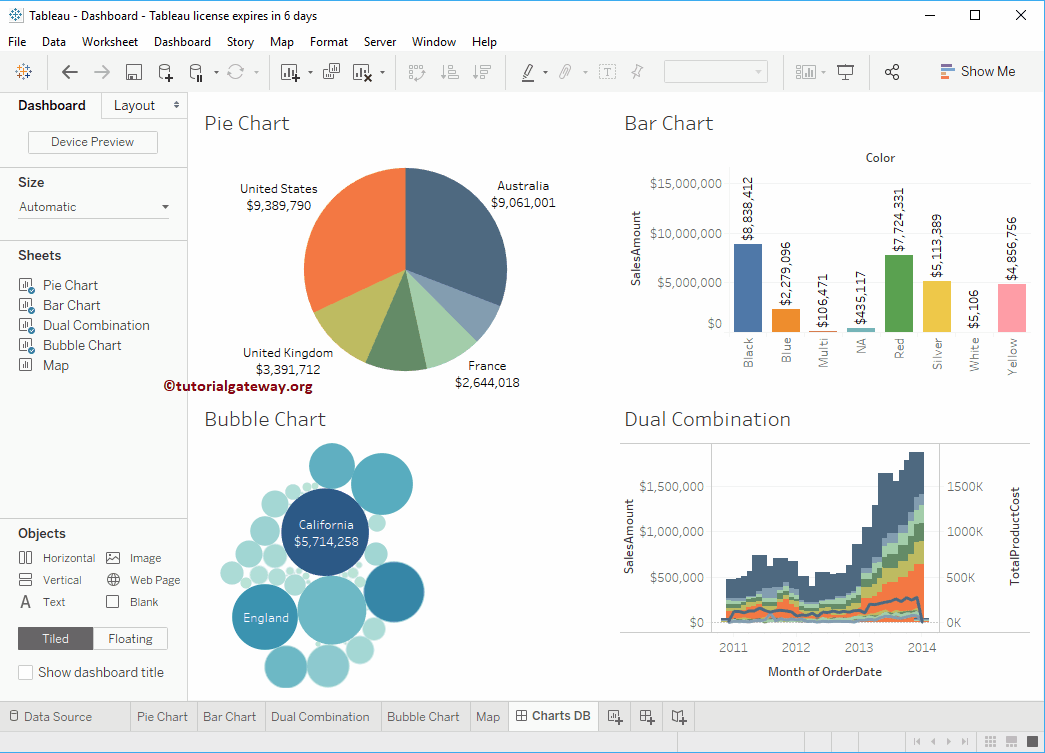
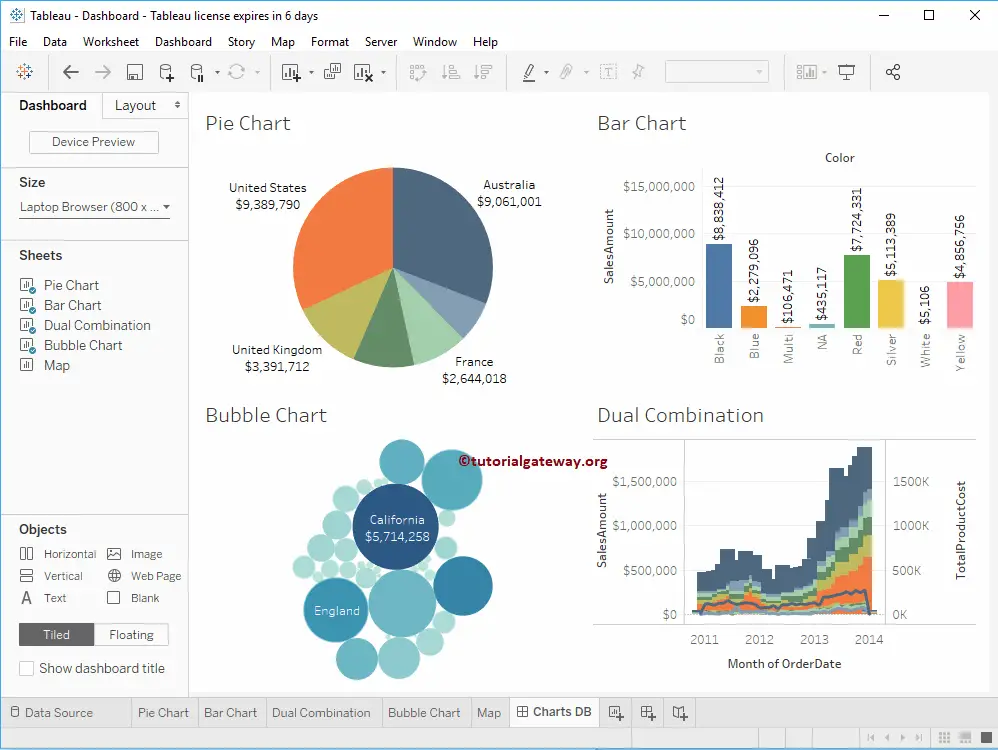
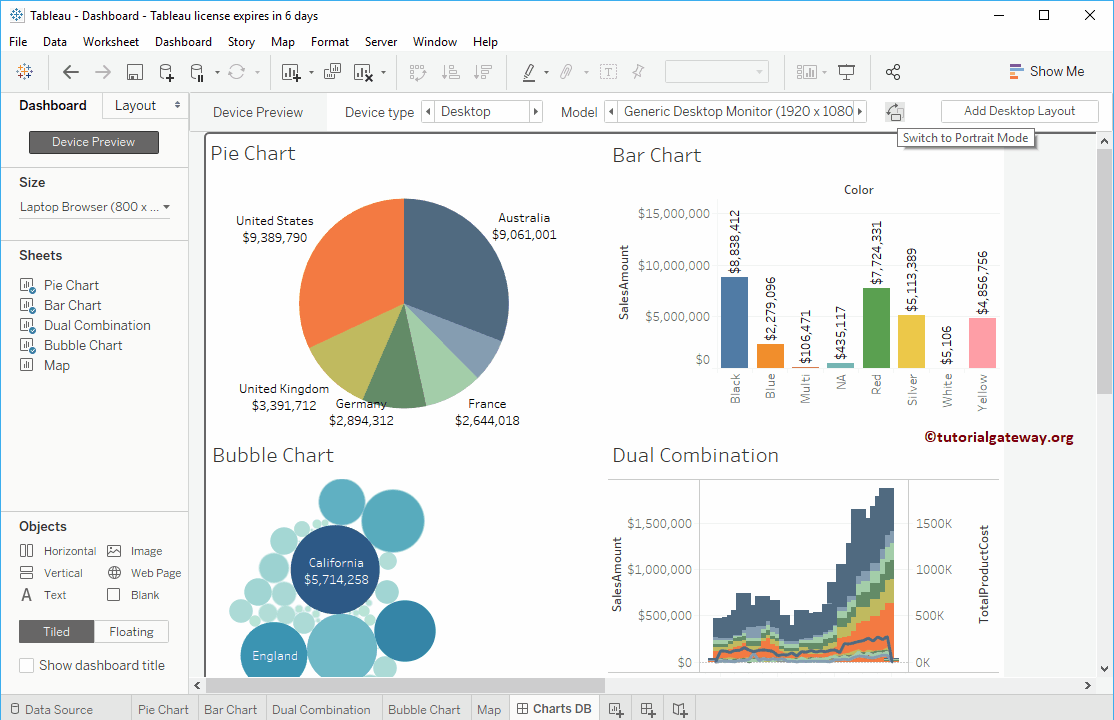
For this create Tableau Dashboard demo, we use the worksheet below. It has a Pie Chart, Bar Chart, Dual Combination Chart, Bubble Chart, and Map.
How to Create a Dashboard in Tableau?
Please click on the New tab to create a Dashboard. Now, you can see the newly created dashboard.
- Device Preview: Use this button to create a View for Phones, desktops, and tablets.
- Size: To adjust the display size.
- Sheets: List of Sheets that are available to create this.
- Objects: Predefined objects that you can use in it.
- Name: Right-click and select the Rename Sheet option to rename this.
- It is the actual work area.
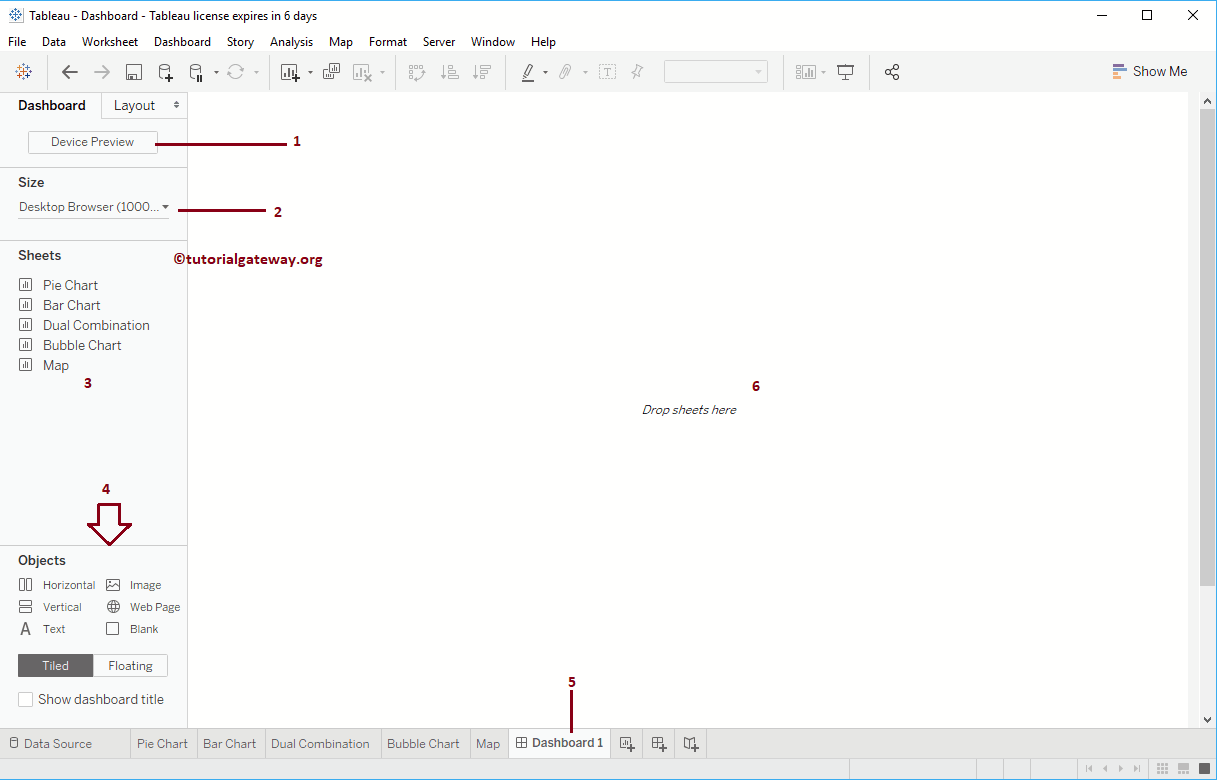
Tableau Dashboard Objects
The above screenshot shows the list of Objects available in the Dashboard (marked as 4).
Add Image to Dashboard
Generally, we use this to add a Logo. Let me drag and drop the Image Object onto the work area. This will open a dialogue window to choose the image. Please use this window to select the required image.
Now you can see the Image on our dashboard.
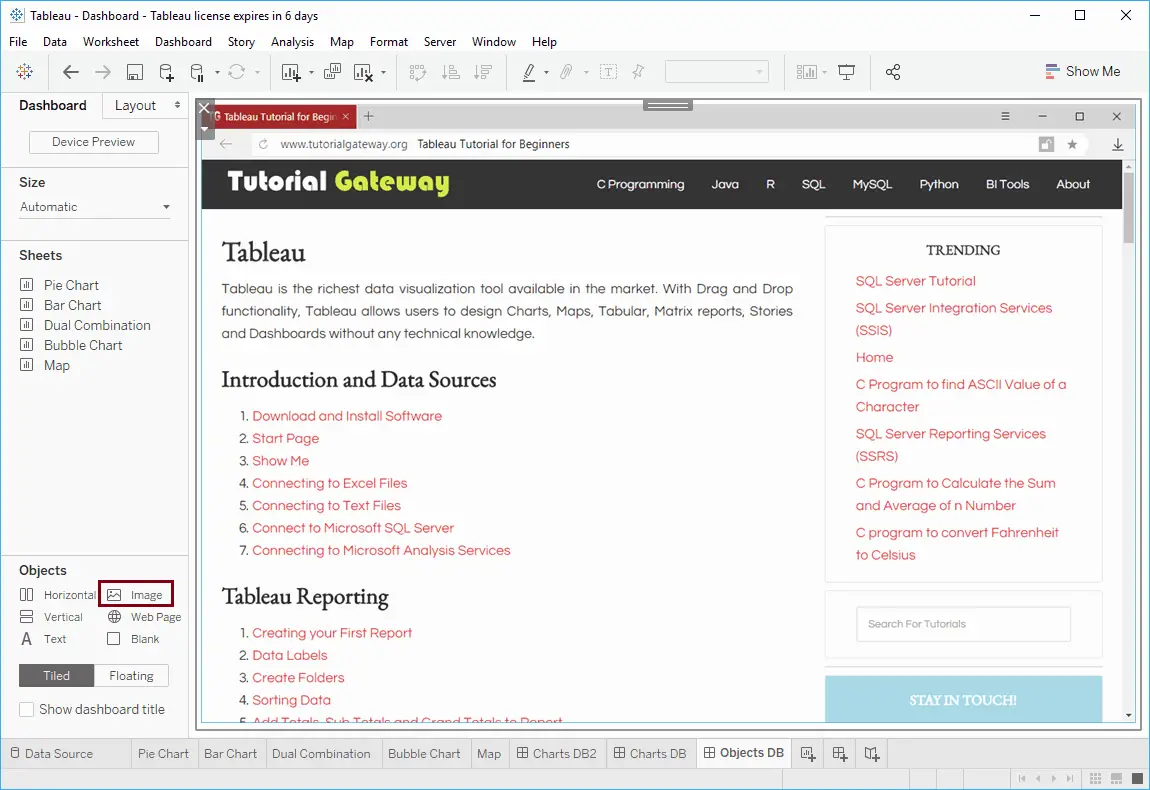
Add Web Page to Tableau Dashboard
Let me drag and drop the Web Page Object onto the work area of a dashboard. Drop the Web page will open a pop-up window to write the URL. For now, we are pointing to the SQL Server.
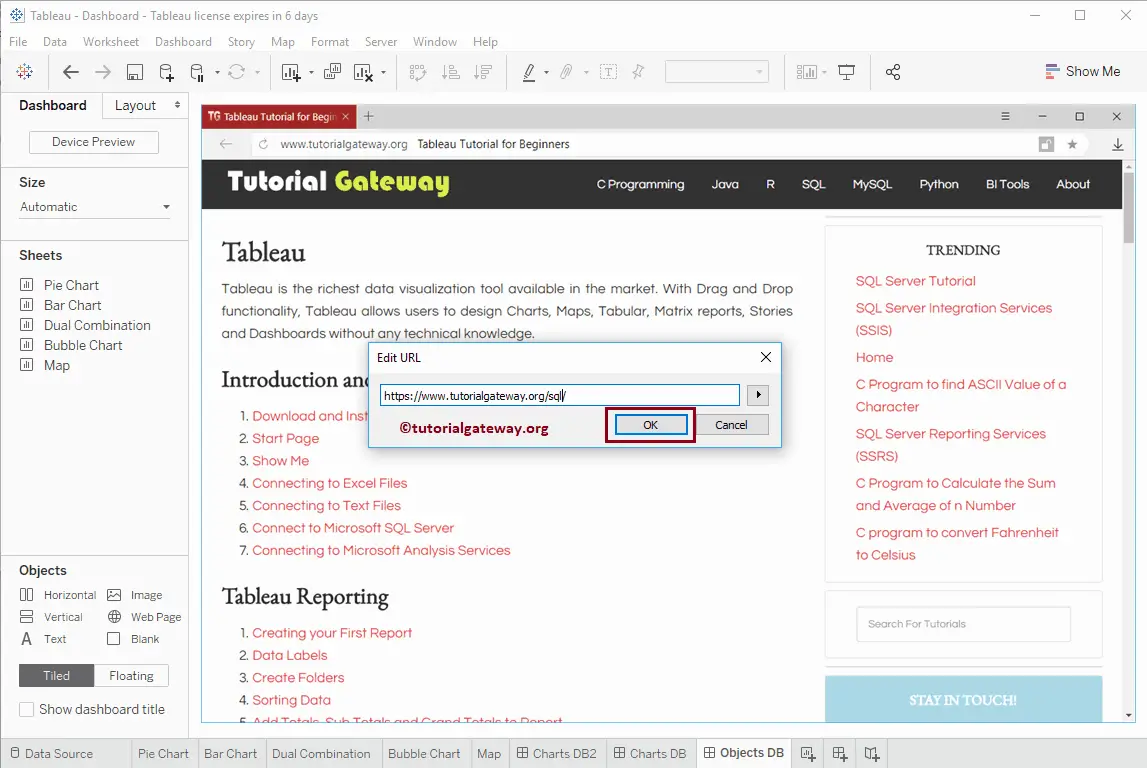
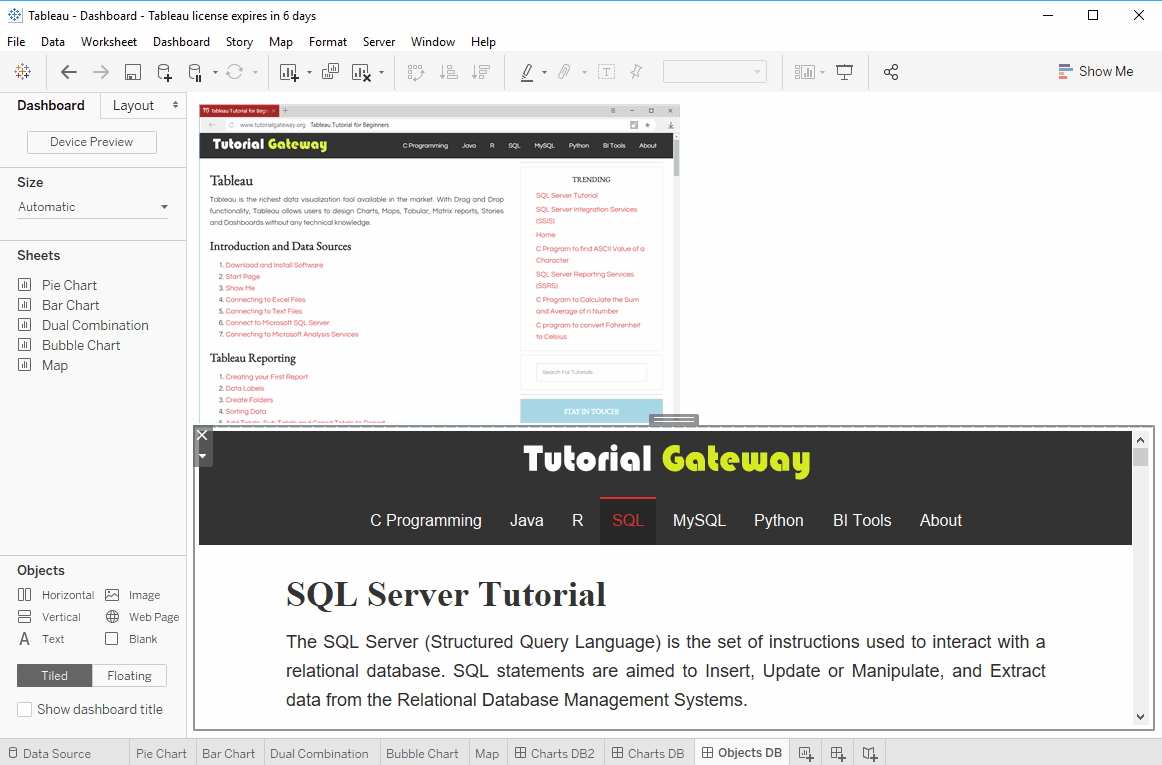
You can see the Tutorial Gateway web page on our dashboard.
Add Text Object to Tableau Dashboard
When you drop the Text object onto the work area, a new pop-up window called Edit Text will open. Use this window to write your custom.
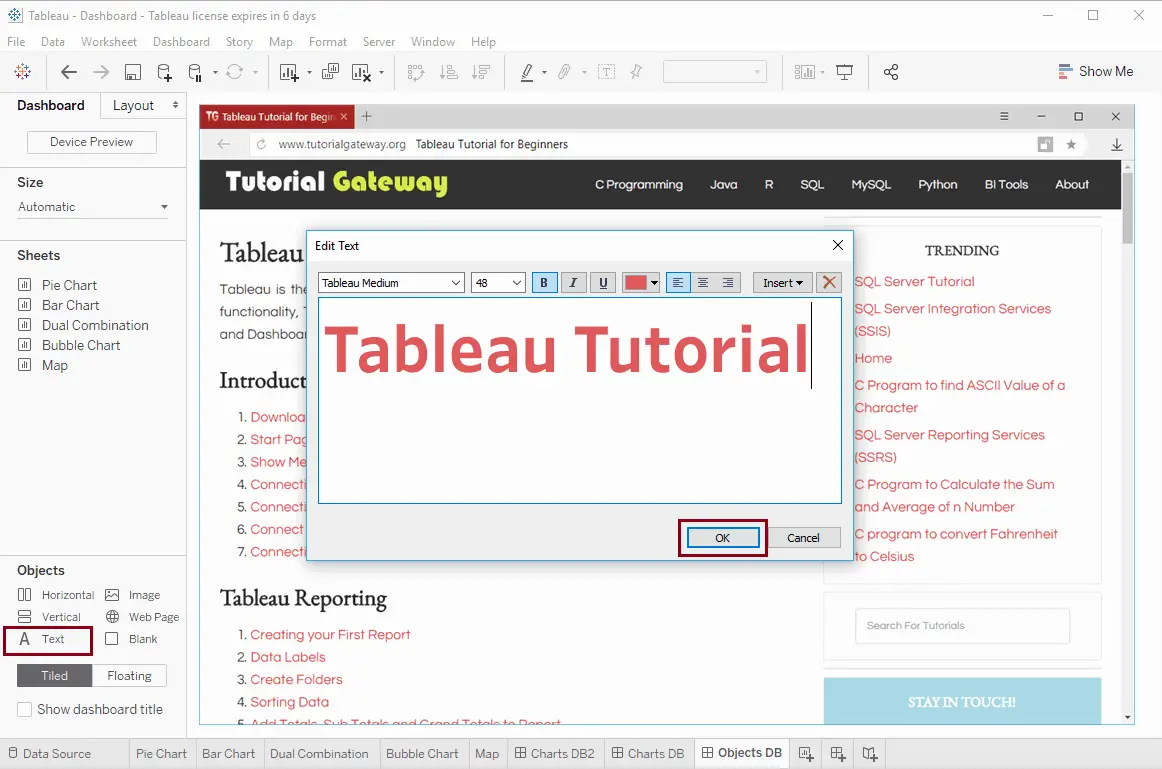
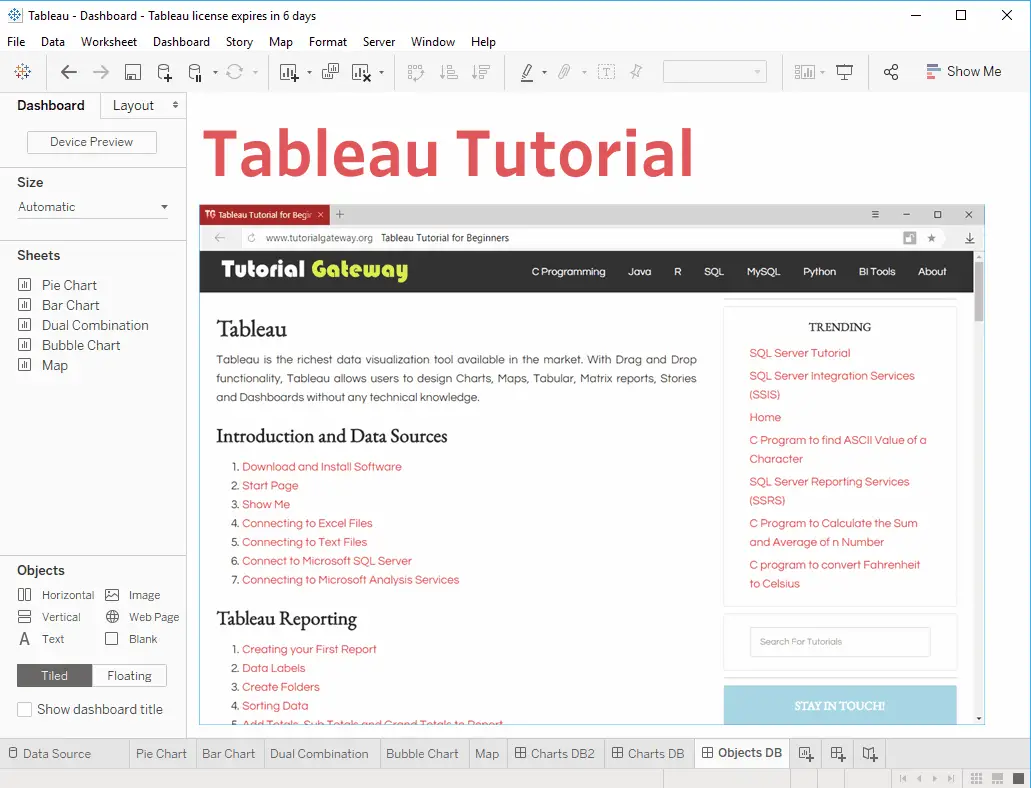
Now you can see the Text added to our dashboard.
Add Report or Sheet to Tableau Dashboard
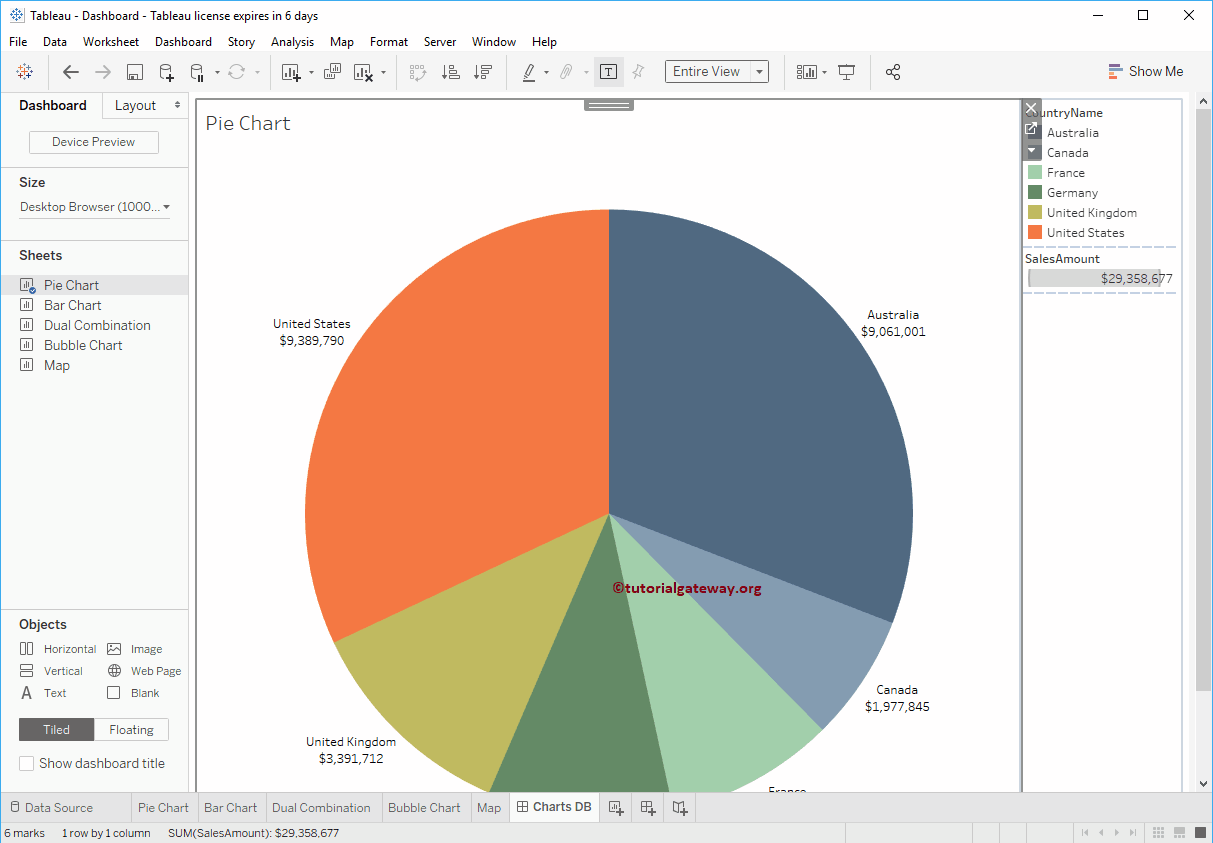
Hover over any sheet of the newly created dashboard to see the preview, and clicking the marked button will take you to the original. Please refer to the Pie Chart, Bar Chart, Dual Combination, Bubble, Map, and Data Labels in the Reports in Tableau.
Let me drag the Pie Chart to the dashboard to add.
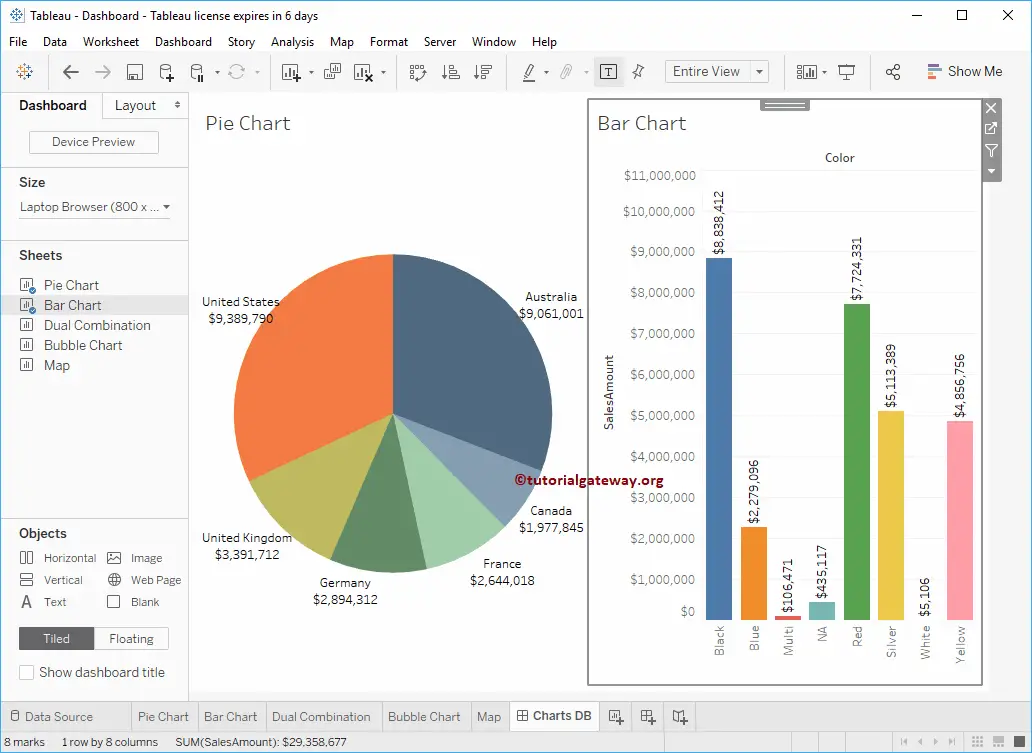
Next, let me add the Bar Chart to the Tableau dashboard. If you are dragging something to the work area, it will ask for the location. I mean Top Right, Top Left, Bottom Right, etc, and for now, let me choose the right side. Now you can see two Sheets inside our dashboard.
Let me add the Dual Combination Sheet and Bubble Chart as well.
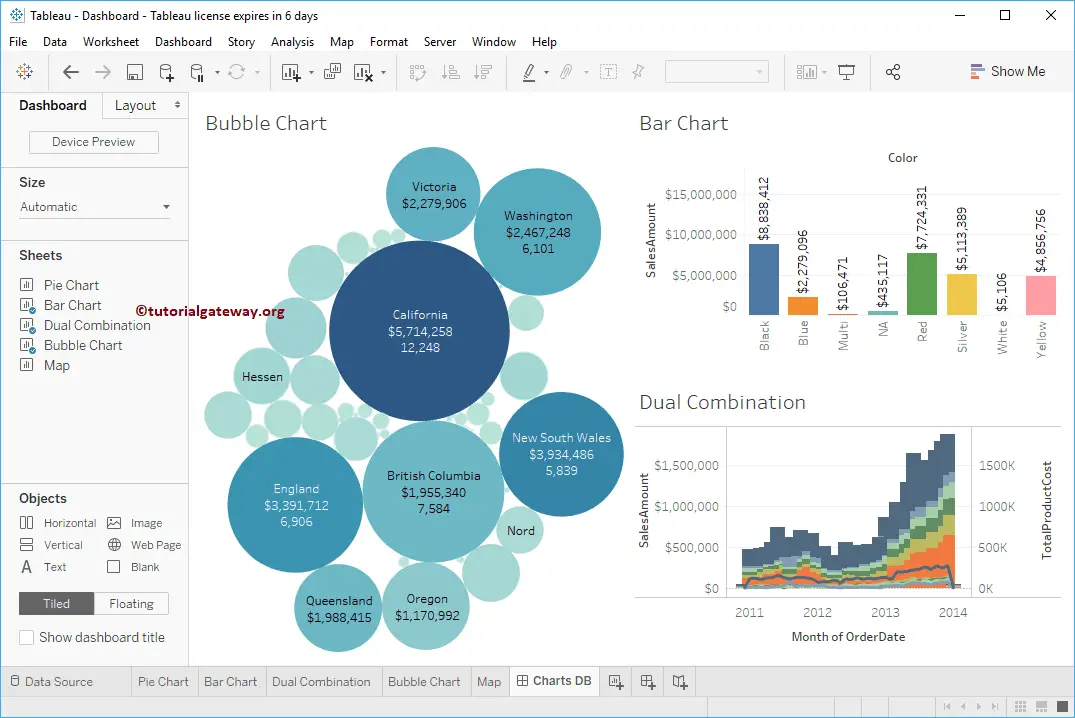
Rearrange Sheets in a Dashboard
To rearrange the Sheets on the already created dashboard, please select the Sheet that you want to change the location of and use the marked field.
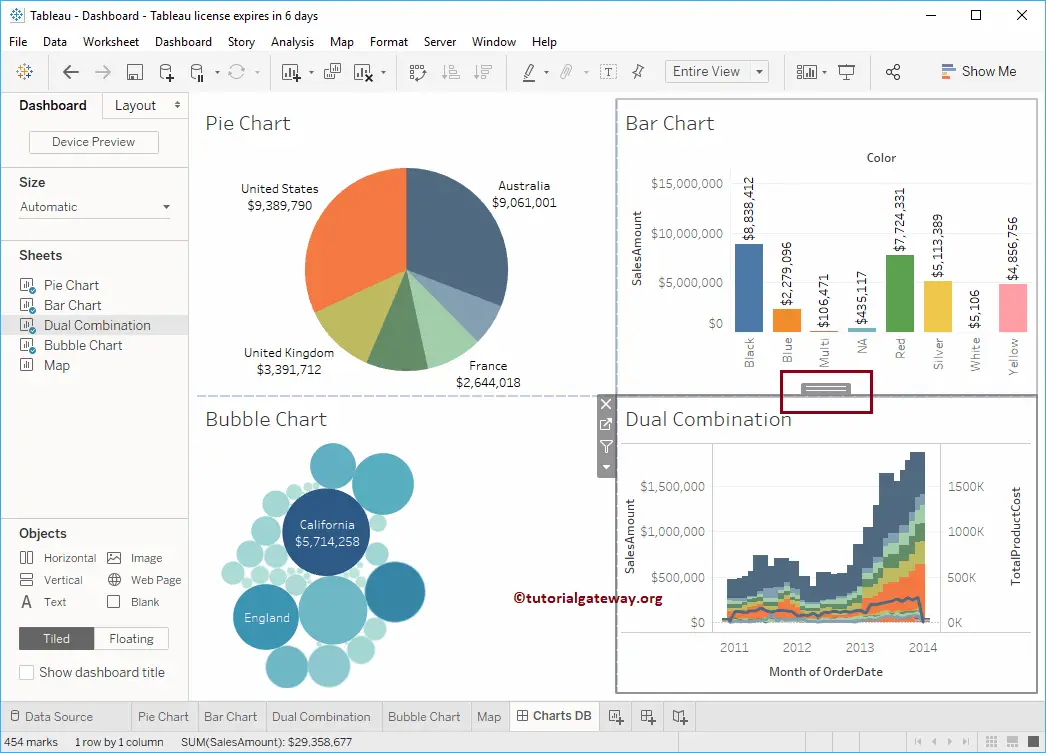
To demonstrate the same, we placed the Dual Combination at the bottom.
Delete Sheet from Tableau Dashboard
Please select the Sheet that you want to delete. Next, click the Close button.
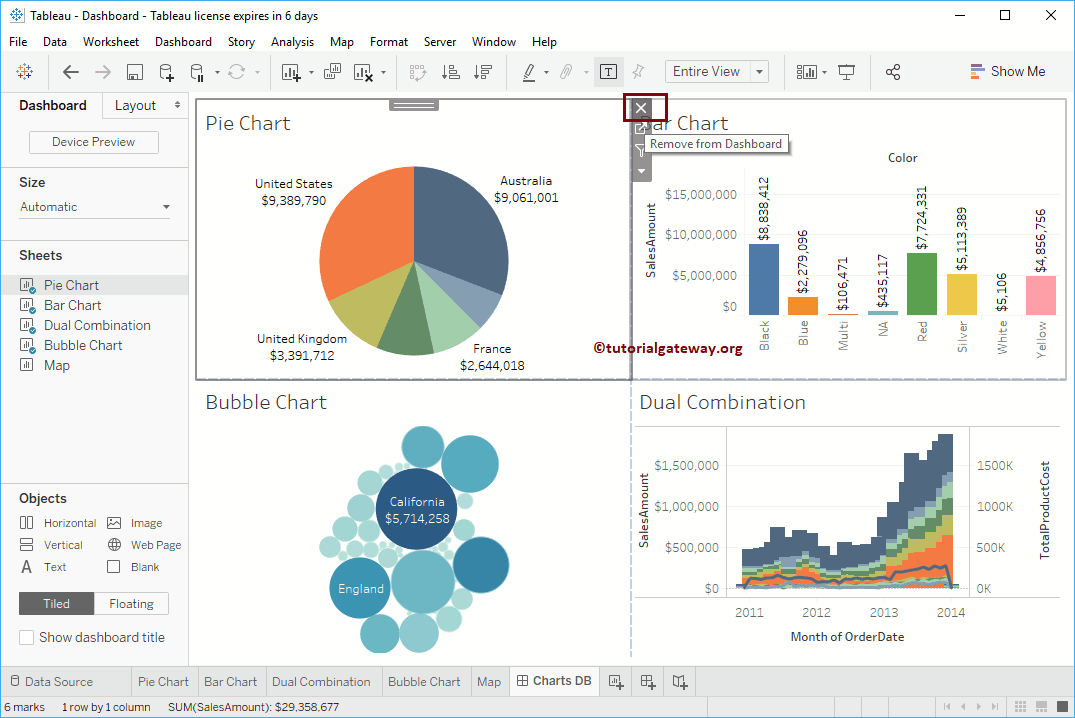
Or click on the Down arrow and select the Remove from Dashboard option.
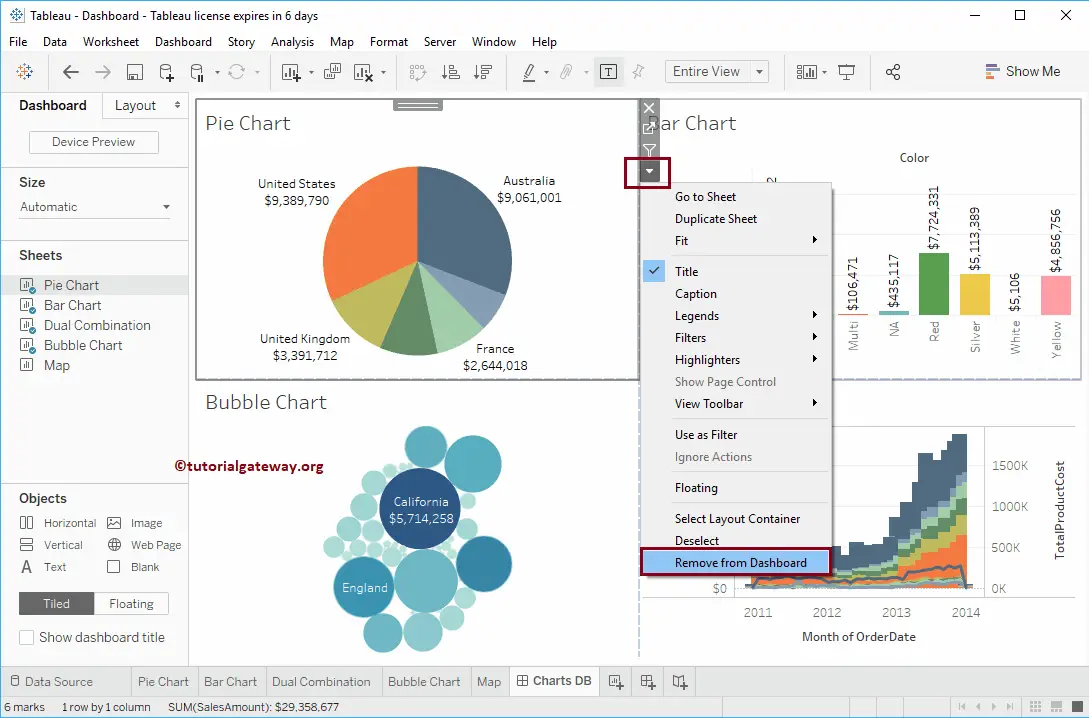
Either way, it will remove the selected one from it. As you can see, there is no Pie Chart. Please refer to the Filters in Dashboard article to use filters.
Format Tableau Dashboard Layout
This section covers how to format the Dashboard Layout with an example. For this, we are going to use the dashboard. To Format Dashboard Layout, we use one we created in our previous section.
Once you have created your dashboard (added required Sheets), you can use the layout tab to format those Sheets or Items per your requirements.
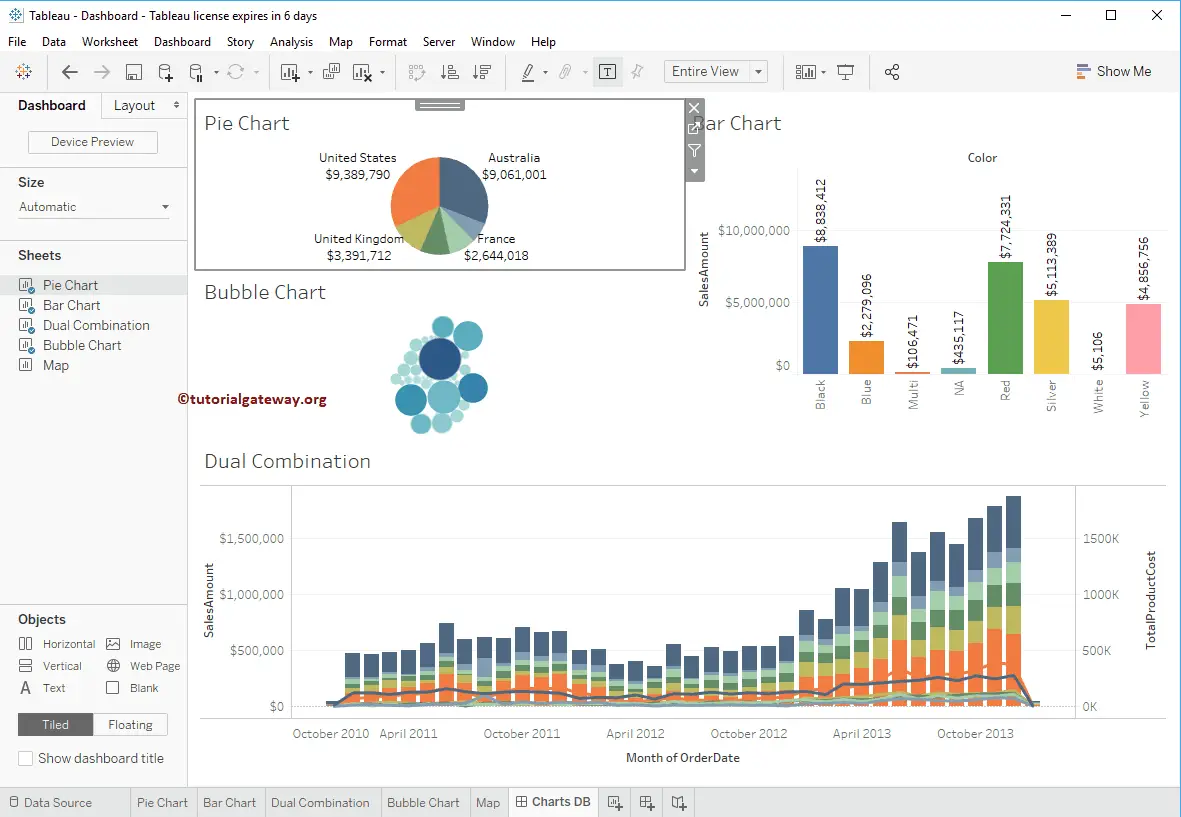
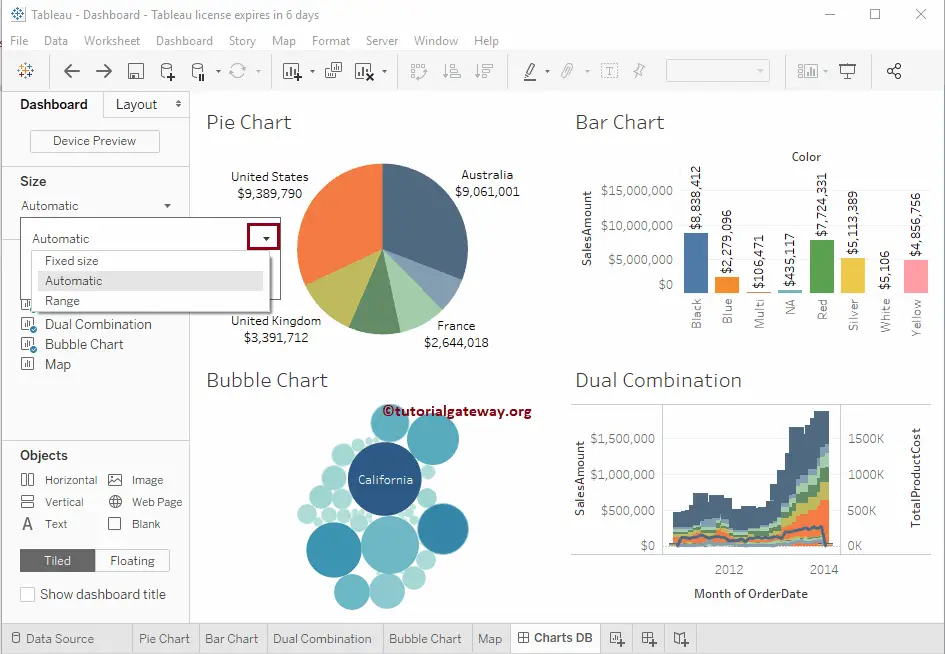
Change the Dashboard Display Size
By default, Fixed Size is selected by Tableau Dashboard, so we have to format or change it. Under the Size, you can change the size of a Dashboard as per your requirement. It can help design your dashboard based on the Size. The automatic option will adjust the Items as per the Screen size.
Under the fixed option, we have multiple options to select. Let me choose the laptop Browser for now.
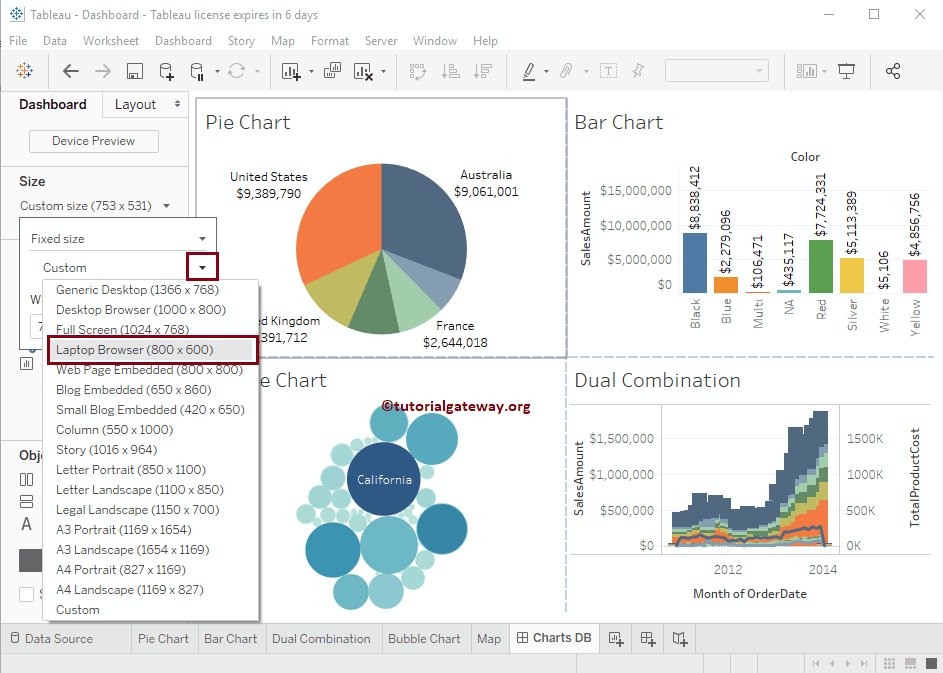
You can see that our dashboard work area has adjusted to the laptop’s Browser resolution.
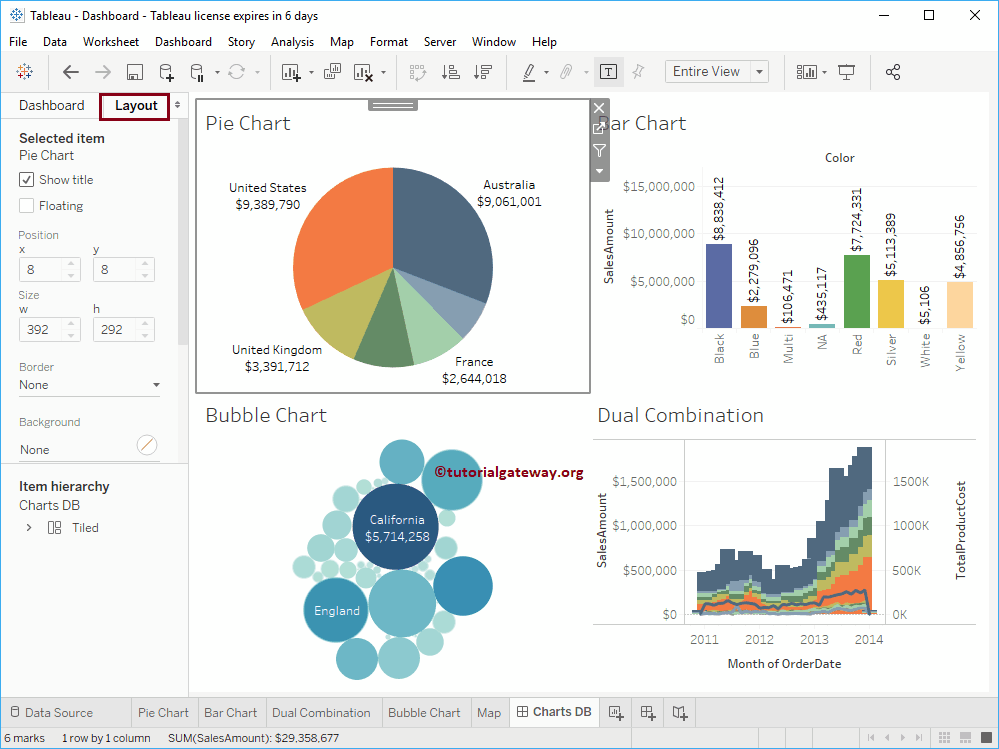
Format Tableau Dashboard Layout Items
The layout tab is used to format individual Items in a dashboard. To format the dashboard layout, you have to select a particular item. Checkmark Show Title to display the Item or Sheet Title; otherwise, uncheck Show Title
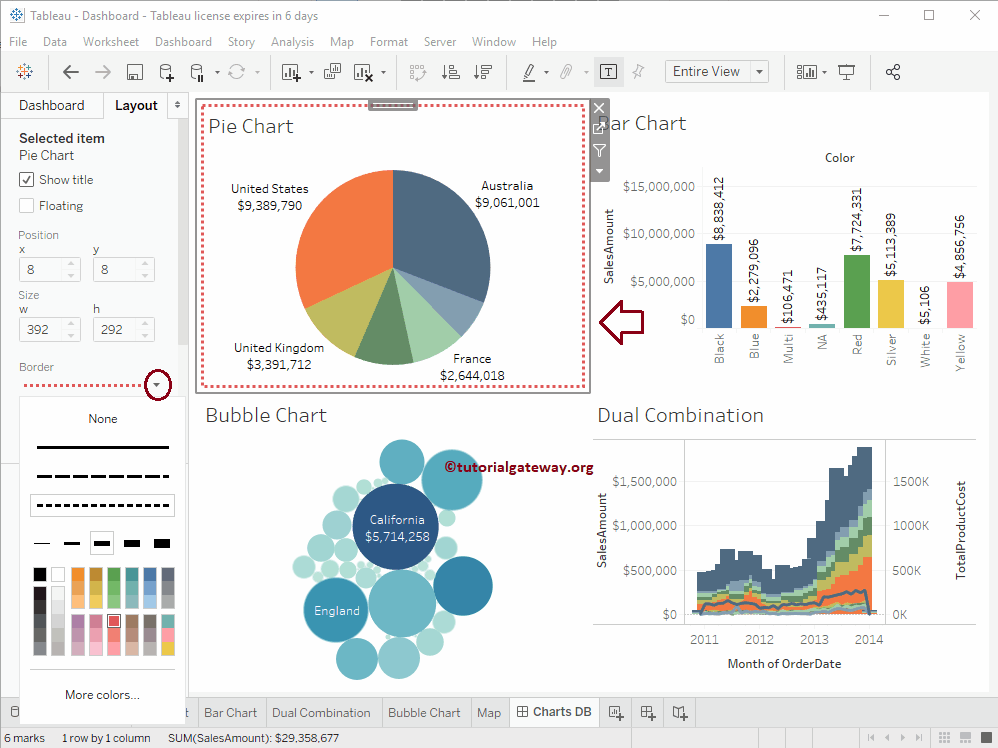
Format Dashboard Item Border
By default, there will be no Borders for any Item in a dashboard. To change the border of any item, select the sheet and change its border. See the Pie Chart with Red Colored Dotted Lines Border.
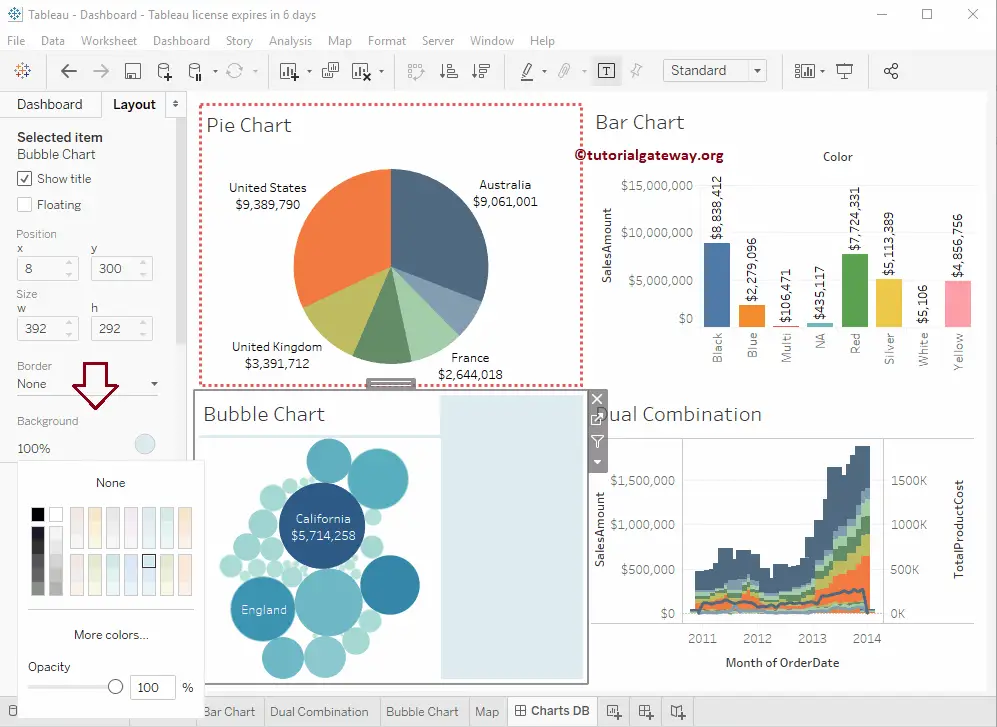
Change the Tableau Dashboard Item Background Color
By default, the Background of any Item in a dashboard is None. To change any item’s background, select the sheet and change its background. See the Bubble chart with a Light Sky Blue background.
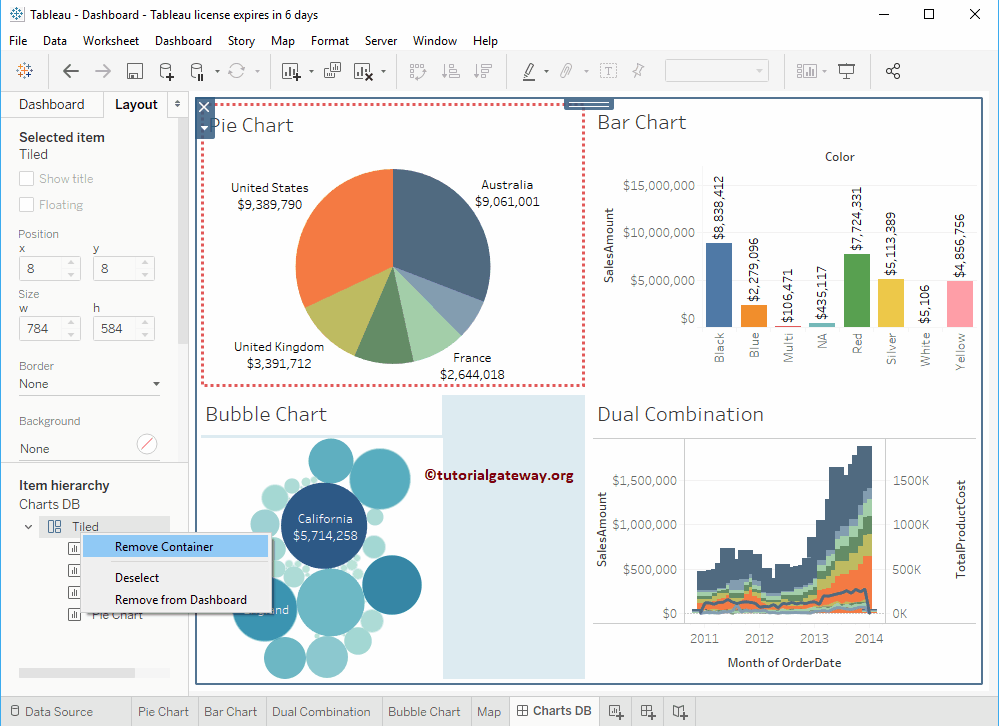
Format Dashboard Item Hierarchy
You can see the Item hierarchy here. You can edit, remove, or even delete them from it. To remove everything from it, right-click on the Tiled and select Remove Container.
This will ask you to delete the Container and the Items (Sheets or Charts) present inside the Container. Please confirm the deletion process by clicking the Delete button. To cancel the same, please click the Cancel button in the pop-up message window.
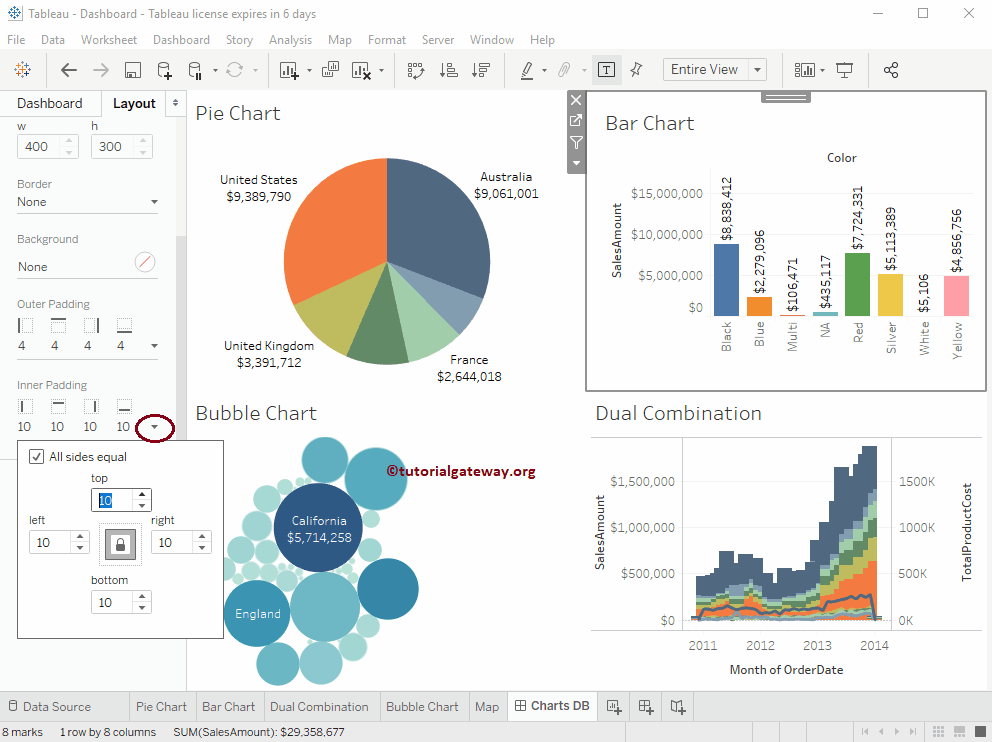
Format Dashboard Item Inner Padding
You can change the Space inside an Item by changing the Inner padding settings of the Tableau Dashboard. To do so, please select the Sheet and change its padding.
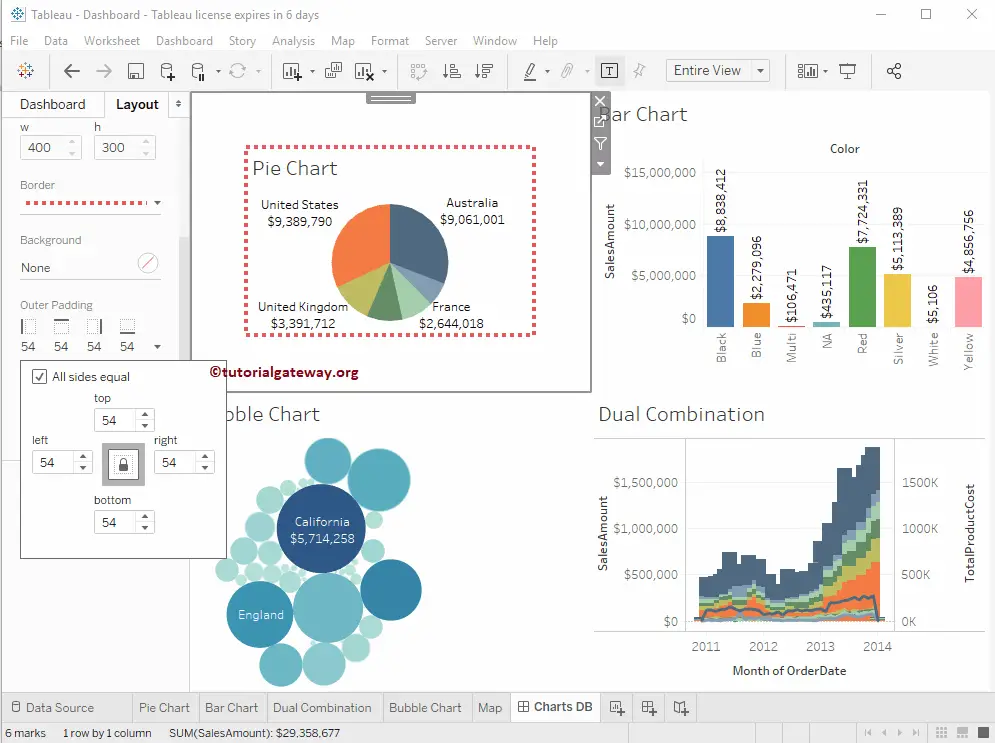
Format Tableau Dashboard Item Outer Padding
You can change the Space Outside a Dashboard Item by changing the Outer Padding settings. For this, select the Sheet and change its Outer padding. Here, change the top, left, right, and bottom of the Outer padding and add a Border to the chart.
I think you don’t understand the Change because it provides empty space, and you may not notice it in the image. Let me add Borders to the Pie Chart and change the padding. Now, see the space outside the Pie Chart because we changed the Outer padding to 54 on all sides.
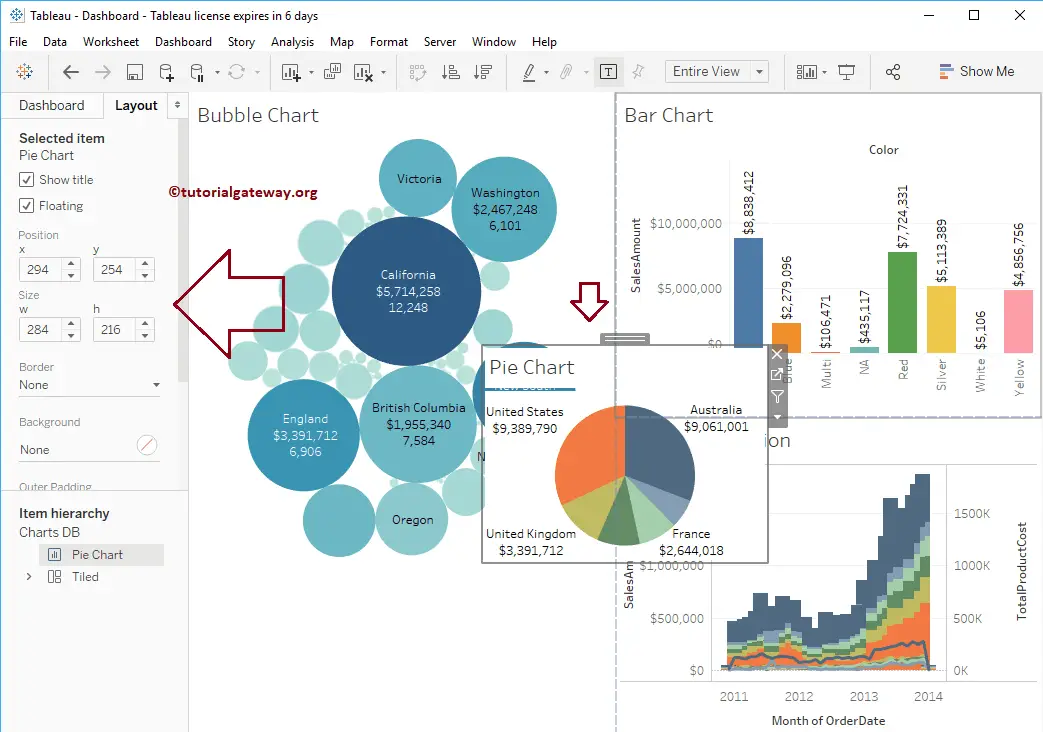
Use the Dashboard layout to float the Item
By check-marking the Format dashboard layout Floating property, you can float one item on top of another. We used this property on the Pie Chart. You can use Position (x, y) or Size (w, h) to adjust the position and size or use your mouse.
Create a Tableau Dashboard Device Preview
The Device Preview button on the left side of a Dashboard will help you to create different dashboard views for Mobile Phones, tablets, and desktops. Click on the Device Preview button to see them.
You can see the Device Preview option on the Top of the Dashboard. Use this button to change the View from Landscape to Portrait and vice versa.
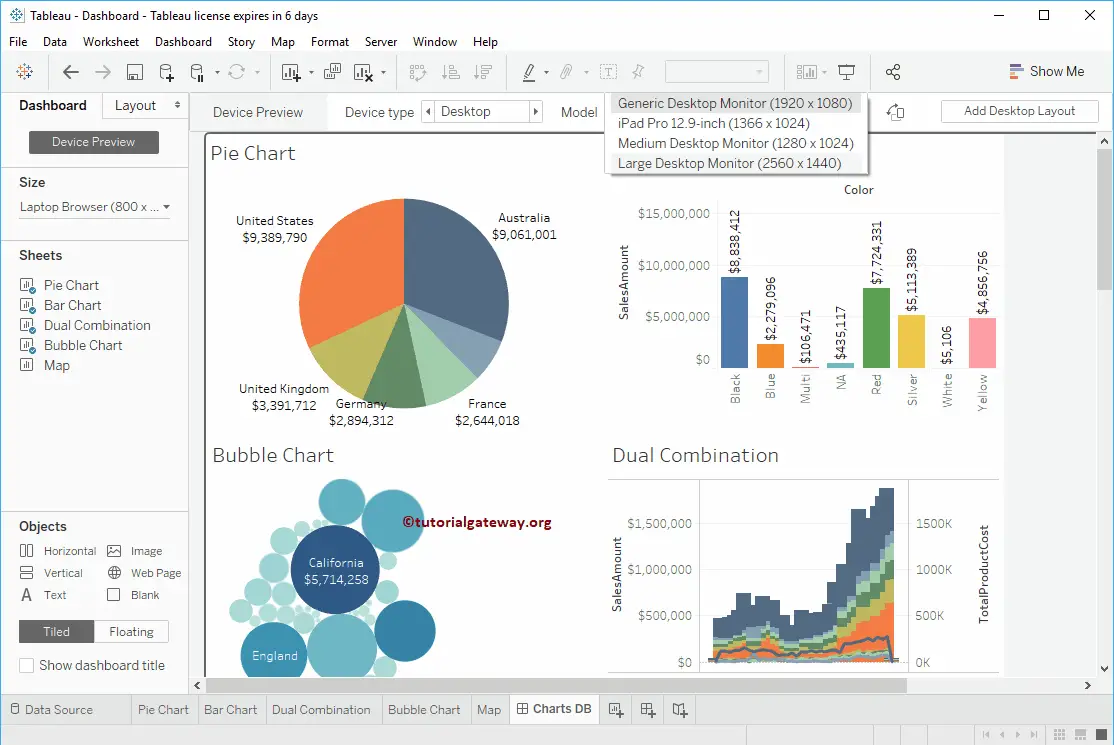
In the Device type settings, there are three options, and they are Desktop, Tablet, and Phone. By default, it chooses the Desktop. However, you can change it from the list of available views under the Device Type (< >).
Create a Desktop Preview of a Tableau Dashboard
Please select the Device type as Desktop. You can see the list of available Desktop models under the Model drop-down list. Let me choose the Generic Desktop Monitor. Next, click on the Add Desktop Layout button to add the layout for the selected Model.
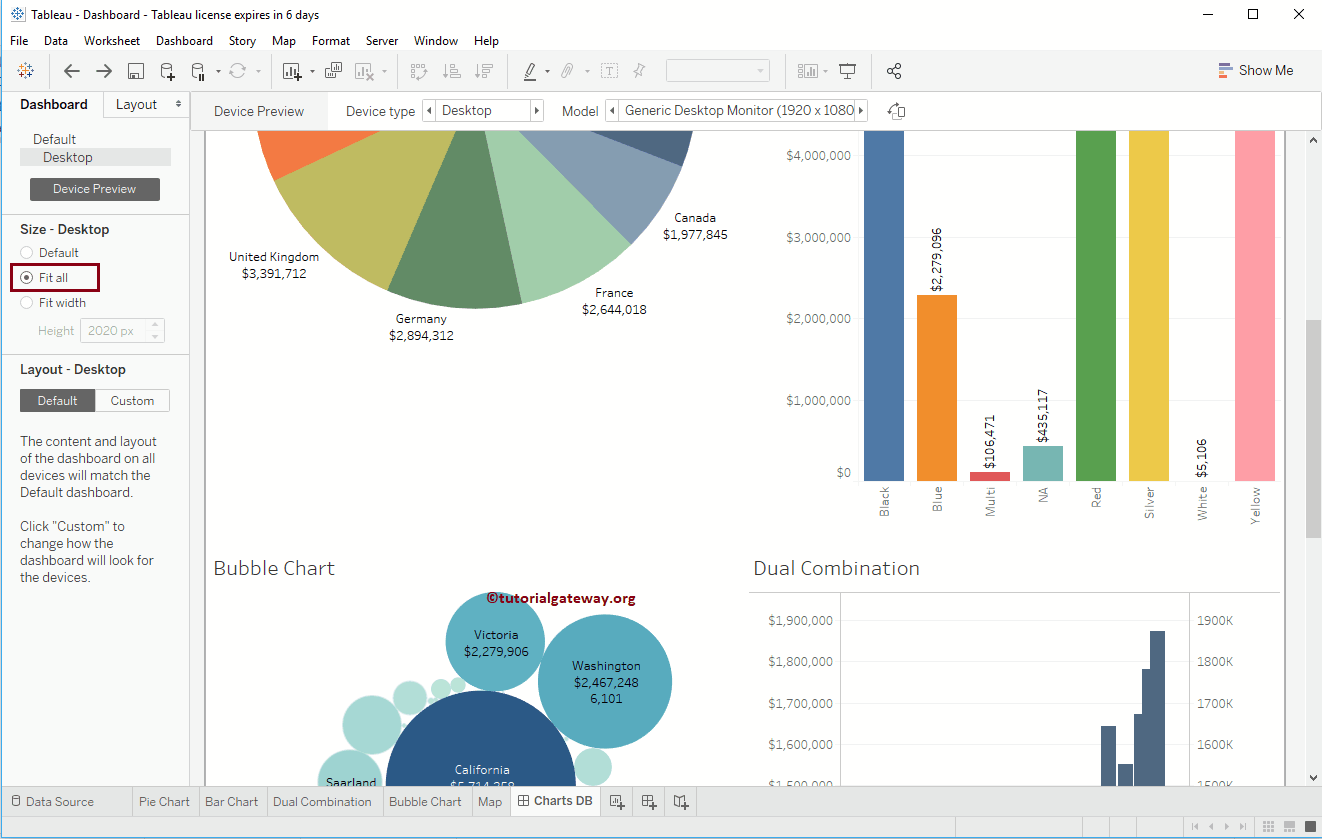
We selected the Size of a Desktop to fit all.
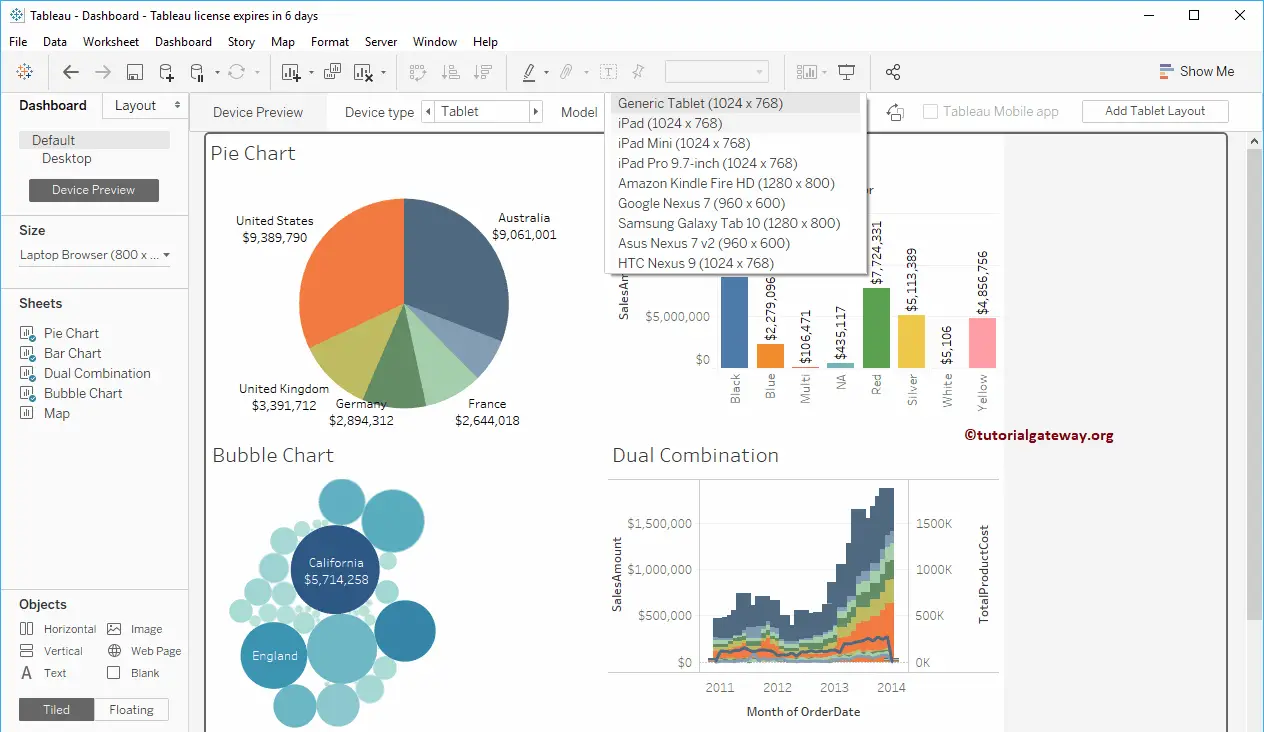
Create a Tablet Preview of a Tableau Dashboard
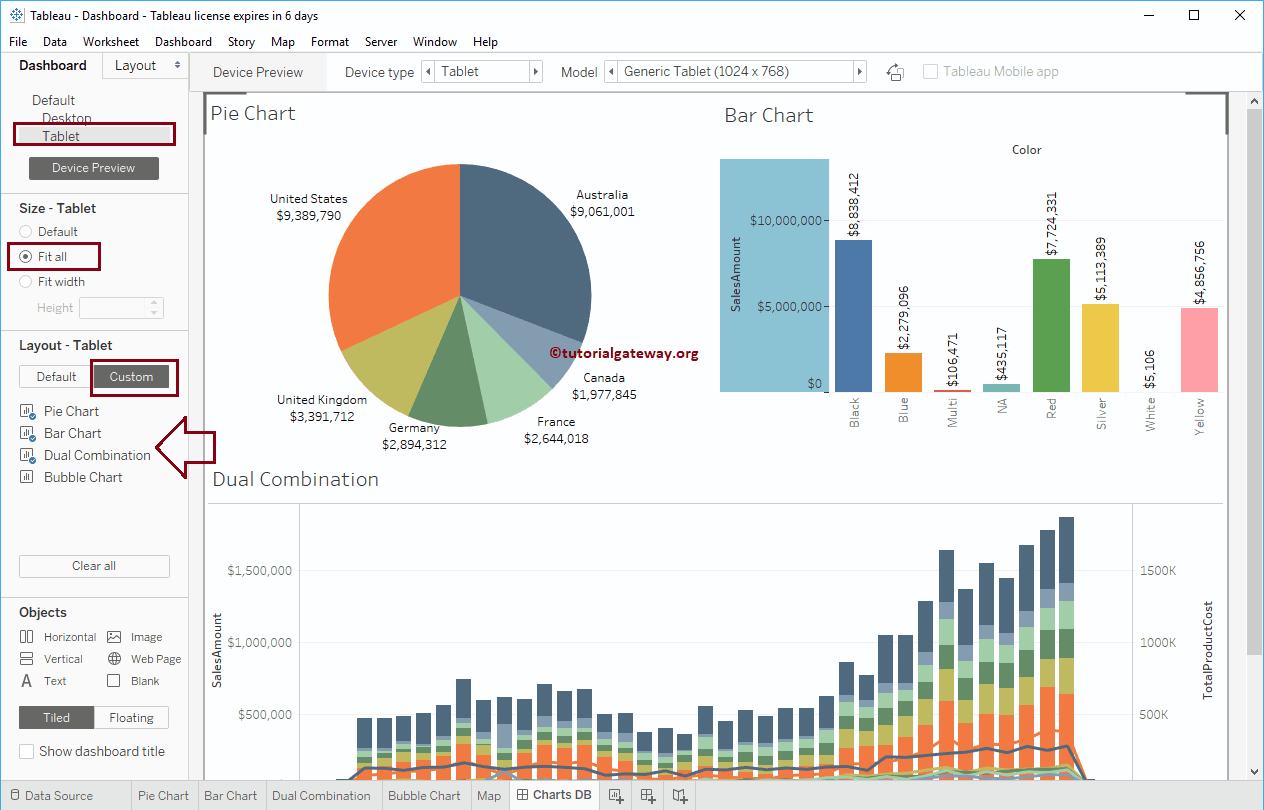
Please select the Device type as Tablet. You can see the list of available tablet models under the Model drop-down list. Let me choose the Generic Tablet. Next,
Please select the Device type as Tablet. You can see the list of available tablet models under the Model drop-down list. Let me choose the Generic Tablet. Next, click on the Add Tablet Layout button to add the Tablet device layout preview for your Dashboard.
We removed the Bubble Chart from the Dashboard to fit the tablet Width. It means that when you select the dashboard on a Tablet, you can only see the Pie Chart, Bar Chart, and Dual Combination Chart.
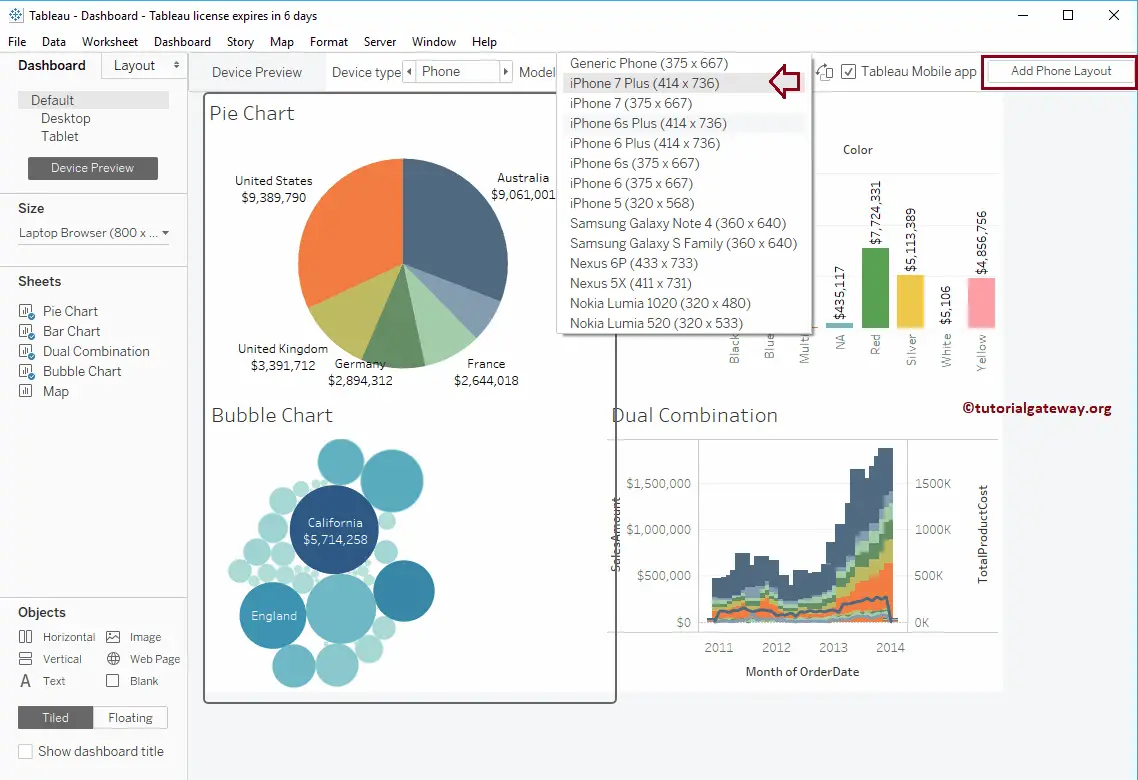
Create a Phone Device Preview of a Tableau Dashboard
Please select the Device type as Phone. You can see the available Mobile Phone models list under the Model drop-down list. Let me choose the iPhone 7 Plus and click the Add Phone Layout button. You can see the boundaries of the Mobile phone screen.
To fit the Mobile Phone screen, we removed the Bubble Chart and Dual Combination Chart from the Dashboard. It means that when you select the dashboard in Mobile Phone, you can only see the Pie Chart and Bar Chart.
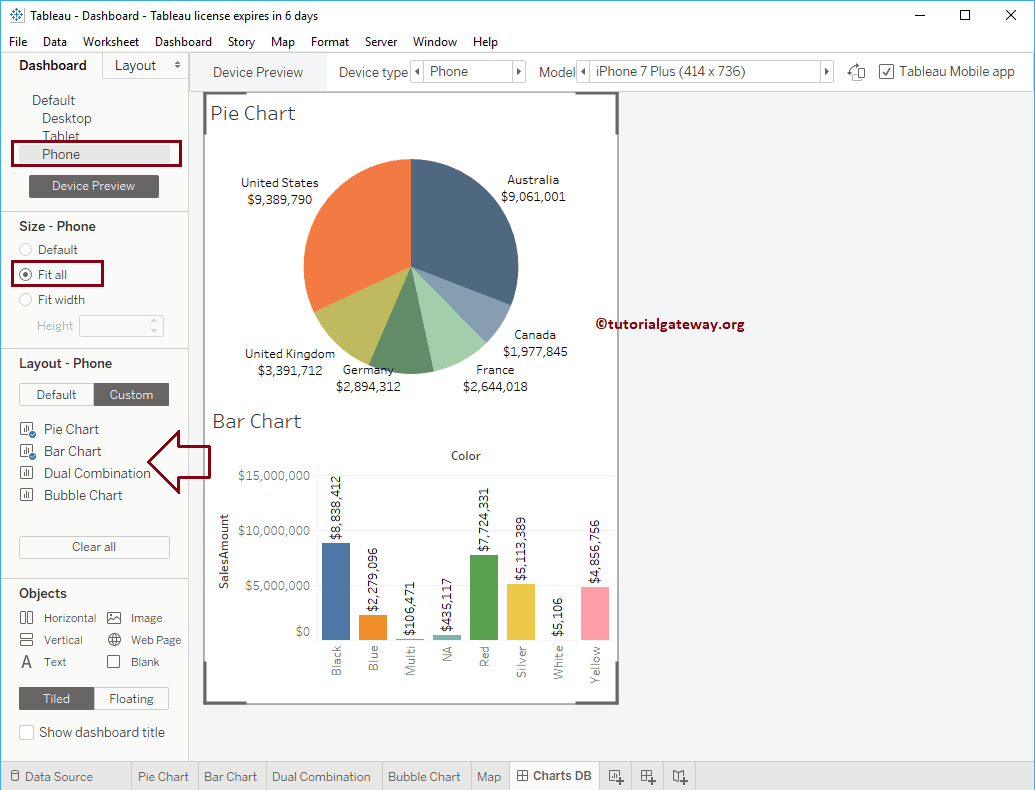
Please change the Model to the Samsung Galaxy S family to check the screen. Once you have finished creating the Device previews, click on the Device Preview button to go back to the normal display.
Comments are closed.