Tableau sort is the process of arranging or ordering the data in Ascending Order or Descending Order. For example, when we show products by region report, it would be helpful and practical to show the products in any manner.
In this article, we will show you how to perform sorting in Tableau reports with examples. We will use the report we created in our previous article for this demo.
Tableau Sorting Data from Axis
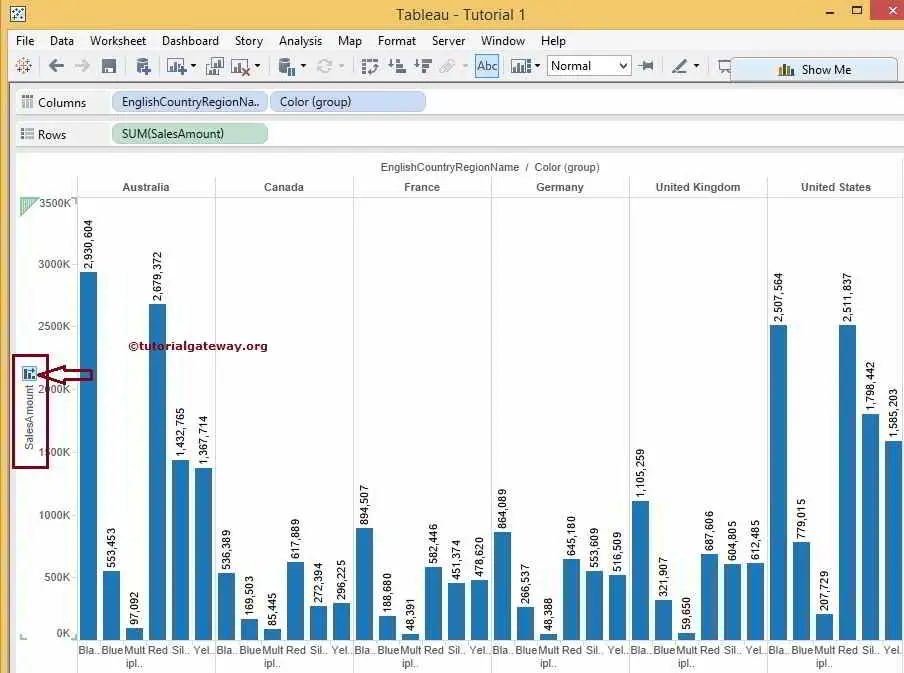
There are multiple ways to perform sorting. From the screenshot below, you can observe that a tiny little button will display near that when you hover over the Sales Amount.
This button can sort the Sales Amount data in ascending or descending order. For now, we selected the Tableau Sort in Ascending Order.
Once you click that button, Color (group) data will be sorted by its sales amount in Ascending Order. Visit Data Labels in Reports to understand the Tableau Data Source.
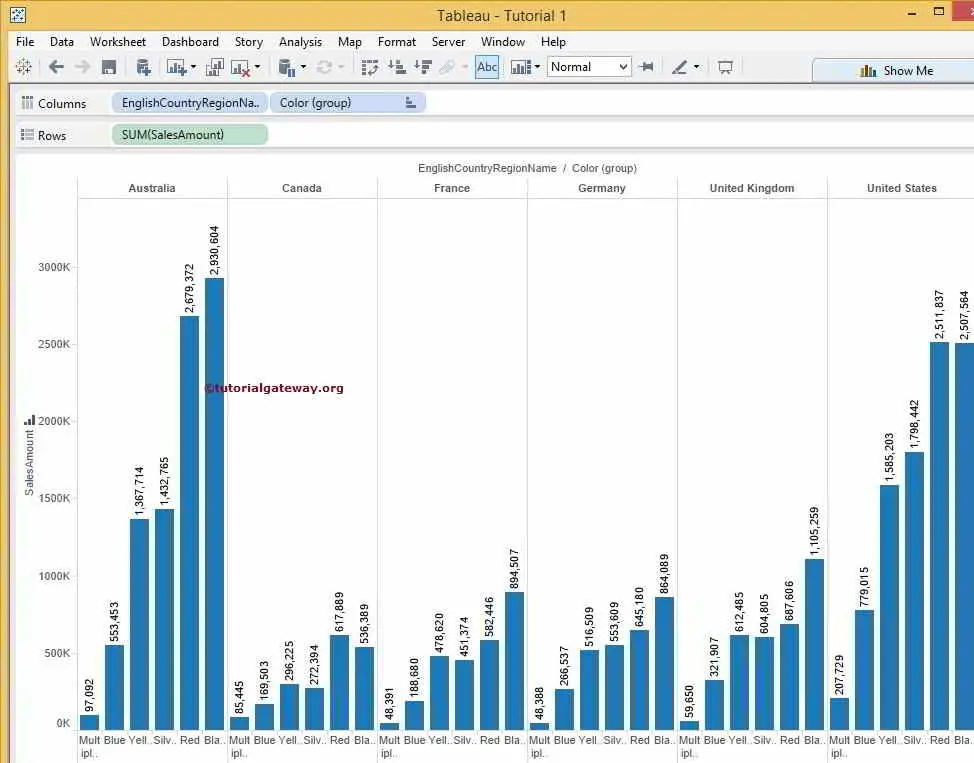
Tableau Sorting Data ASC and DESC using Toolbar
In the second method, click the Sort button in the toolbar. As you can see, when you hover over the button, it will show the tooltip saying that it will order the data by Color (group) in Ascending by SalesAmount.
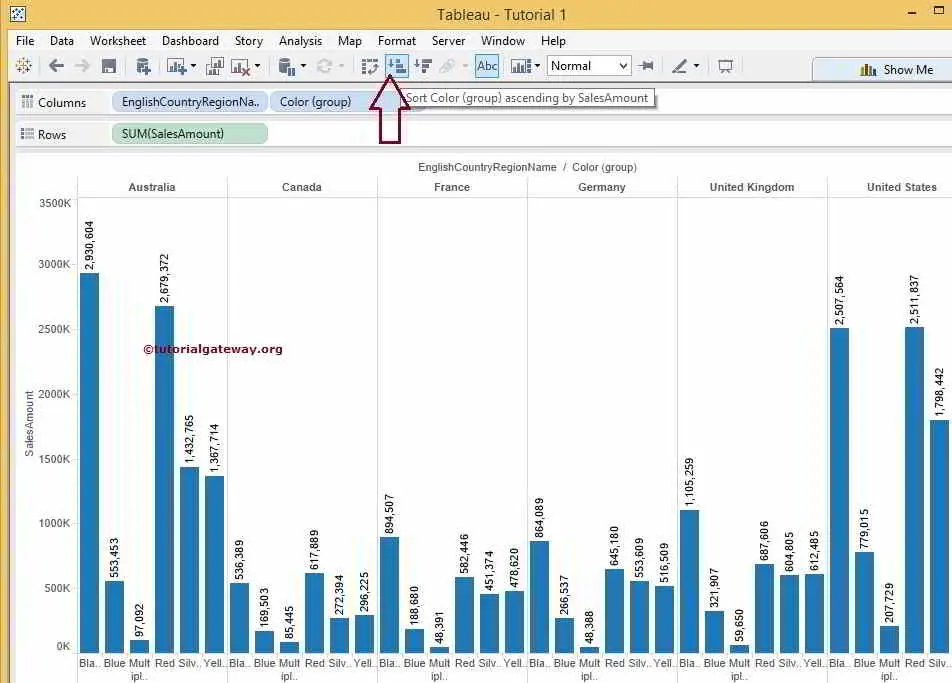
Once you click the button, Color (group) data will be ordered by its sales amount in ascending. For the Descending order, click the next sort button in the toolbar.
The screenshot below shows that when you hover over it, the desktop shows the tooltip saying that it will sort the data by Color (group) in descending order by its sales amount.
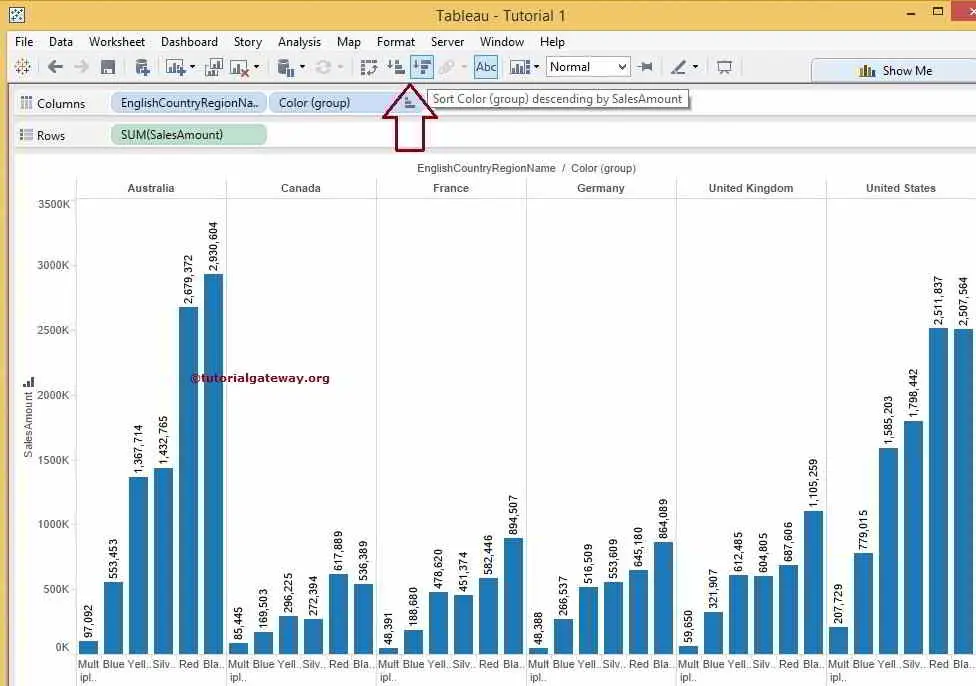
Once you click the button, Color (group) data will be ordered by its sales amount in descending, as shown below.
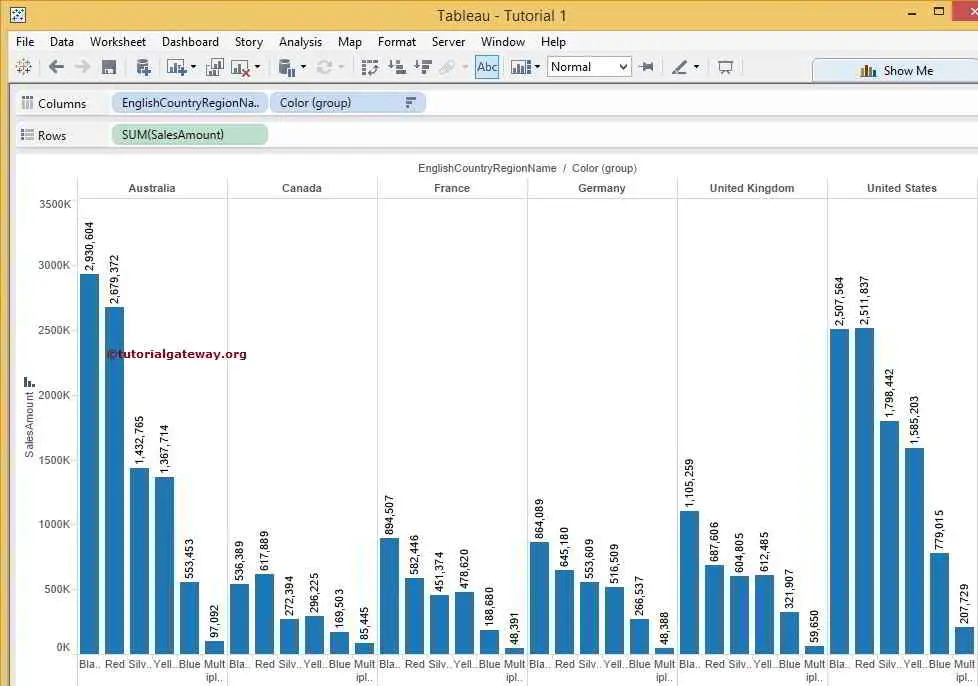
Tableau sort Data from Columns or Rows Shelf
From the row Shelf, select and right-click on the Dimension on which you want to perform the sort. Please select the Sort.. option from the context menu. Here, we have chosen the Color(group)
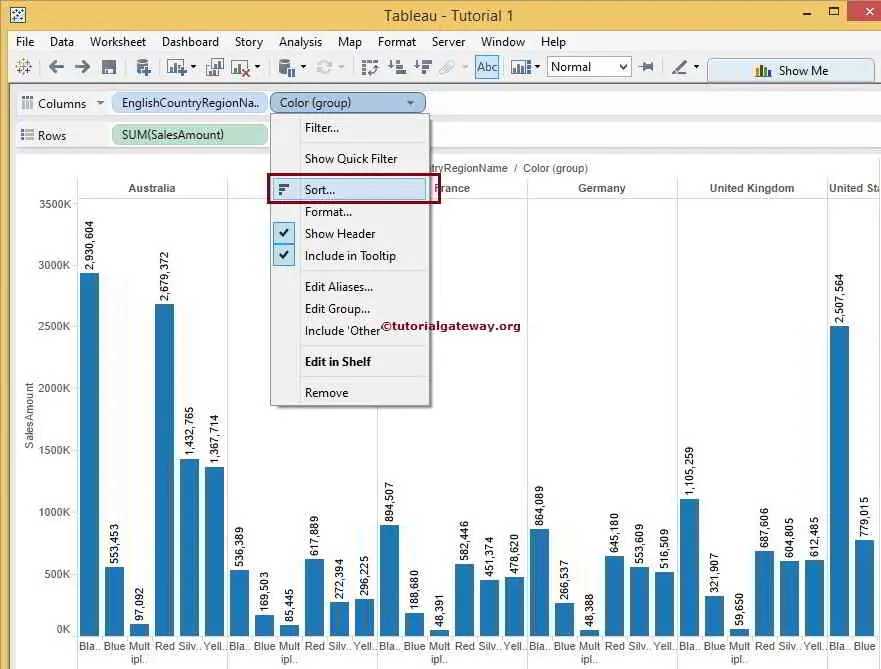
Once you click on the option, a new window will open to configure the Tableau sorting options. By default, data will be in the order specified in the data source. That’s the reason why, by default, the Ascending sort order and Sort by Data source order were preselected. However, we can change this using the options specified in this section.
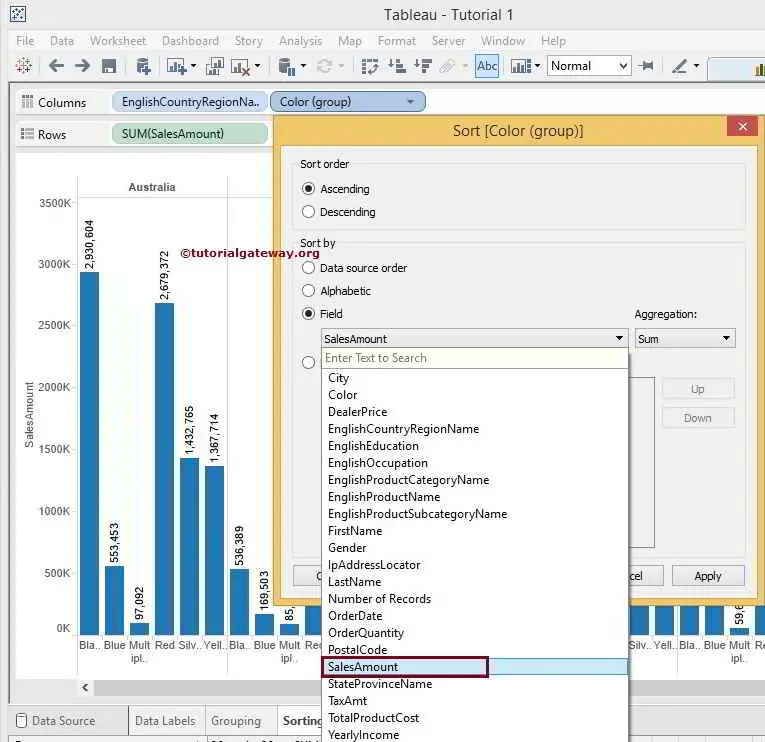
Sort by field
If you select Sort by Field, you must choose the field name from the drop-down list. Remember, if you are viewing Sales amount data in a report, you should select the same field here. Otherwise, the results may look strange.
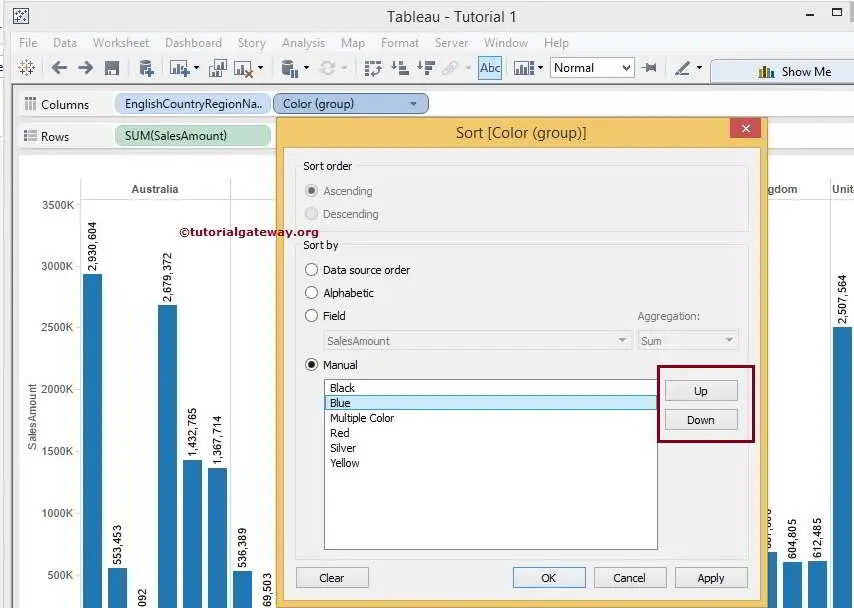
Sort by Manual
If you choose the Tableau Sort by option Manual, we can manually change the data order using the Up and Down buttons.
For now, we selected the Sort By option as “Field” and selected the Sum of the Sales Amount in descending. Once you click the OK button, sort the Color (group) data and order by its sales amount in descending order.
Until now, it looks easy to implement. We are performing Tableau sort operations on Color (group), which is lying inside the English Country Region Name. Let’s see what will happen if we perform on the Country column.
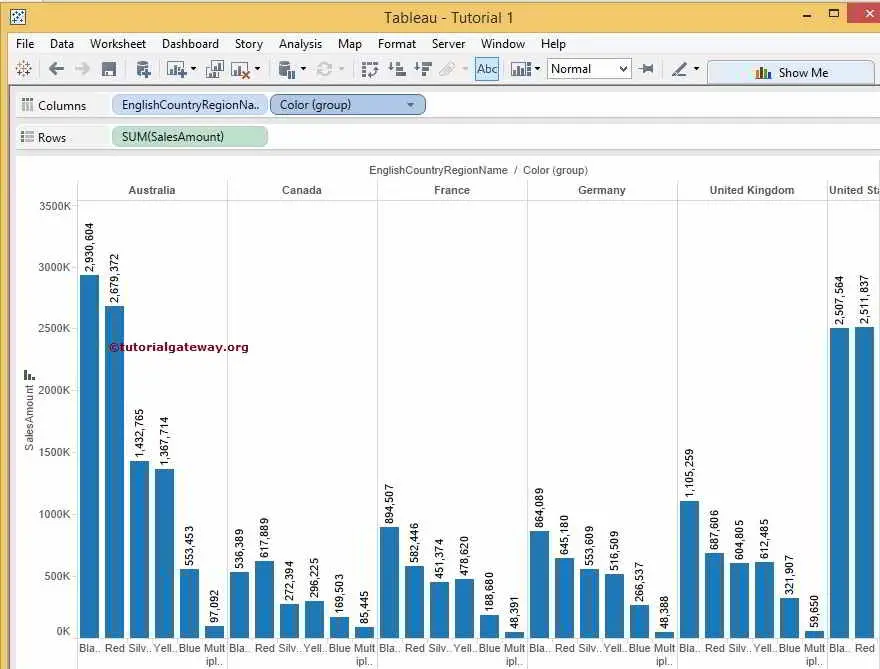
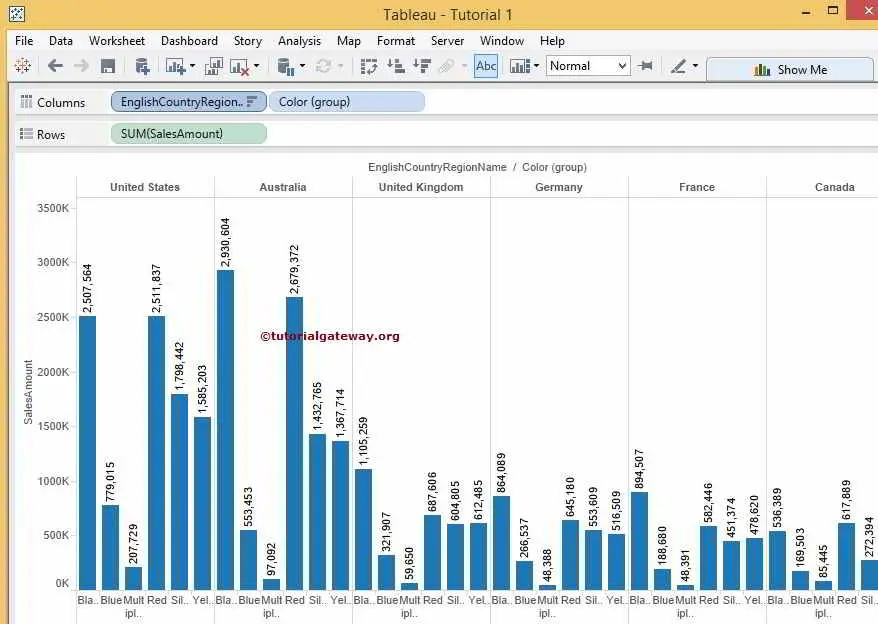
Select and right-click on the English Country Region name Dimension and select the Sort.. option from the context menu. Please follow the same steps as mentioned for the color(group). Here also, we have chosen the option as the sort Field and selected Sales Amount in descending order.
Once you click the OK button, you may be surprised by the outcome. If you observe the screenshot below, the Country is ordered by their sales amount in descending order. But you can’t identify it. If you look closely, the United States is in first place, and the United Kingdom is in 3rd place.
To understand sorting better, let’s remove the color (group) from the Columns cards and see the result.
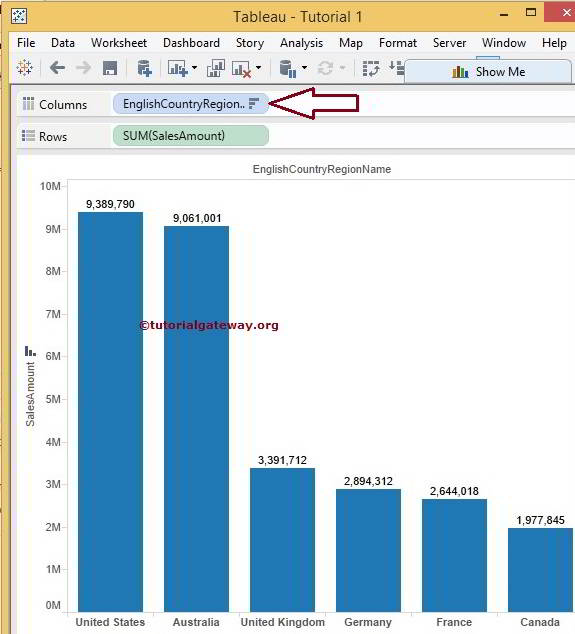
Tableau Sort Data by String Parameter
Apart from the above options, you can also sort the report using multiple measures with the help of the parameter and the calculated field. For this, we use the same bar chart without any predefined sorting.
Click the down arrow beside the search box and choose the Create a new Parameter option. Please change the data type to string and list the allowable values. Next, type the measure names (Column names) you want to use as the sorting field. Remember, the string parameter name should exactly match the column name.

Click the down arrow beside the Sorting List and select the Show Parameter option to see them. To make the string parameter work in the Tableau Sorting Data report, we must write an expression; for this, we need a calculated field. So, click the Down arrow beside the search bar and choose Create Calculated Field.
The expression below uses the parameter name as the source, and if its value is some text, match that with the actual measure. The text within the ” is the parameter value, and the text within the [] is the actual measure value.
CASE [Sorting List]
WHEN "Sales Amount" THEN [Sales Amount]
WHEN "Order Quantity" THEN [Order Quantity]
WHEN "Profit" THEN [Profit]
WHEN "Total Product Cost" THEN [Total Product Cost]
END
Right-click on the EnglishCountryRegionName Dimension and select the Sort.. option to open the window below. Instead of selecting any existing columns, let me choose the newly created calculated field. It means the calculated field will act as the sorting field in descending order.

Let me add the remaining measures: Order Quantity, Profit, and Total Product Cost to the report labels to see the output.
As the Sales Amount is the default Tableau string parameter value, the countries in the bar chart have been sorted by sales in descending order.

Let me change the Parameter value to the Order Quantity and see the report.
