Tableau Data Blending is very useful for joining or combining records from two data sources. For example, If you want to generate a report using multiple or different data sources, then we can use this Data Blending technique to join them. For this Tableau data blending demo, we use the sheets present in the Excel Worksheet and SQL Server.
Tableau Data Blending Example
To perform Tableau Data Blending or combining, we need at least one common dimension in both sources. It doesn’t matter whether it is an integer or a string. To demonstrate Data Blending, we connected to the primary data source Employees.xlsx workbook, and added the secondary data source called Employee List sheet to the region.
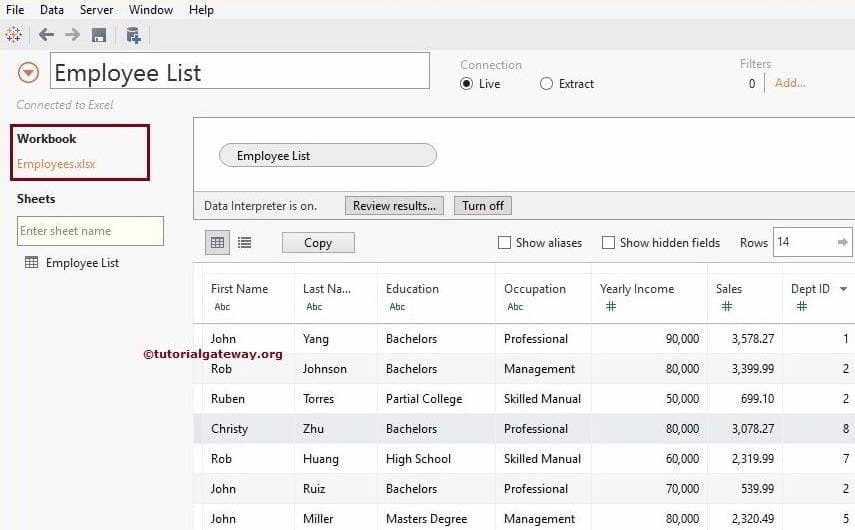
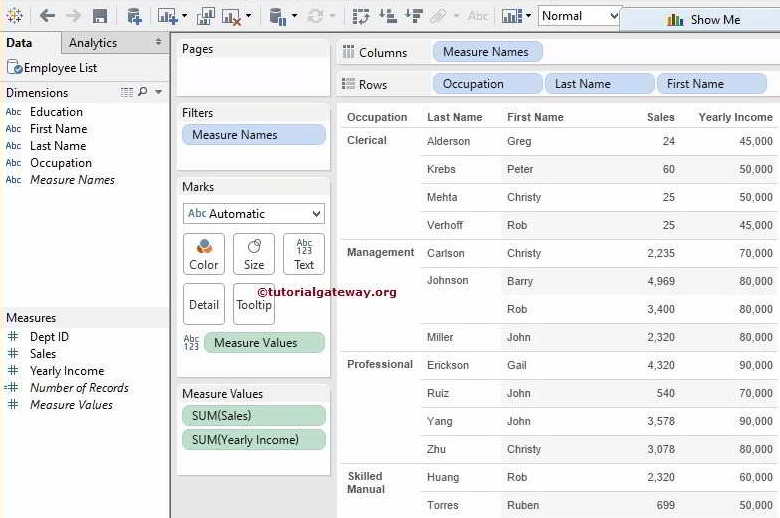
In this Tableau Data Blending example, We are required to create a table report with the employee’s first name, last name, occupation, Sales, and yearly income.
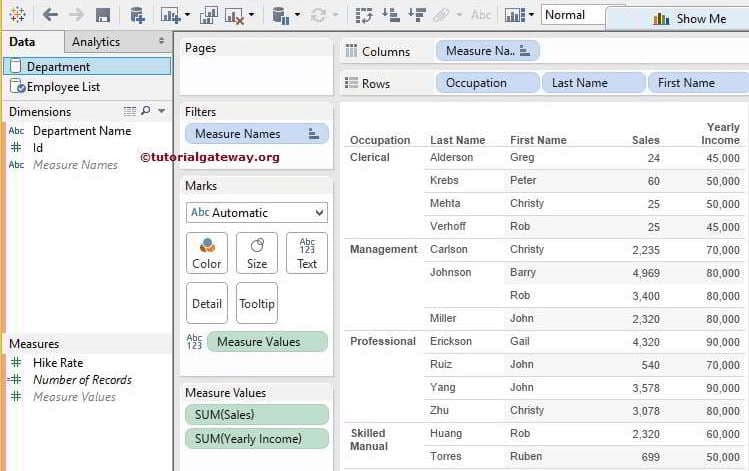
So, we created a simple table report with Occupation, Last name, and First name on the Rows shelf, Sales Amount, and Yearly income on the columns shelf. Let us see the report preview.
Please refer to Connecting to Excel Files and Connecting to Server in Tableau.
Scenario: Suddenly, the Client changed the requirements and asked us to add department and Salary Hike percentage details for every Employee. Here the real obstacle is the department, and Salary Hike percentage columns are present in the Master SQL Server database.
It means we have to combine a few columns from the primary data source, the Local Excel Sheet, the records from the secondary data source, and a few others from SQL Database. It is what we call Tableau Data Blending.
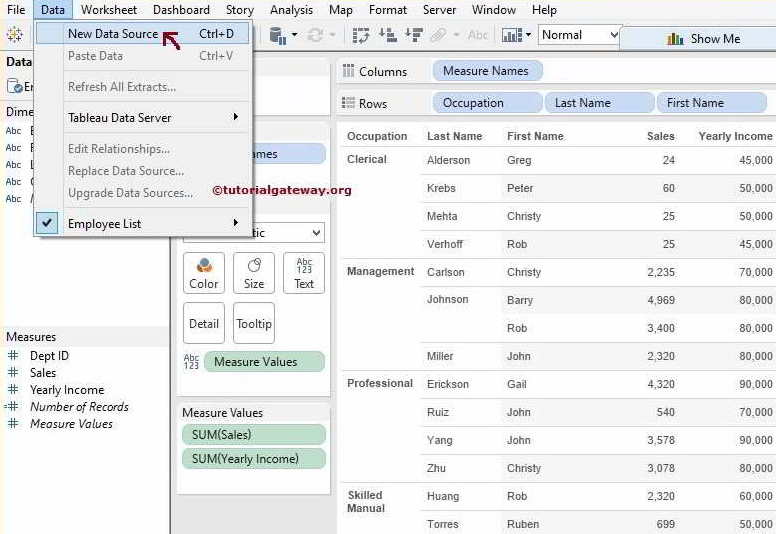
To do the Tableau blending of primary and secondary or multiple data sources, Please navigate to the Data menu. Next, select the New Data Source option from the Menu or click on the Cylinder symbol.
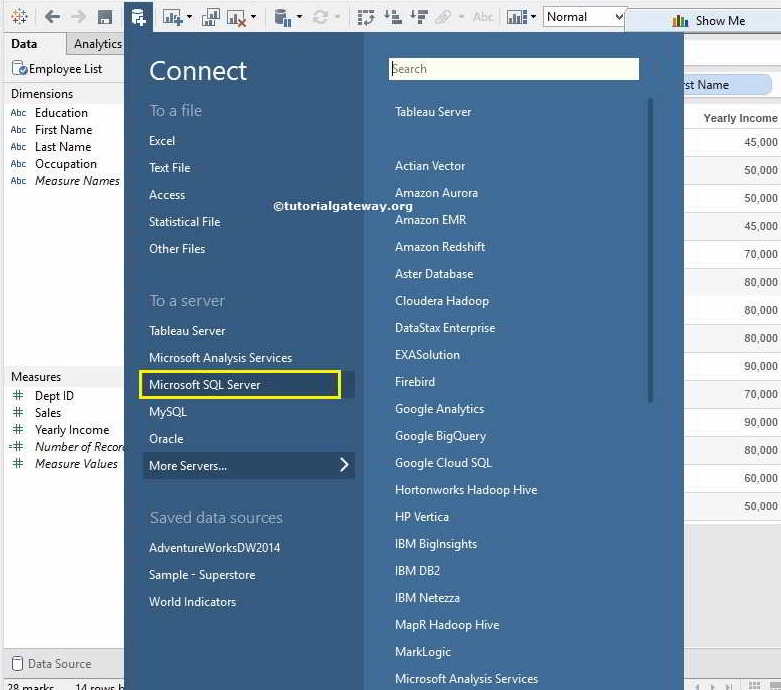
A.fter you choose the option, the below-shown window will appear to Connect. Here, we have to connect with SQL, so select Microsoft SQL Server.
We picked the Department table from the Database for the Tableau Data Blending.
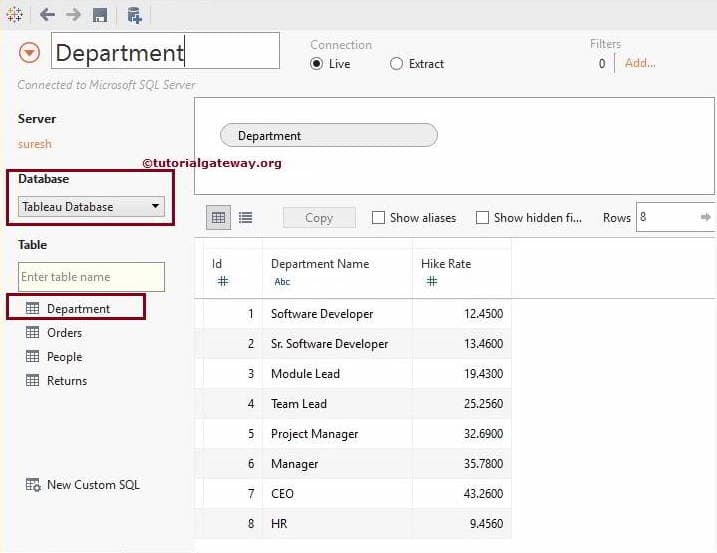
The newly added data source (SQL) Department table comes from the secondary data sources.
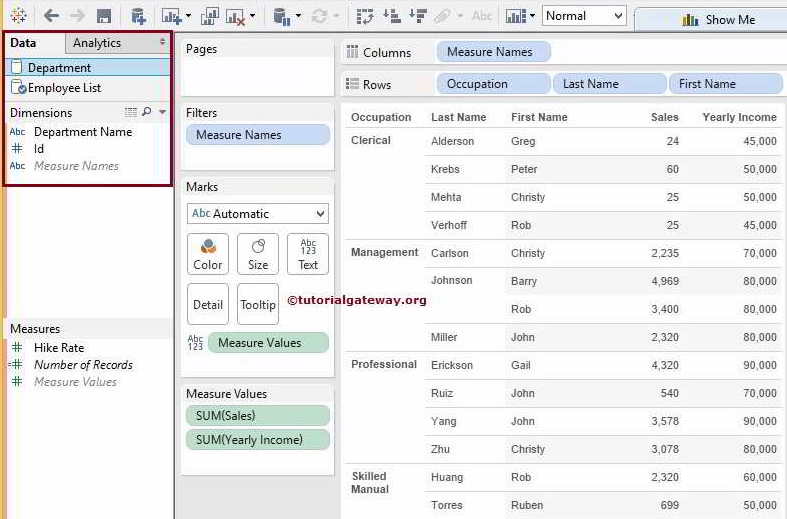
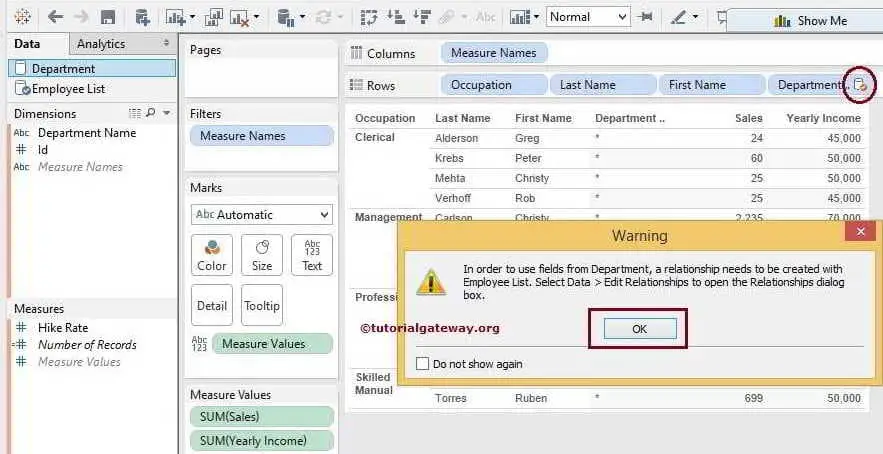
Let us add the Department name to the Rows Card. As you see that the desktop is displaying a little orange tick mark at the department name. It is also displaying a warning message.
If you read the warning message, it is a pretty straightforward message, saying there is no relation between Employees and departments. A relationship is significant to performing data blending in Tableau. Please add the connection.
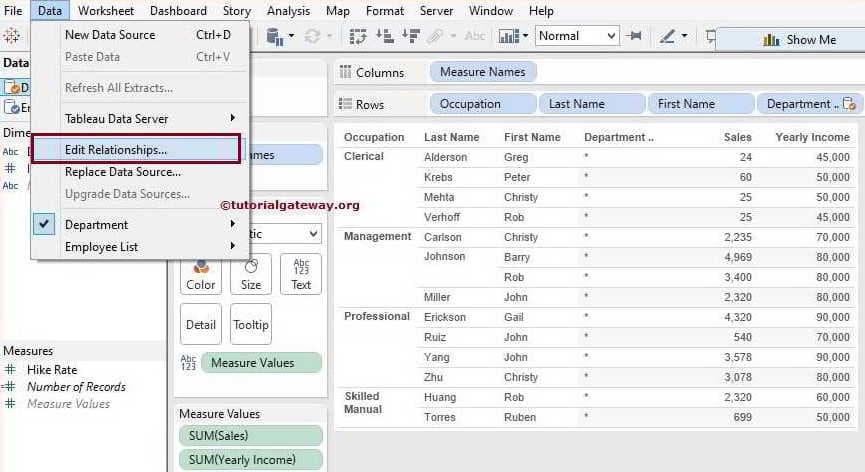
To add a relationship, Go to the data menu and select the Edit Relationships.. option.
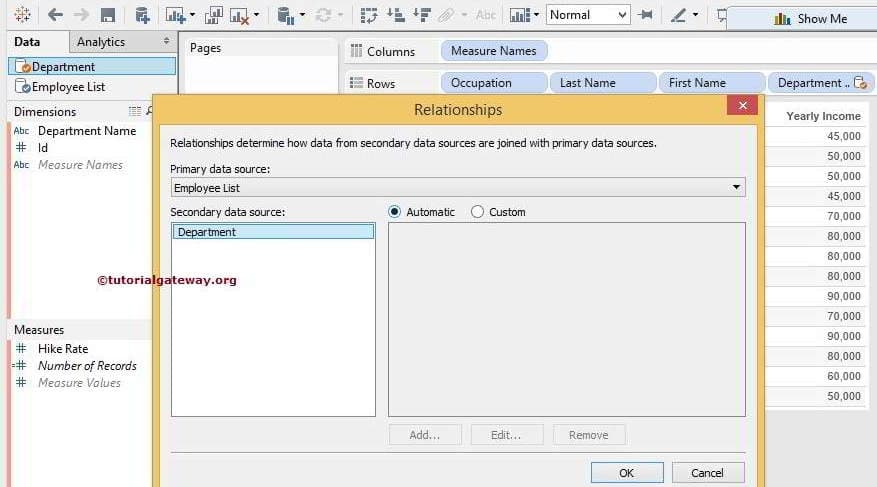
Once you choose the Edit Relationships.. option, a new Relationships window will open. The following are the available options for Tableau Data Blending.
- Primary Data Source: From which we first dragged the fields (Dimension or Measure) into the report region called a Primary data source. The desktop will display a little Blue tick mark beside this one.
- Secondary Data Source: This is not primary. It shows a small orange tick mark beside the secondary data source.
- Automatic: If there are any common dimension names in both data sources, the desktop automatically detects the possible relationship between those two fields.
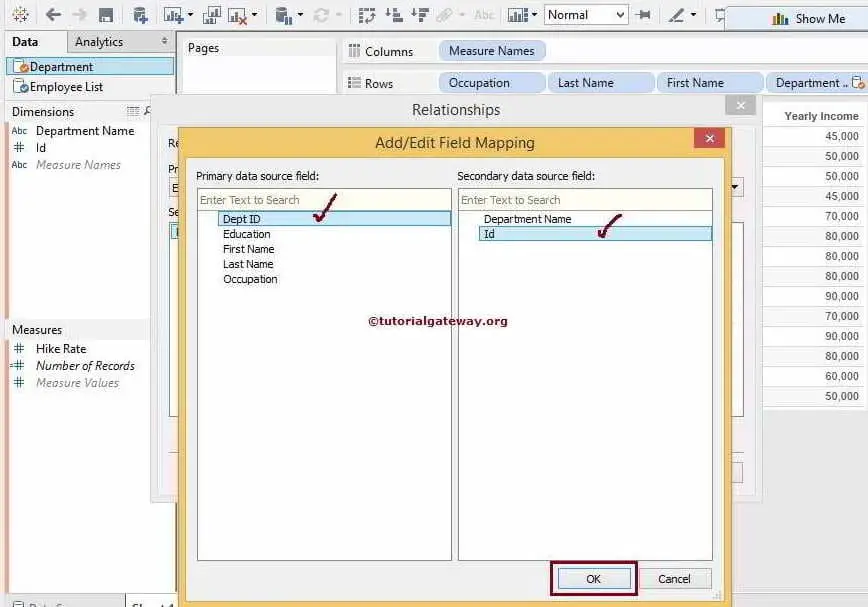
- Custom: If there are no common Field names in the primary and secondary data sources, We have to select the Custom option. And then add the relationship between them. For now, we are choosing this option
Dept ID in the Employee table and Id in the Department table are the key columns. We will use them for this Tableau Data Blending on Employee and Department table.
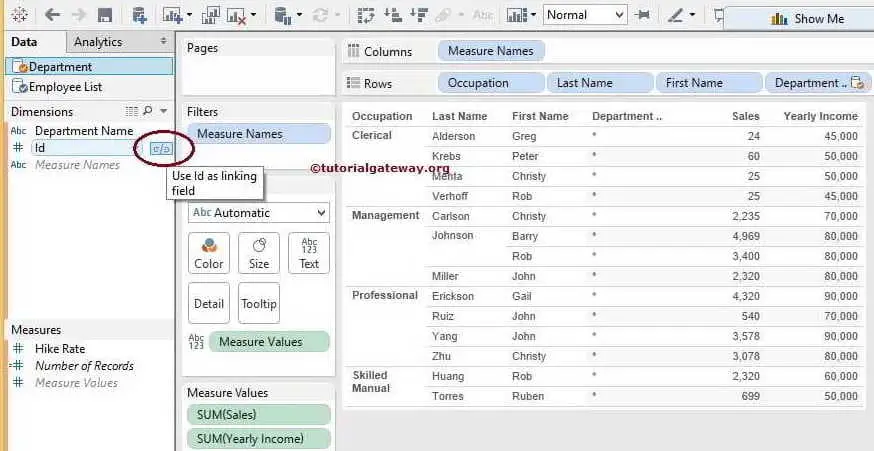
Once you specify the relationship, a tiny URL link will appear beside the Id column. From the below screenshot, when you hover on that link, Use Id as the linking field tooltip is displaying. Click the link button to enable Data blending in Tableau.
When you click the link button, the link button color will change to orange color, and our Department column is displaying records. Remember, If there are no matching records in the Department, then Null values will show.
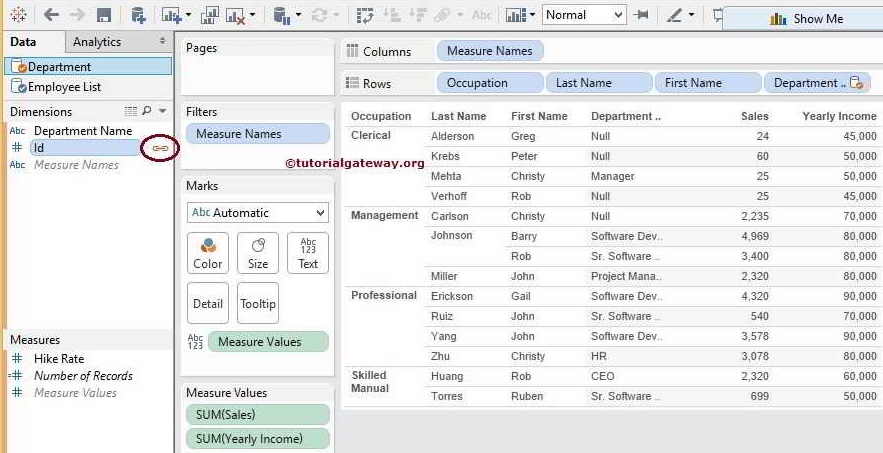
Let us add a Hike Rate measure to complete our client requirements.
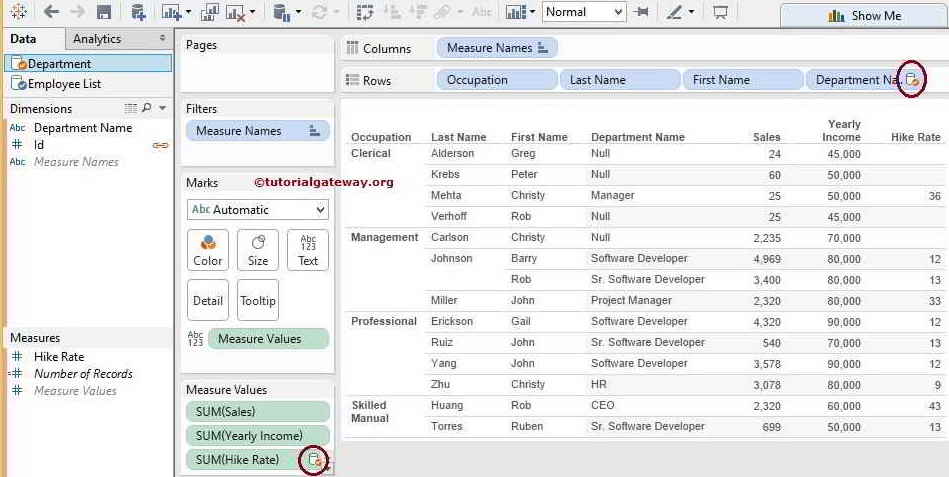
Tableau Data Blending using Aliases Column
The second approach is simple and straightforward. So instead of creating custom relationships between Id and Dept ID columns, let’s give a chance to this desktop intelligence.
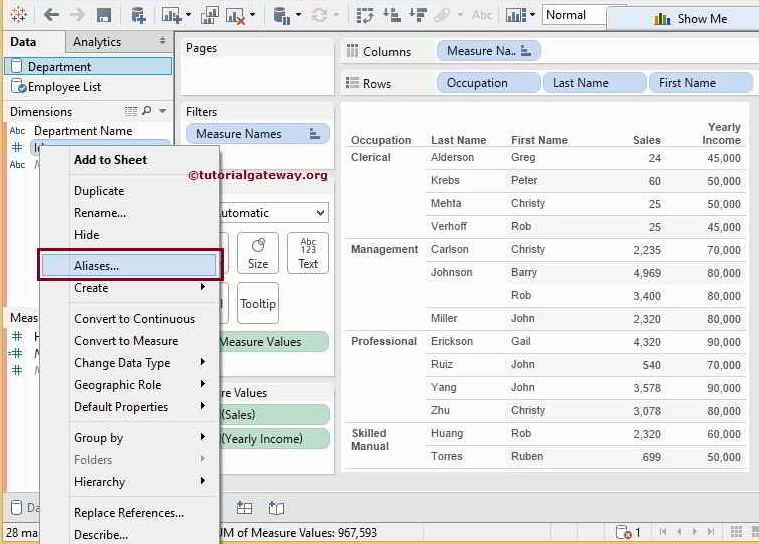
To do this, Please select and right-click on the Id column. Next, choose the Aliases.. option from it.
Once you decide on the Aliases.. option, a new window will open to renaming the field. Let us change the Id Column to Dept ID.
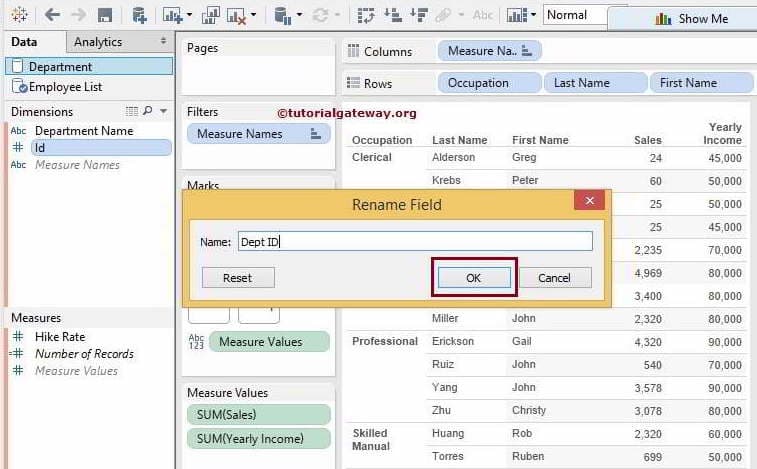
Once you click the OK button, it will automatically detect the relationship between Dept ID in Employee and Dept ID in the Department table. It means you don’t have to create a relationship on your own.
You can observe that a tiny URL link will appear beside the Dept ID column. Click the link button to enable Tableau Data Blending.
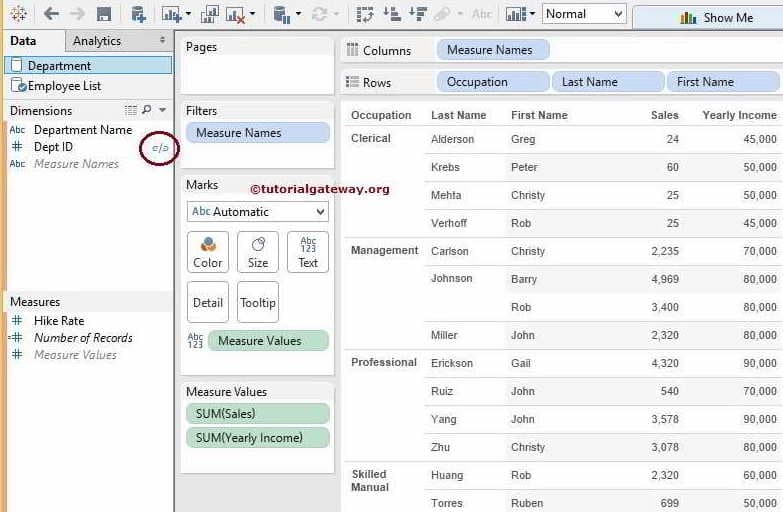
Once you click on the link button, the link button color will change to Orange color.
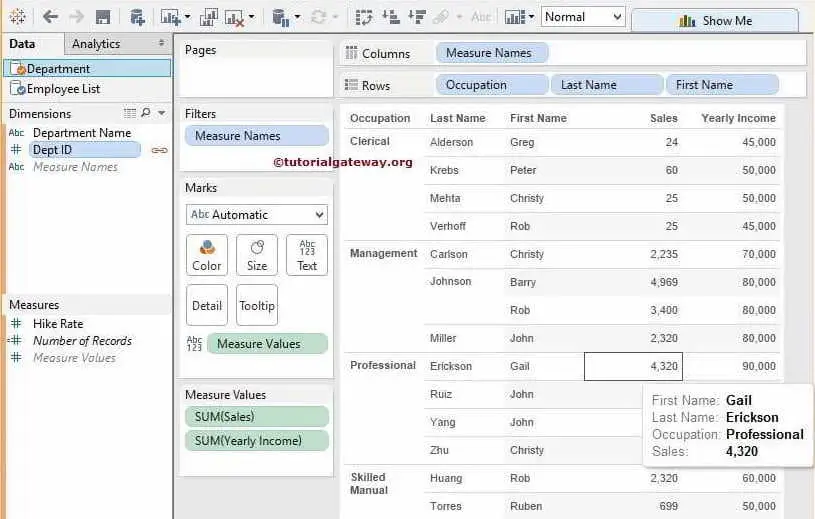
Let us add Department Name and Hike Rate to finish the business requirement.
Remove or Edit Tableau Relationships
We show you how to remove relationships that we created in the Tableau data blending process. First, please navigate to the Data menu and select the Edit Relationships.. option.
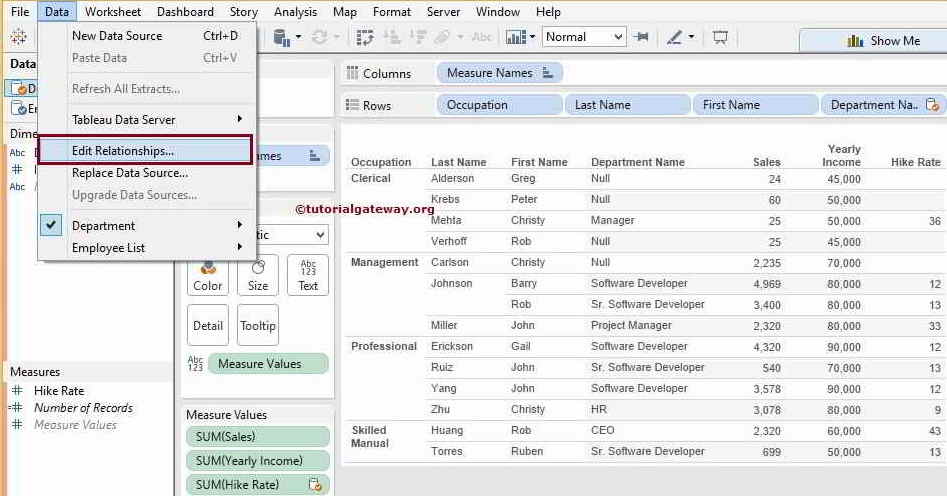
Once you select Edit Relationships.. option, a new Relationships window will open. Please choose the Relationship you want to remove and click the Remove button. For example, in this Tableau Data Blending example, we have only one relationship between Dept ID and Id, so we selected and removed it.
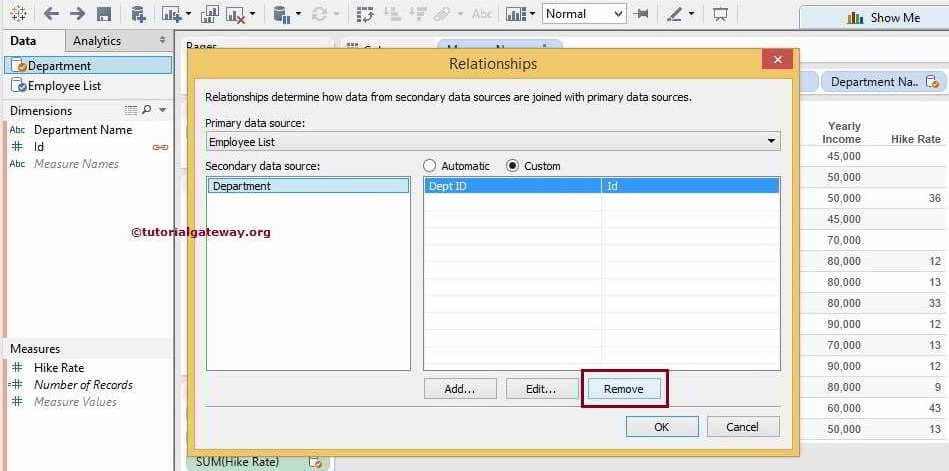
The following warning message is displayed because we use Department Name and Hike Rate in the report.
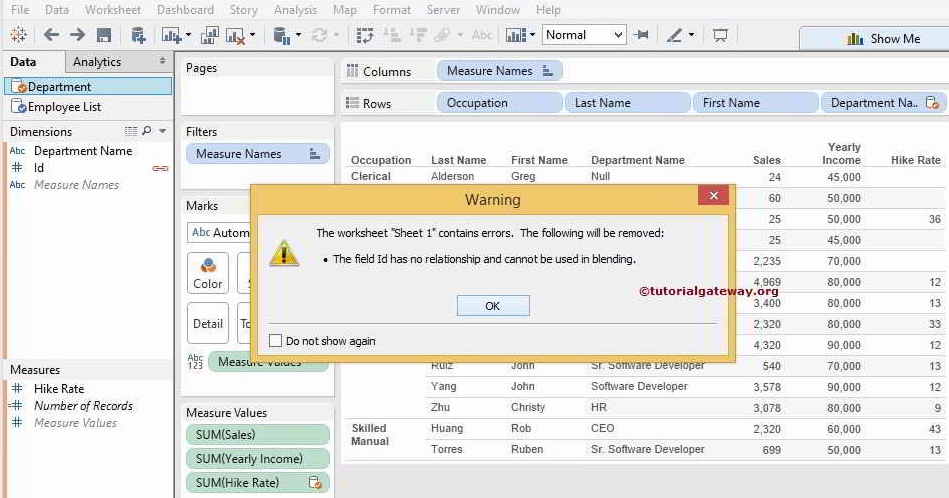
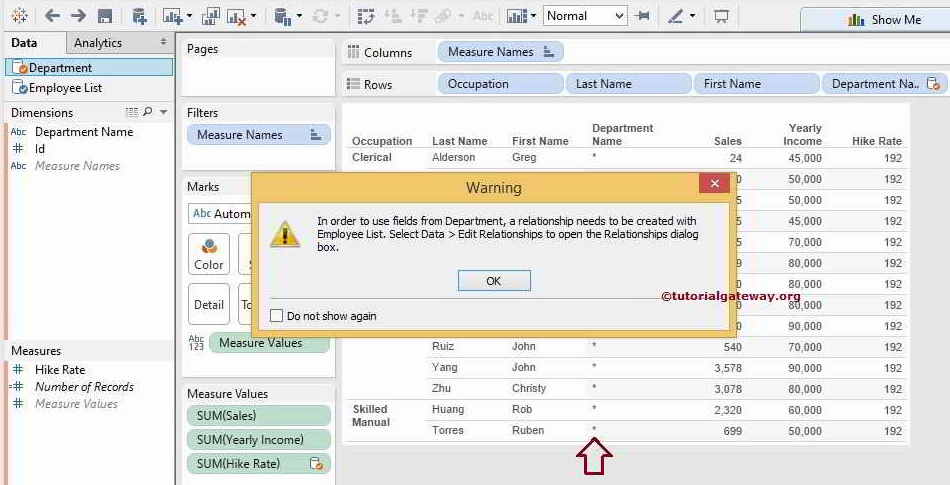
Next, One more warning message that we have seen before. Once you click the OK button, the Tiny URL link will remove beside the Id column.
We successfully removed the relationship required for Tableau Data Blending.

Comments are closed.