In this article, we will show you the steps involved in connecting Tableau to the SQL Server. Besides, learn how to use the data present in SQL Tables as a Tableau Data Source with an example.
Steps involved in connecting Tableau to SQL Server
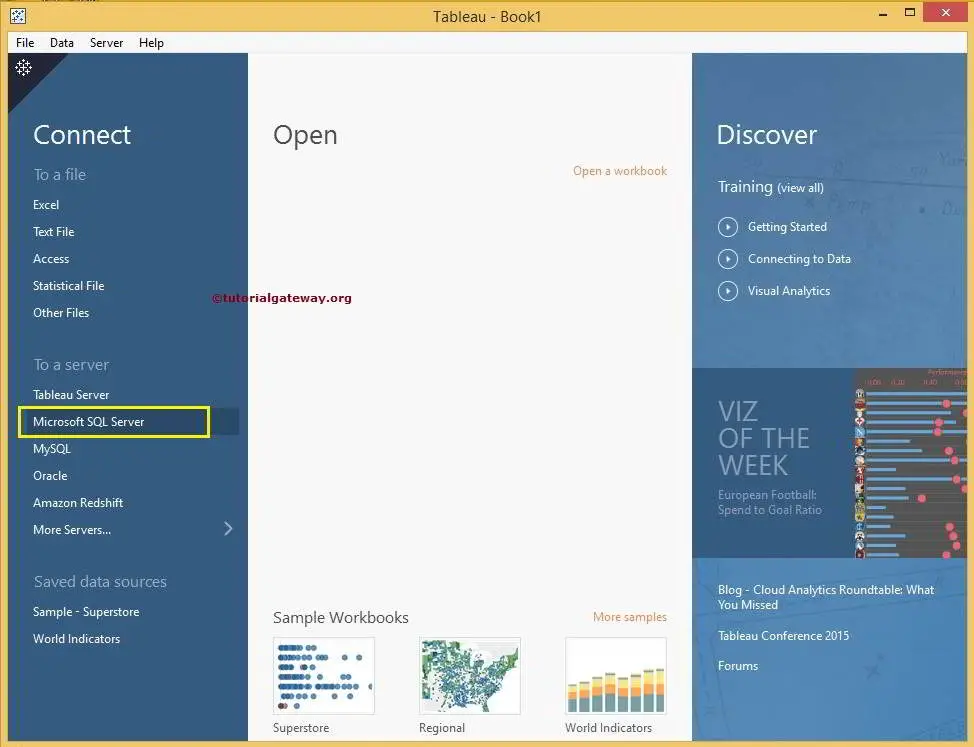
If you have not started the software yet, double-click on the desktop to open it. Once it is open, it looks like the screenshot below.
To connect Tableau, first, select the Microsoft SQL Server Option under the Connect to a Server section.
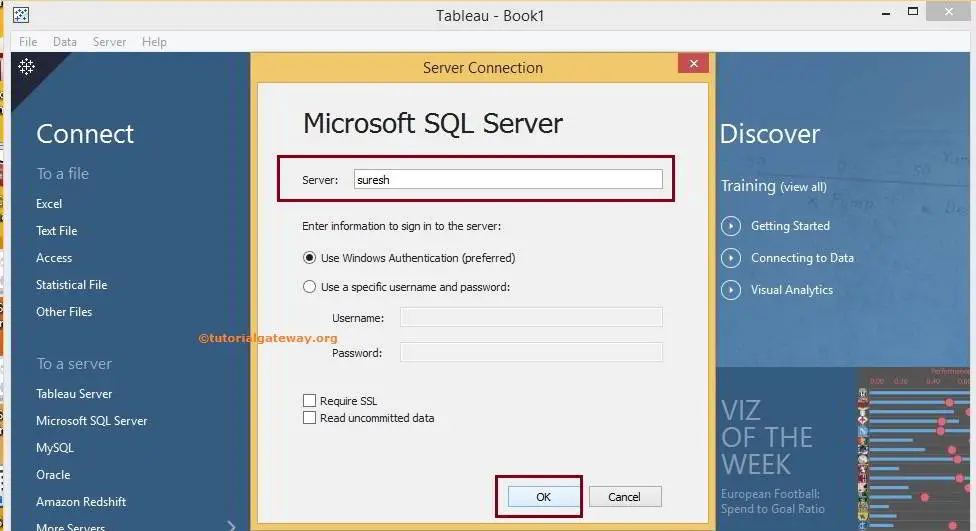
Once you select the Option, a new window will open to configure the Server Connections.
- Server: Please specify the SQL Server instance name to connect from the Tableau desktop.
- Enter information to sign in to the server: Use this section to determine how you want to connect with the SQL Server. Select the Use Windows Authentication option if you use the current Windows login credentials. Otherwise, select the Use specific Username and Password option & specify the Username and Password to access the Server.
- Require SSL: Please check this option while connecting to the SQL Server. It prevents Injections.
- Read Uncommitted Data: Check this option to use the Read Uncommitted ACID property.
For now, we use our local instance to connect to Tableau. Next, click on the OK button.
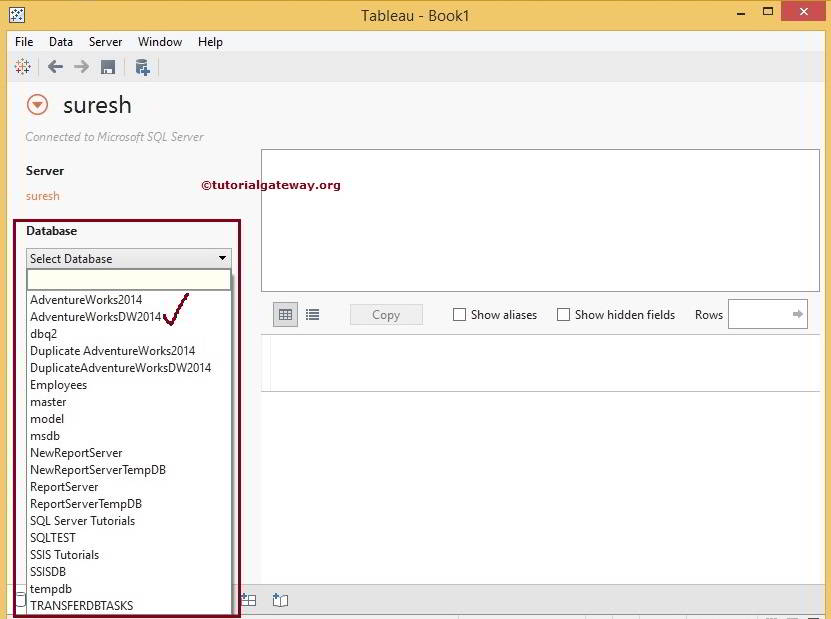
Once you click the OK button, the following screenshot will appear. Under the Database section, there is a drop-down menu to select the required Database available in that Instance. Here, choosing the Sql Server database you want to connect from Tableau would be best.
In this example, we select the AdventureWorksDW2014 database we downloaded from the Microsoft official Download Center.
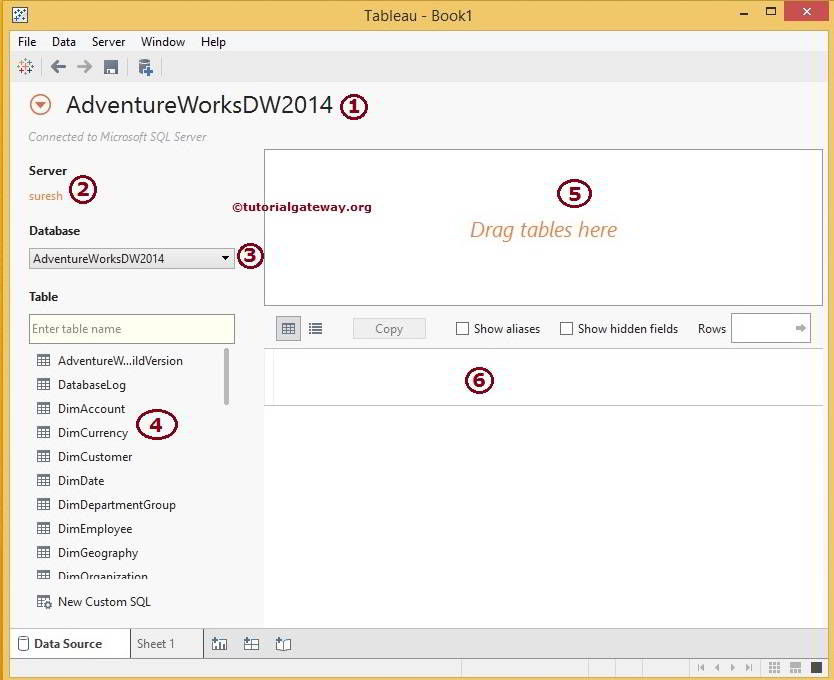
Once you complete it, the following screenshot will appear. Please understand the next options before you start creating a report.
- AdventureWorksDW2014 is the default data source name (In fact, the selected Database name) assigned by it. Please change this default name to a more meaningful, unique name.
- Server: This section will showcase the Instance name we used in Tableau to connect with the SQL.
- Database: It displays the Database we selected.
- Table: This section displays the available Tables, Views, and Stored Procedures in the selected Database. The search bar is under this section, which is handy for many tables. For instance, If you have 100 or 200 tables, you can use this to search for a specific table name.
- Drag Sheets Here: You must drag the Table(s) from the Table to this Section. It will only use the Tables present in this area. It is something like a Dataset.
- It shows the data present in our Dataset.
After connecting, we can add the SQL Server Tables to Tableau Region 5 in Multiple Ways: As the name suggests, we can drag the Table and stored Procedure from Region 4 to a 5th region, or else double-click on the required table to automatically add.
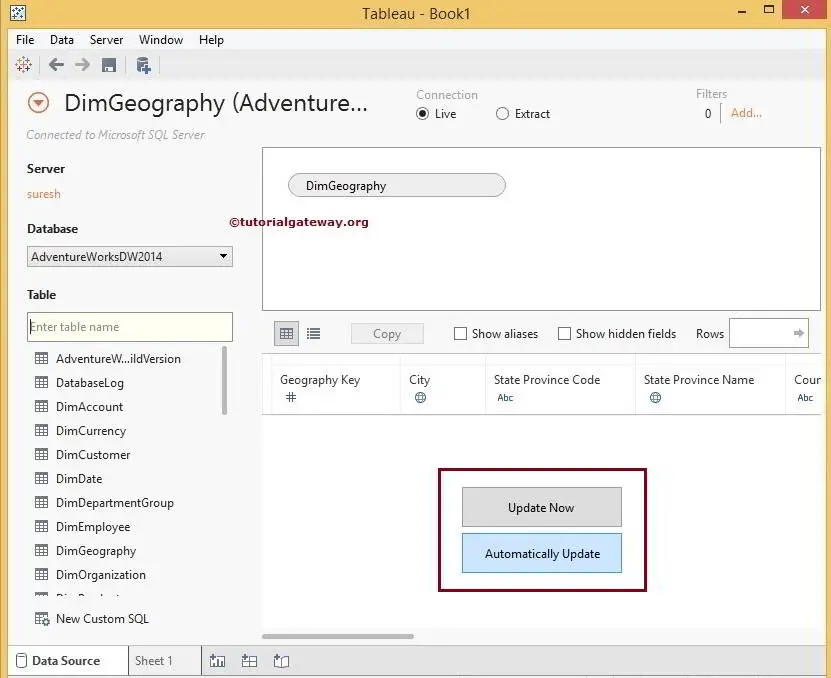
The Desktop allows us to add multiple tables using joins. Once you add the Table, the Preview region displays two buttons: Update Now and Automatically Update.
- If you click Update Now, we must click this button every time we make changes to the Dataset.
- If you click the Automatically Update button, modifications made to the Dataset will automatically reflect the preview. In this example, we are selecting this option.
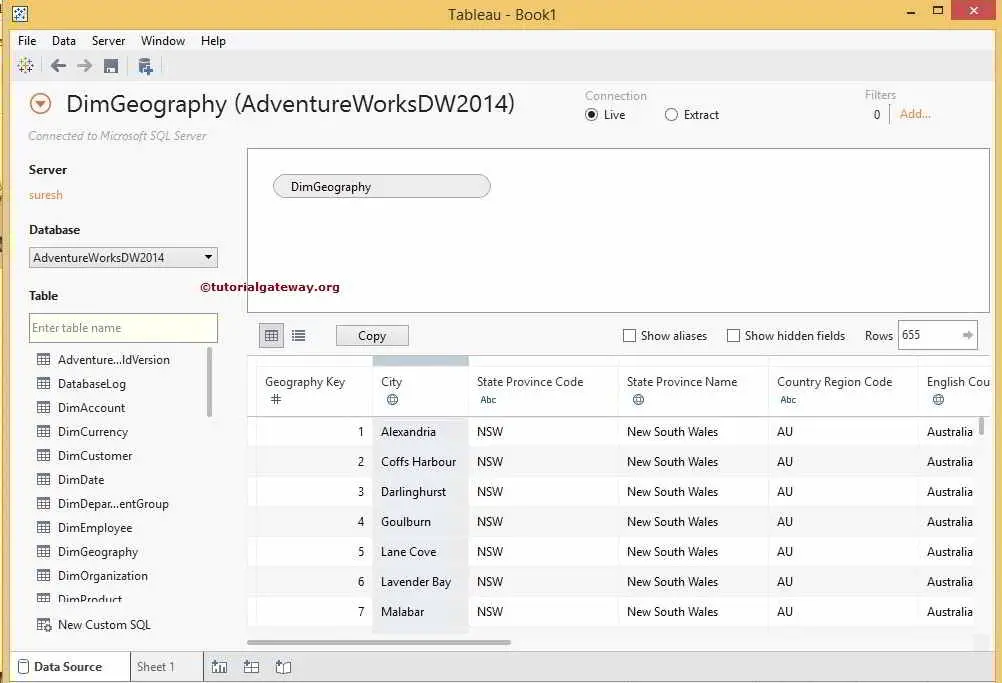
Once you click on the Automatically Update button, the Preview region will display the data in the DimGeography table.
Connecting to the SQL Server and Adding Data to Tableau
The above-specified method is not the only way to add data. In desktop, you can write your own query to extract data from the connected SQL Server database or data source. To do this, click the New Custom SQL button at the bottom left, as shown below.
Once you click on the New Custom SQL button, a new window called Edit Custom Query will open to write your own query.
Once you finish writing your Custom query, please click on the Preview Results.. button to see the query result.
TIP: Please use the Management Studio to build your custom query and then paste the same into this Edit Custom SQL Window
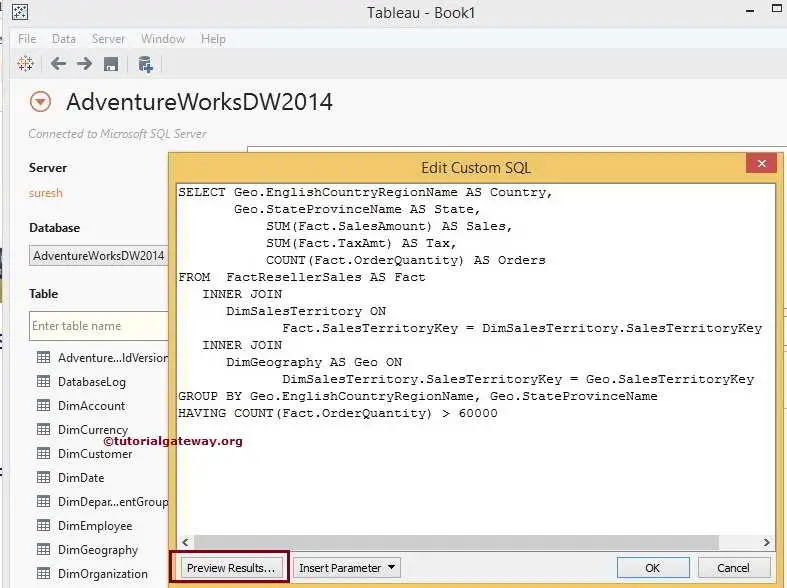
The custom Query we used in the Connecting Tableau to SQL Server example is:
SELECT Geo.EnglishCountryRegionName AS Country,
       Geo.StateProvinceName AS State,
       SUM(Fact.SalesAmount) AS Sales,
       SUM(Fact.TaxAmt) AS Tax,
       COUNT(Fact.OrderQuantity) AS Orders
FROM FactResellerSales AS Fact
  INNER JOIN
     DimSalesTerritory ON
        Fact.SalesTerritoryKey = DimSalesTerritory.SalesTerritoryKey
  INNER JOIN
     DimGeography AS Geo ON
        DimSalesTerritory.SalesTerritoryKey = Geo.SalesTerritoryKey
GROUP BY Geo.EnglishCountryRegionName, Geo.StateProvinceName
HAVING COUNT(Fact.OrderQuantity) > 60000
NOTE: Don’t worry about the Query. Understand the procedure to write the custom Query. However, If you want to understand, please read our SQL Server Tutorial
Once you click on the Preview Results.. button, a new window called ViewData will open to see the Custom query result
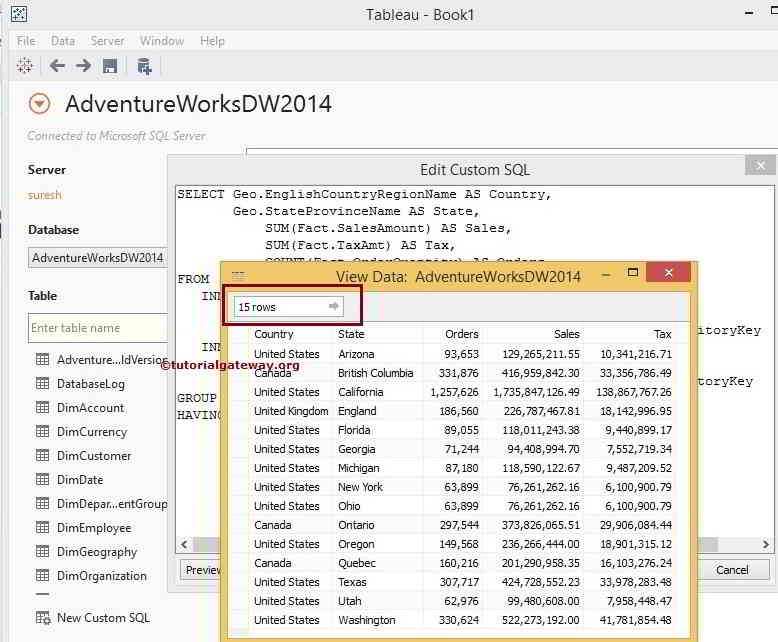
Please refer to the screenshot below to understand the different areas. We will use another article to discuss the Connections part.
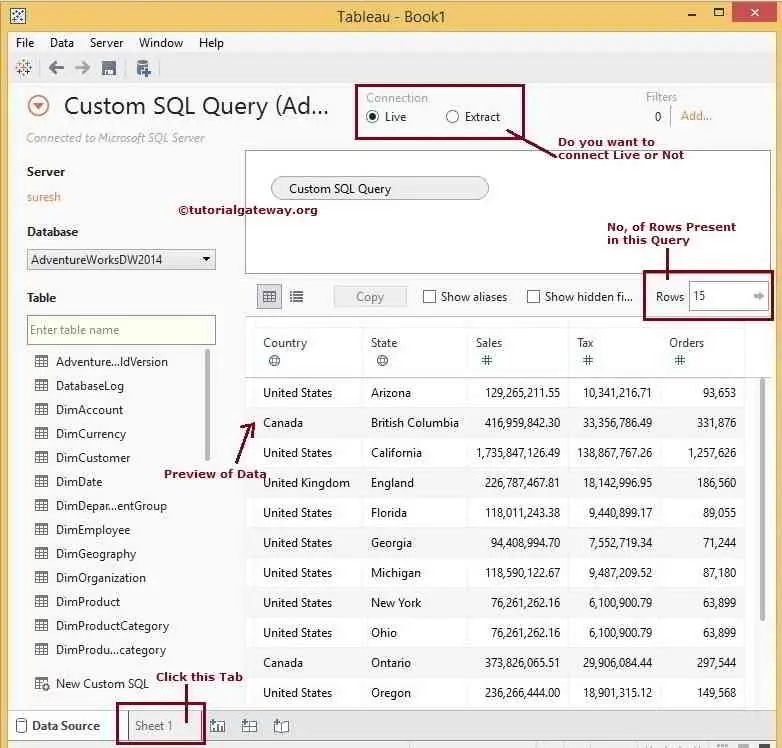
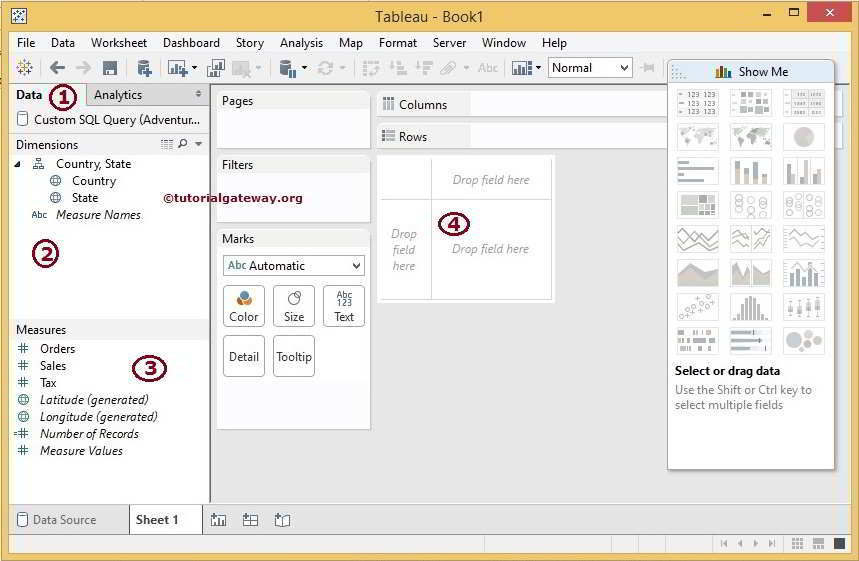
Once you have finished reviewing the data, click Sheet 1 to design the Report. Now, you can see the newly connected SQL Server connection, query, and Tables inside the Tableau desktop.
- Data: This will display the list of currently connected data Sources. We have only one at this time. Otherwise, it shows all the available data sources.
- Dimensions: Columns with string data will be placed under the Dimensions section
- Measures: Columns with Numeric data or Metric values will be placed under the Measures section
- Here, we design our reports by dragging Measures and Dimensions.