Tableau Table Calculations are a special type of calculated field. Unlike regular calculated fields, these are based on the data currently visualized in a report. This article shows how to create table calculations and how to use their properties.
For these Table calculations demos, we use the Global Super Store Excel Worksheet. Before creating them, let me create a simple report.
Create Tableau Table Calculations
In this tool, you can create table calculations in multiple ways, and the first approach is to right-click on the measure and select Create -> calculated Fields. For the second approach, please navigate to the Analysis Tab and select the Create Calculated Field… option. Please refer to the Tab Report, calculated field, and Connecting to the Excel Files in Tableau.
Selecting the option will open the following window. Here, we renamed the default name Cal and used the First function as the calculated field. The below statement will find the First records in this data. Here, you can click OK to close this window.
Calculated Field Name: Cal
Expression: FIRST()
Or you can click the Default hyperlink (marked below) to alter the default settings, and it will open the following window.
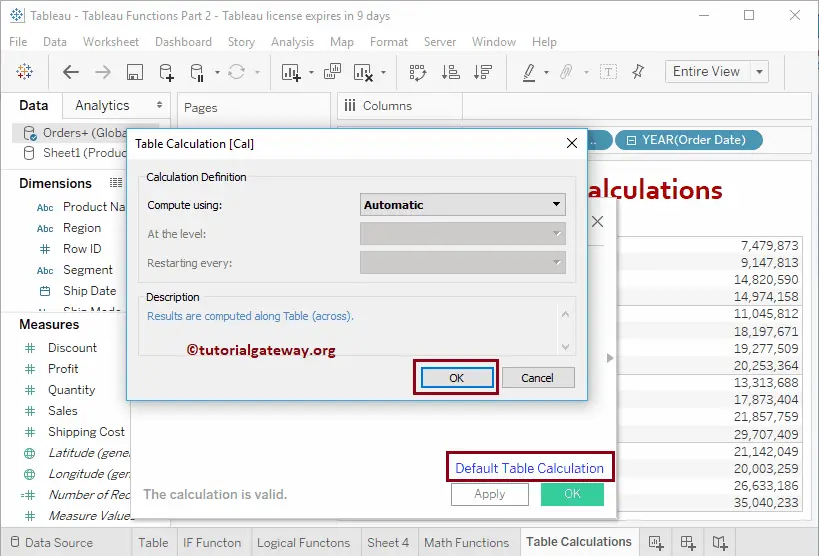
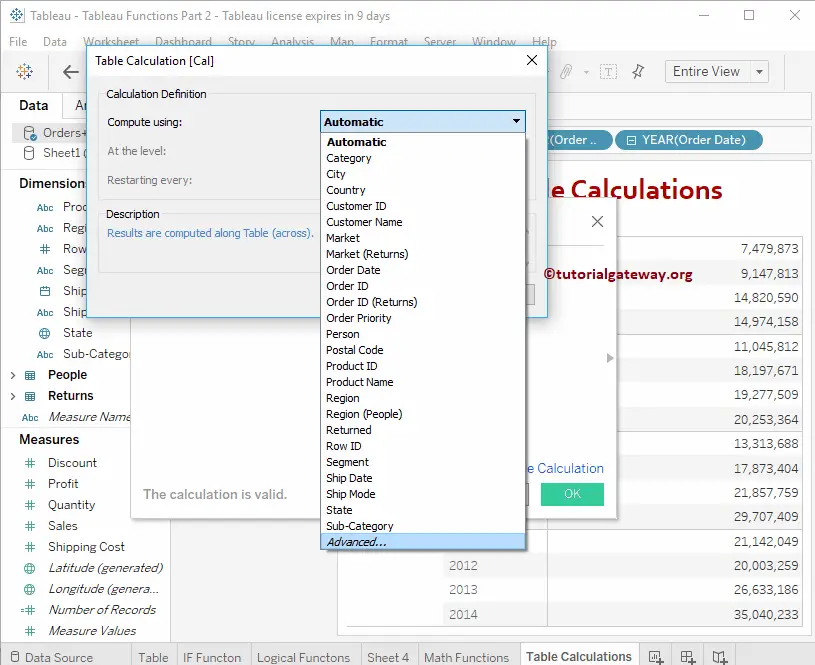
Use this window to change the Tableau table Calculation field, Levels, etc. I am not a fan of making any modifications using this window. However, you can do it by choosing the Column from the Compute using drop-down menu. Let me click the Cancel button to close the window and then click OK.
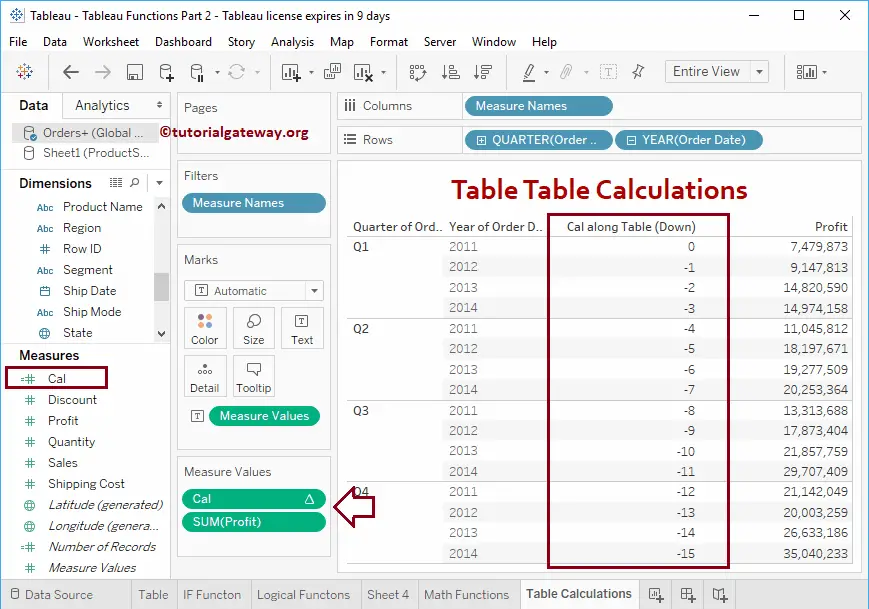
Let me drag this first Cal to the Measures shelf in the design area.
How to Edit Table Calculations?
Altering or editing the Tableau Table Calculations is very simple. Click the down arrow and select Compute using to change the computing options.
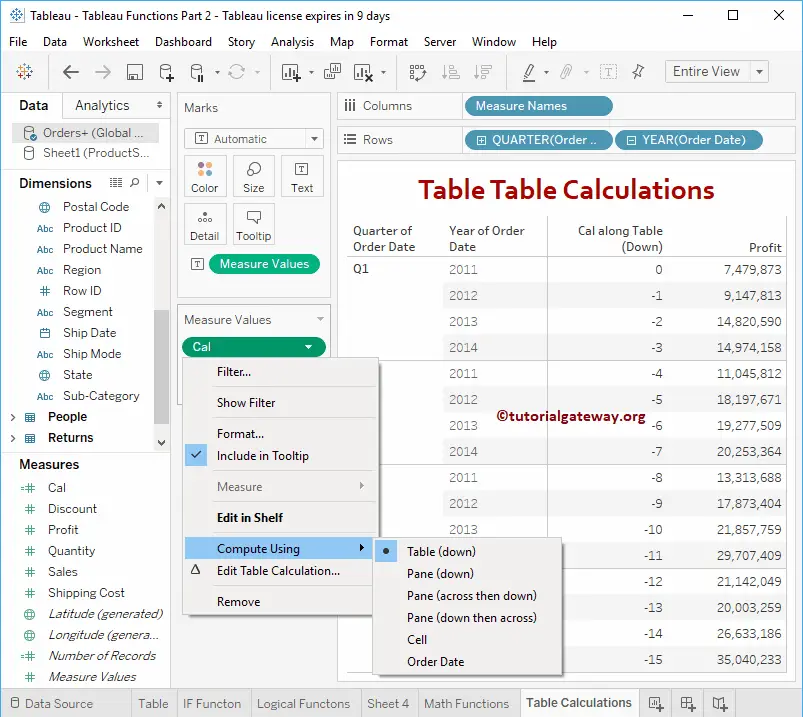
Let us see the list of available options. For this, let me select the Edit Table Calculation option from Measure Values.
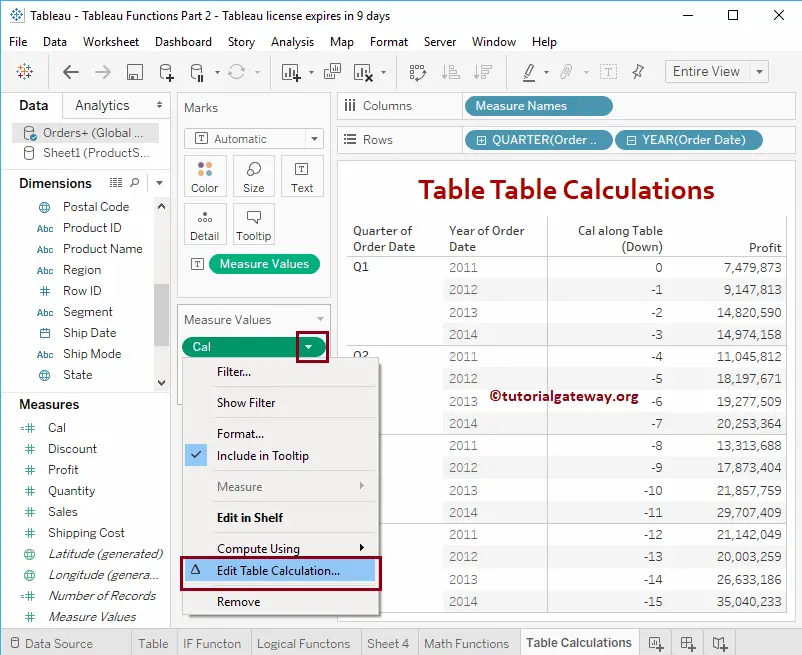
It will open a new window called Edit Calculation.
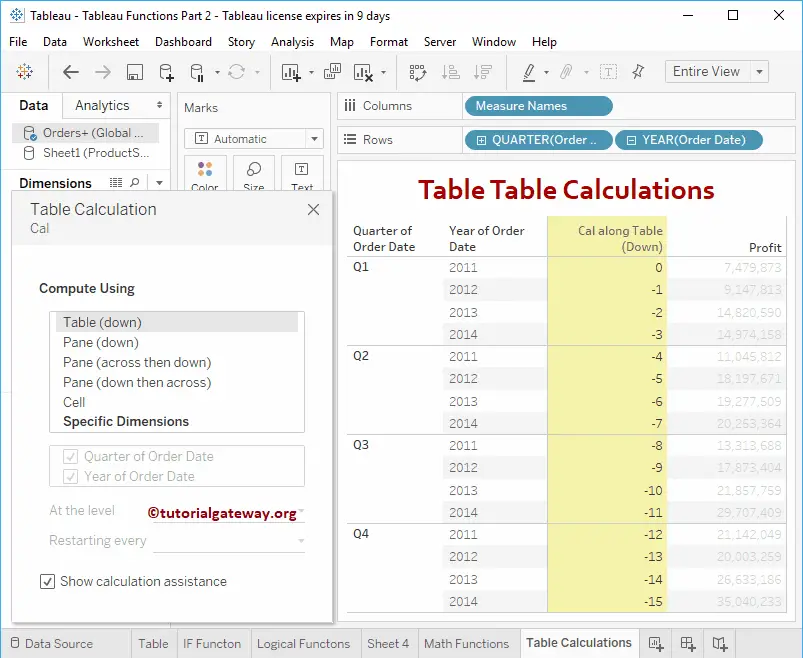
Table Down Calculation
The Table Down Calculations will start calculating from the first row to the end row in a complete table.
Pane Down Table Calculations
The Pane Down will calculate from the first row to the end row in a Pane or group. From the screenshot below, the First is applying for each quarter.
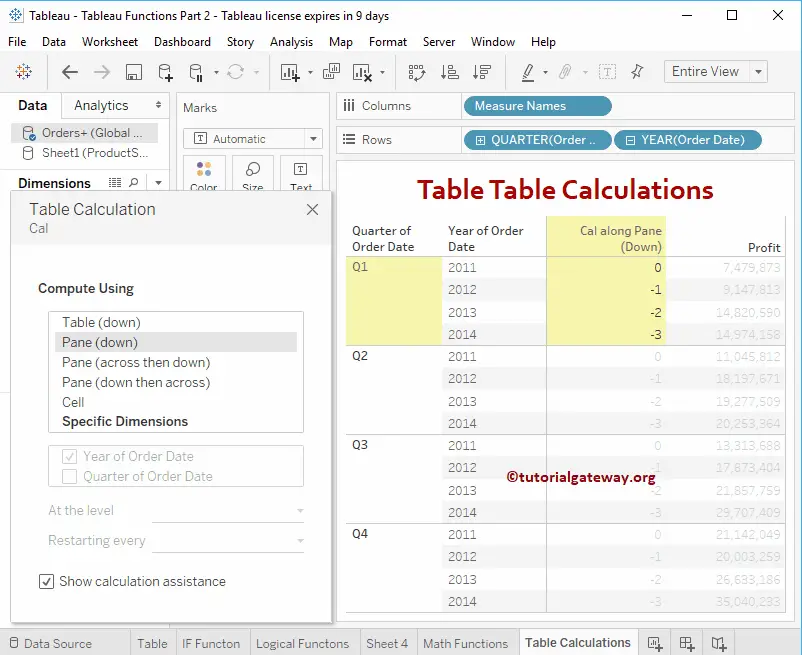
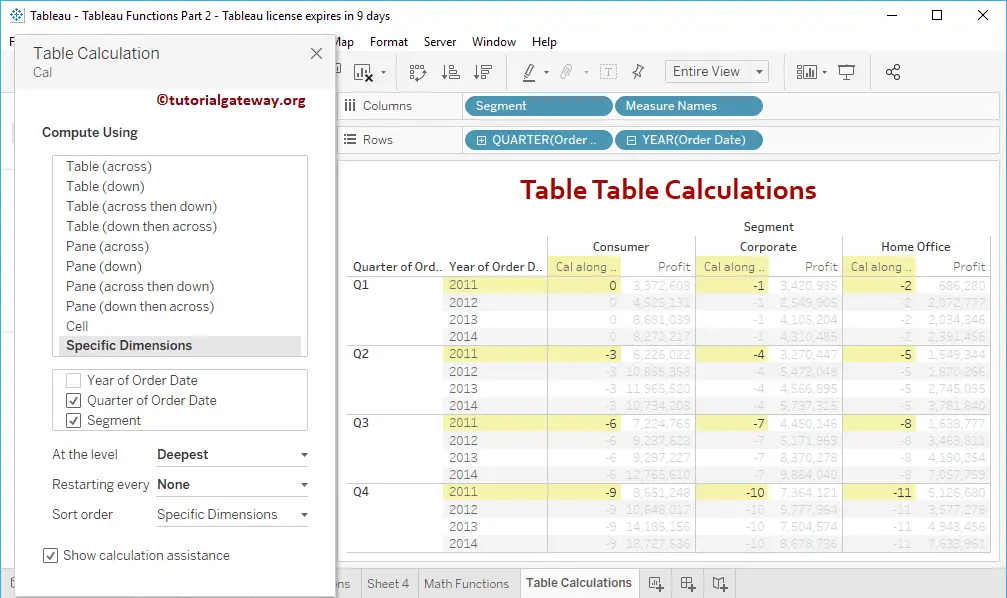
Tableau Table Calculations on Specific Dimensions
You can use any dimensional column to compute the Table calculation. Here, it applies the FIRST function for each year.
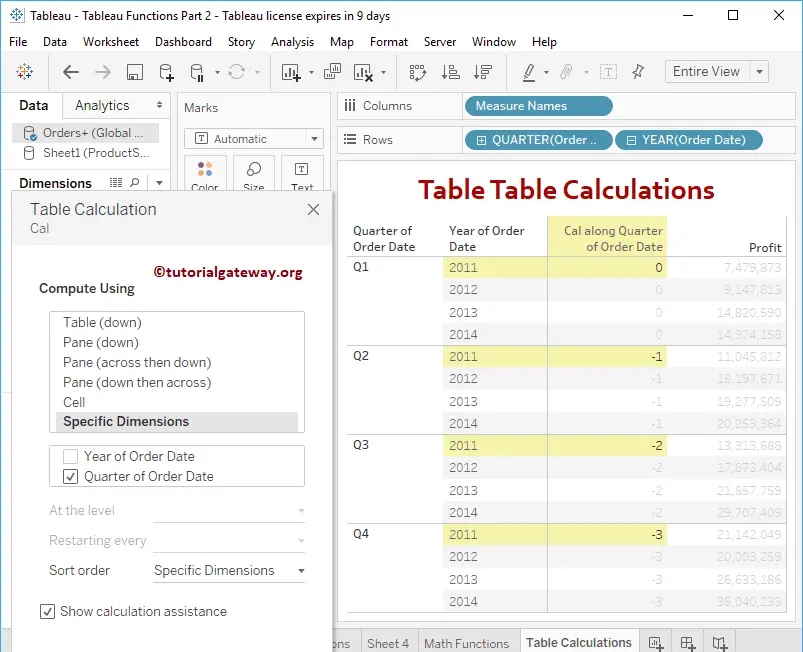
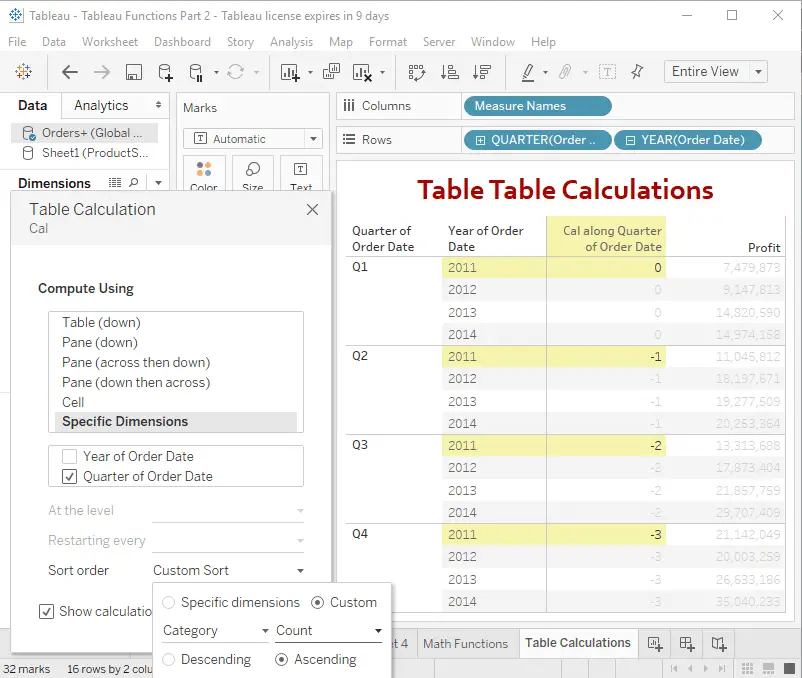
You can also change the Sort order and sorting column
Let me add Segments filed to the Columns shelf to explore a few more options. As you can see, it displays a few more options.
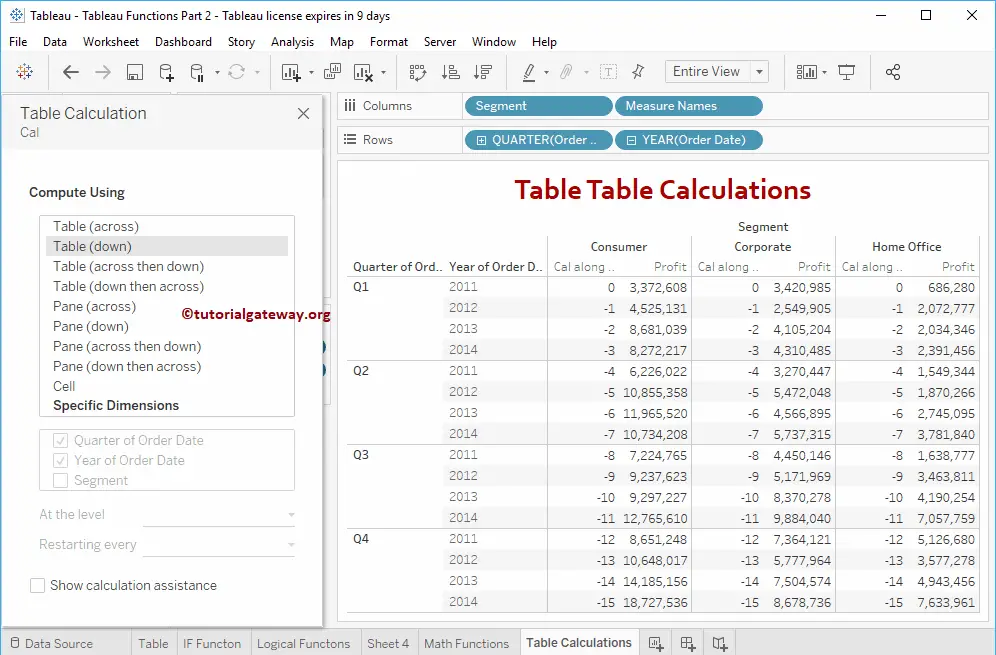
Table across calculations
Table Cross Calculations will apply the first function for each row in a table.
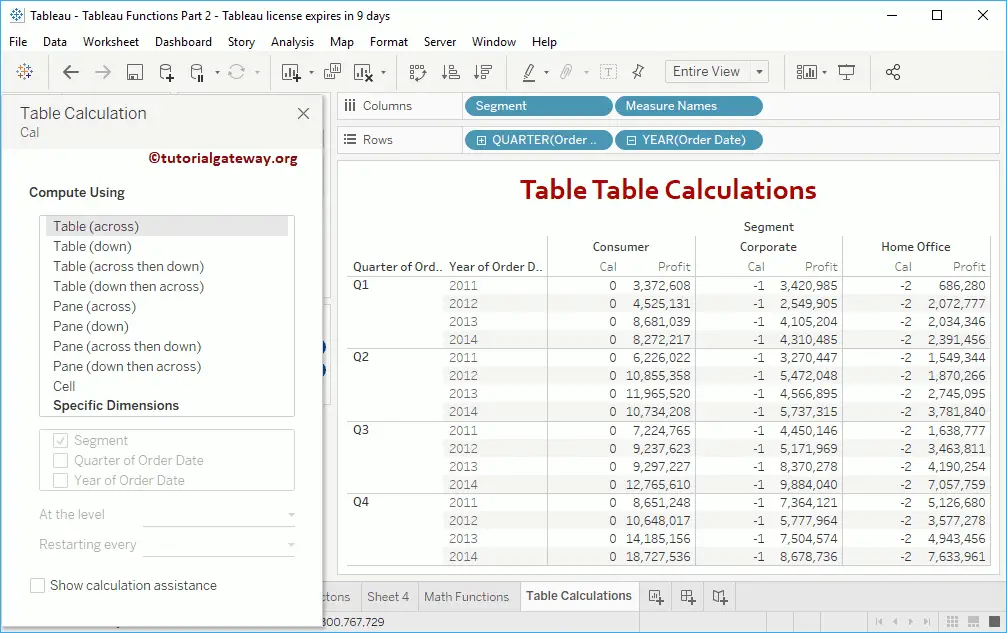
Tableau Table across then down calculations
The Table across then down will apply the first function for each row and then go to the next row.
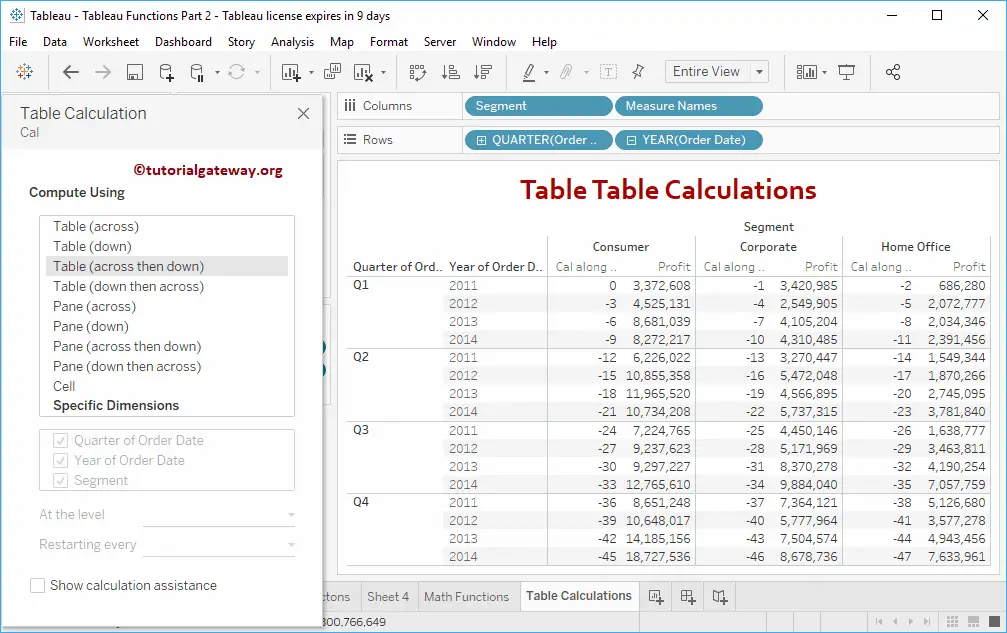
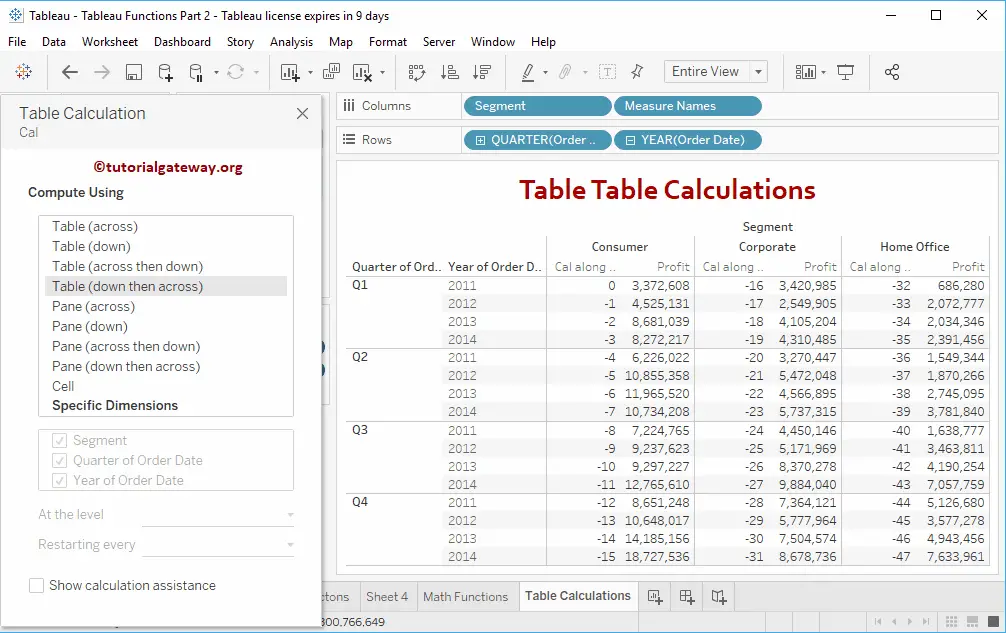
Table down then across
It will apply the first function for each row in a column and then go to the next column.
Pane Down calculation
It will calculate from the first row to the end row in a Pane or group.
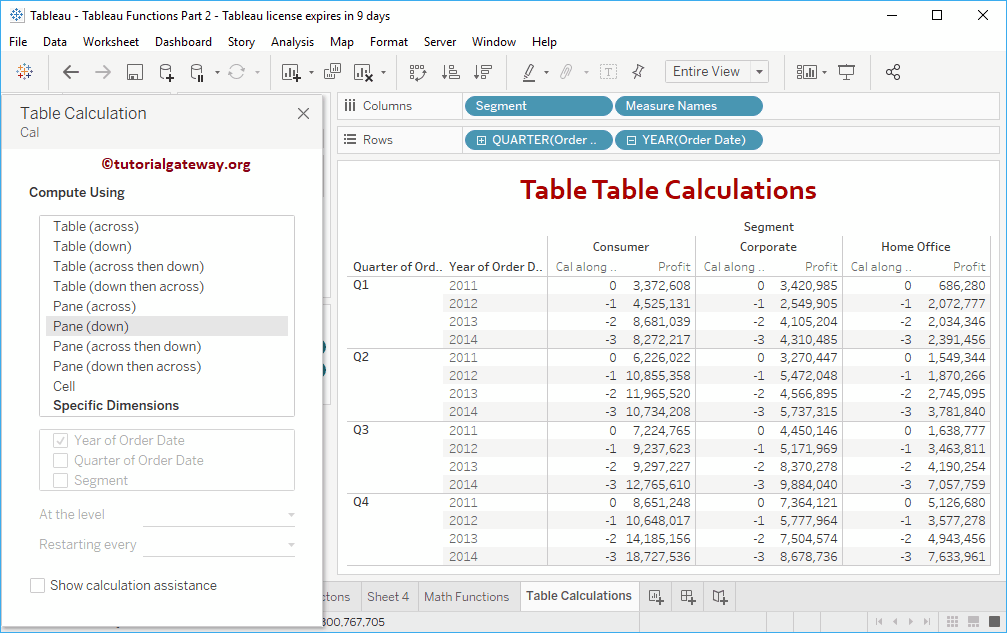
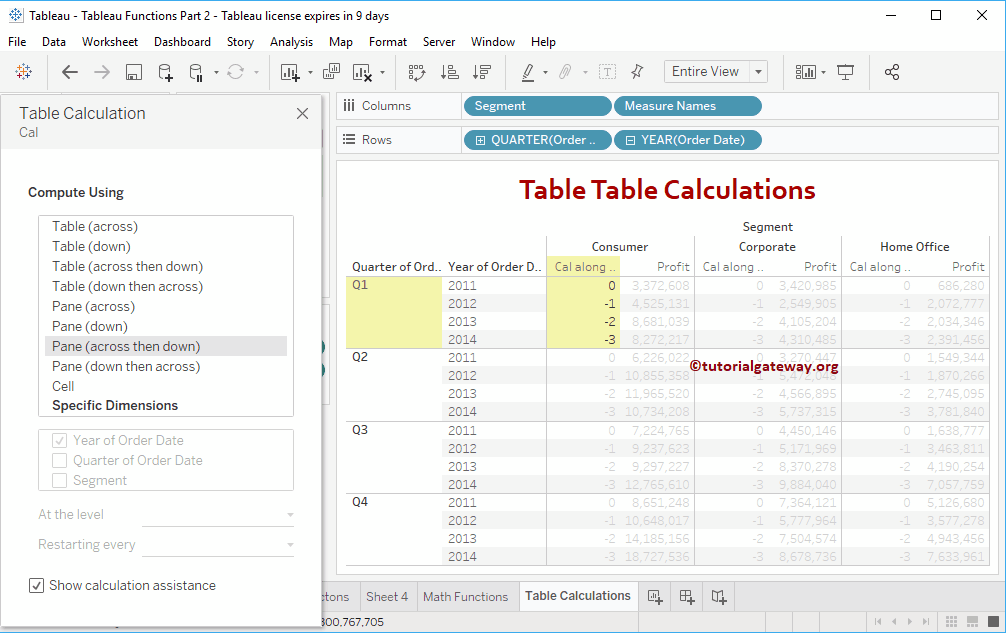
Tableau Table Calculation Pane across then down calculation
The Pane down then down calculations will calculate from the first row to the end row in a Pane or group.
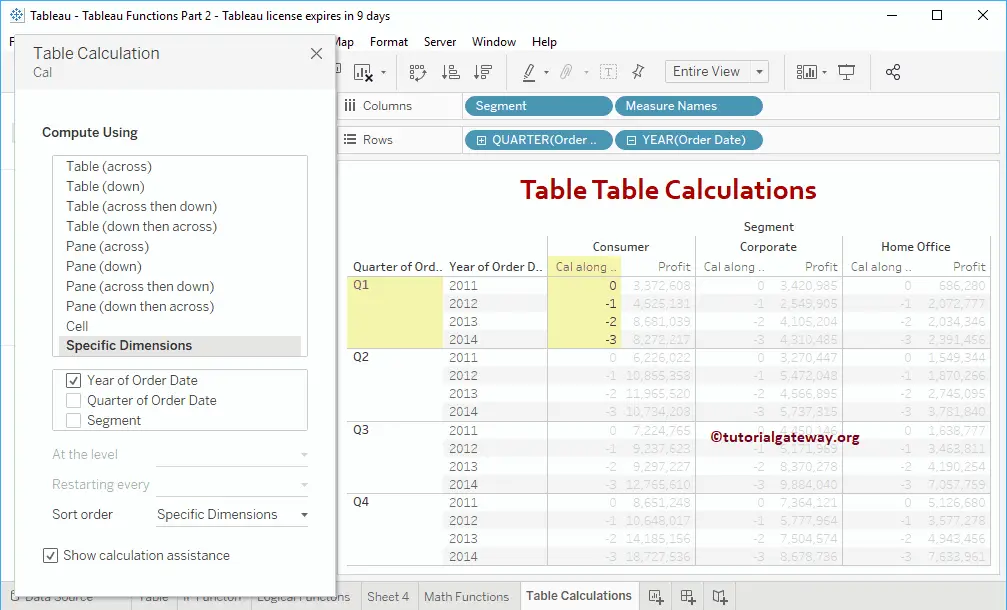
Calculation on Specific Dimension
As we said before, use your own dimension to compute the calculation. Here, it applies the FIRST function for each quarter.
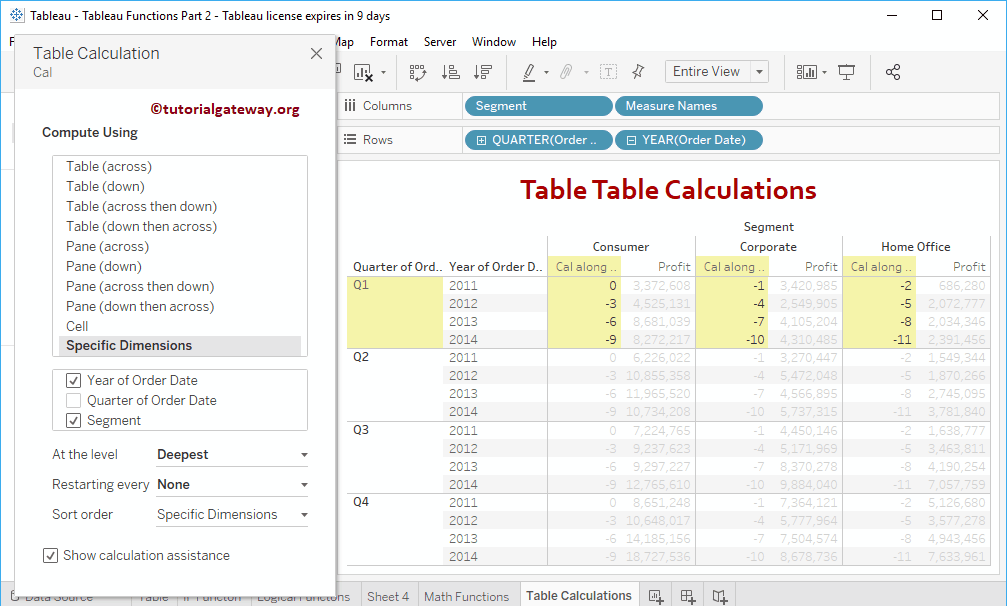
The FIRST function calculates each quarter and segment.
Here, the FIRST function applies for each year and segment.