This chapter shows how to connect Tableau to Microsoft Excel Files. Furthermore, how to use the Excel sheets as Tableau Data Source with an example.
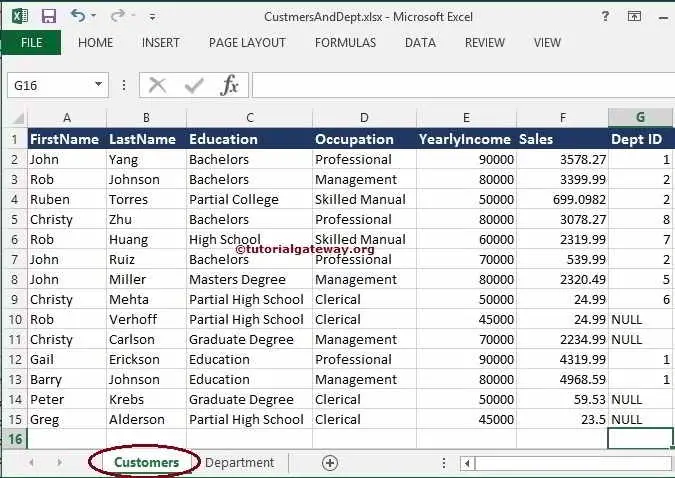
Before we start connecting to Tableau, let us see the data present in the Excel file. The screenshot below shows that it is just a regular .xlsx file holding two sheets or two tables. The screenshot below will show the Data present in the Customer sheet.
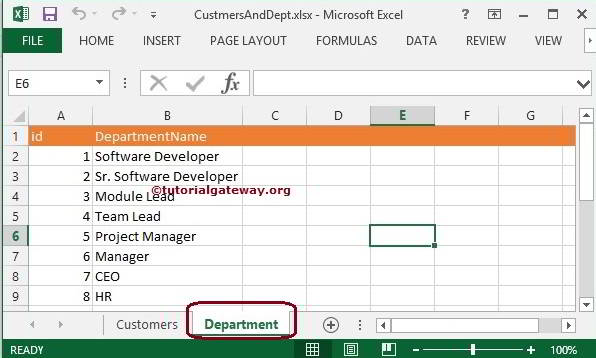
The below screenshot shows the Data present in the Department sheet.
Steps involved in Connecting to Excel Files in Tableau
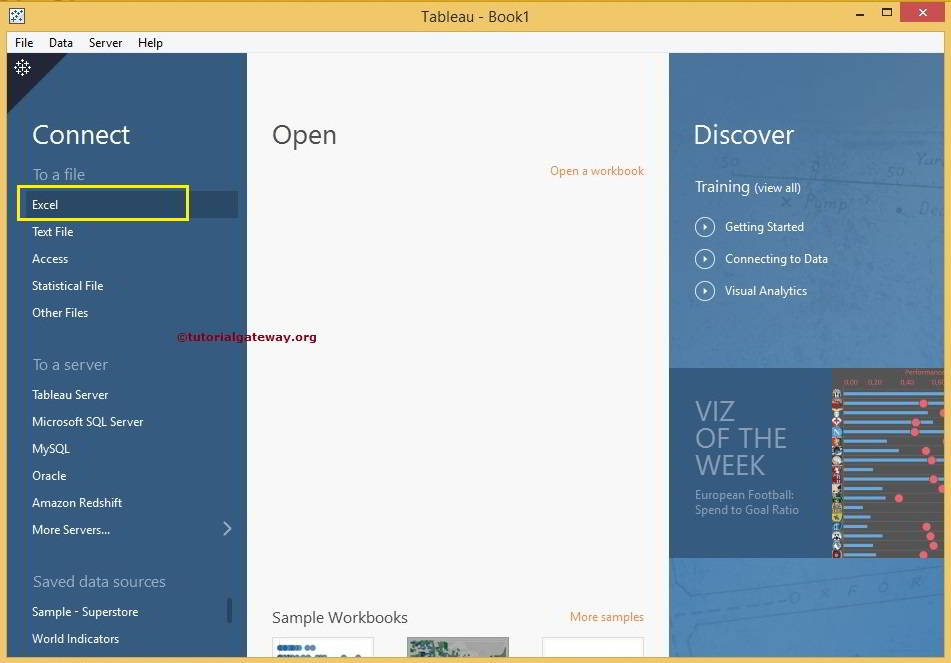
Double click on the desktop to open. Once it is open, it looks like the below screenshot. First, Under the Connect section, Please select the Excel Option to connect to Excel files.
Once the Excel Option is selected, a new window will open to select the Excel file from our file system. For now, we are selecting the CustomersAndDept.xlsx file, as shown below.
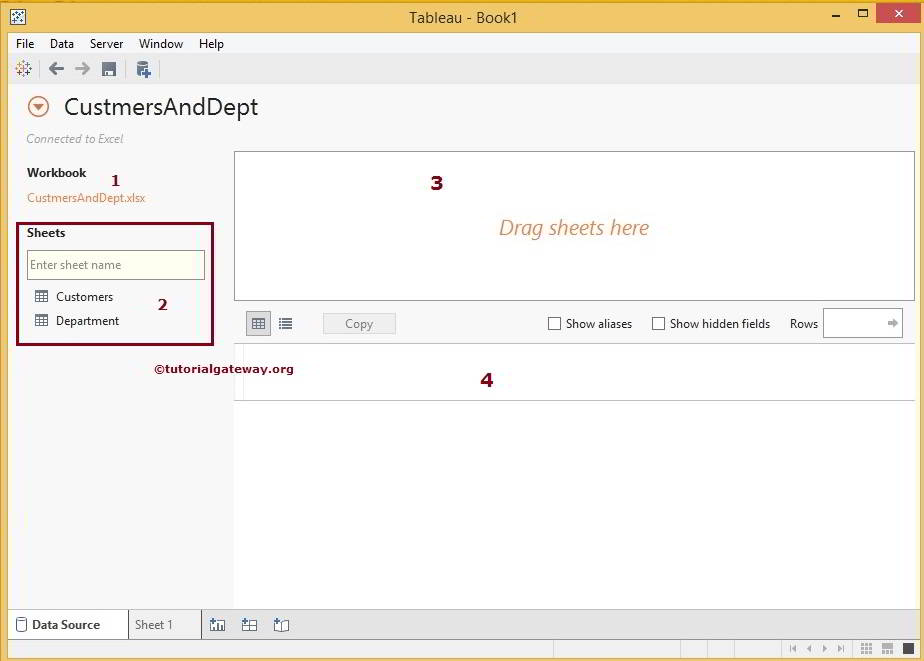
Once we complete it, the below screenshot will appear. Please understand the following connection options before creating a Tableau report using a connected Excel file.
- Workbook: Excel File we selected from our file system.
- Sheets: This section displays the Sheets or tables in the Excel source. We have two tables, so it displays those two sheets (Customers and Department). The search bar is under this section, handy for many sheets. For instance, If we have 30 or 40 sheets, use this to search for a specific table.
- Drag Sheets Here: We must Drag Table(s) from Sheets to this Section. It will only use the tables present in this area. It is something like Dataset.
- This region shows the data present in our connected Excel File Dataset.
NOTE: CustomersAndDept is the default data source name (Excel Filename) assigned by it. Please change this default name to a more meaningful, unique name.
We can add the sheets to Region 3 in Multiple Ways. As the name suggests, we can Drag the Customers Table from the Sheets region to the 3rd region or double-click on the required table will automatically add.
TIP: Tableau allows us to add multiple tables using Joins.
Once we dragged the Customers Excel Files sheet, the Tableau Preview region will display the data in that connected sheet. If you observe the below screenshot, there is a message showing that the Data Interpreter is On.
Data Interpreter: If Tableau discovers the format of any column data in our selected sheet is difficult to analyze. So it will pop up a message asking us to Turn On the Data Interpreter. By turning the Data Interpreter on, we can normalize the data.
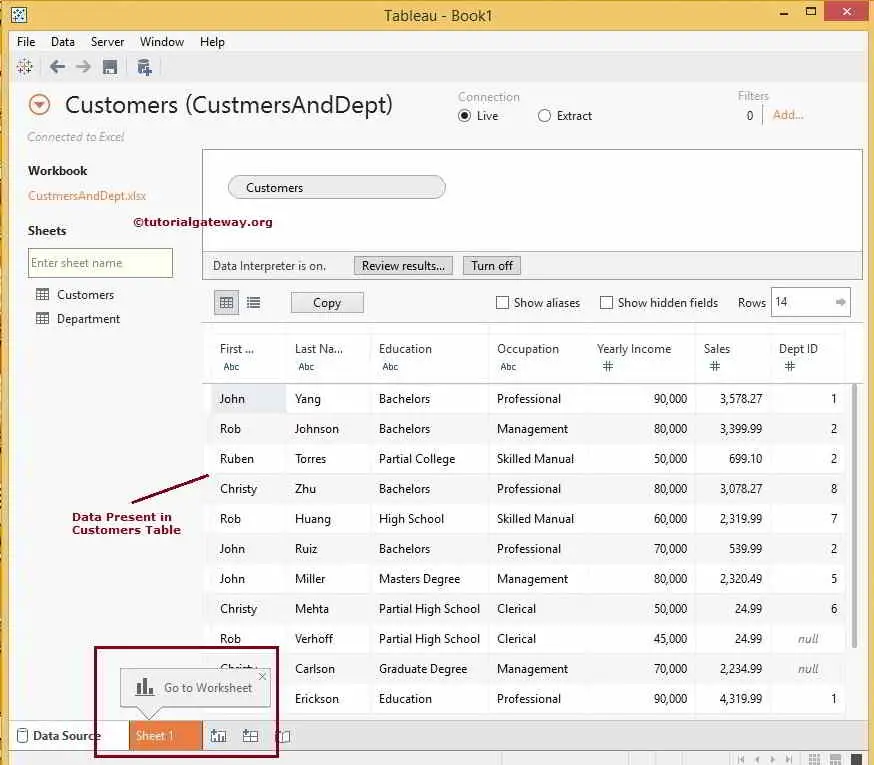
Once we finished, click on the Sheet 1 tab to design the Tableau report using the connected Excel file.
- Data: This will display the list of currently connected data Sources. We have only “One” now; otherwise, it displays all the available data sources.
- Dimensions: Columns with string data will be placed under the Dimensions section
- Measures: Columns with Numeric data or Metric values will be placed under the Measures section
- It is the area where we design our reports by dragging Measures and Dimensions.
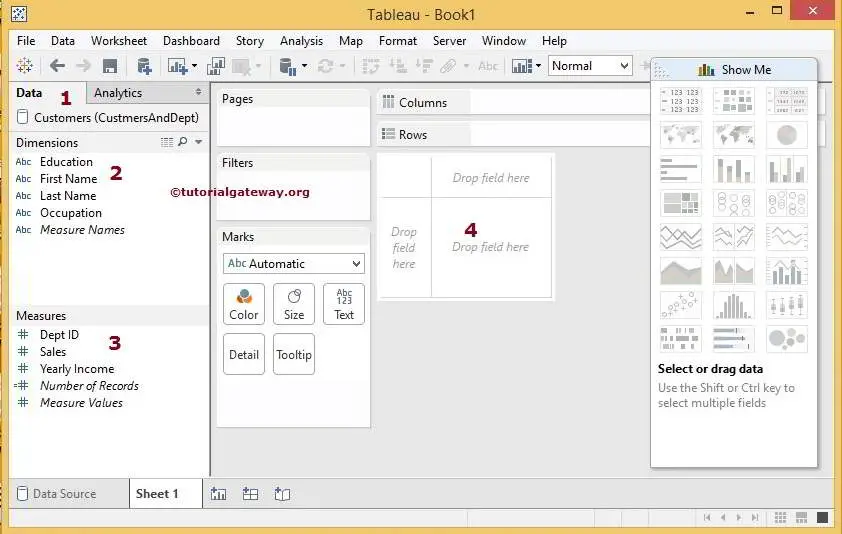
From the above screenshot, we only see the data in the Customers table, though we have Customers and Department tables in our Excel file. If we want to add a Department table, Click the back button on the Top and Join the Department table with the Customer table.
Comments are closed.