The Blended Axis in Tableau is beneficial for comparing two measured values against the same axis. This article will show you how to Create a Blended Axis in Tableau with an example.
For this Blended Axis demo, we are going to use the Data Source we created in our previous article. So, Please visit the Data Labels in the Tableau Reports article to understand the Tableau Data Source.
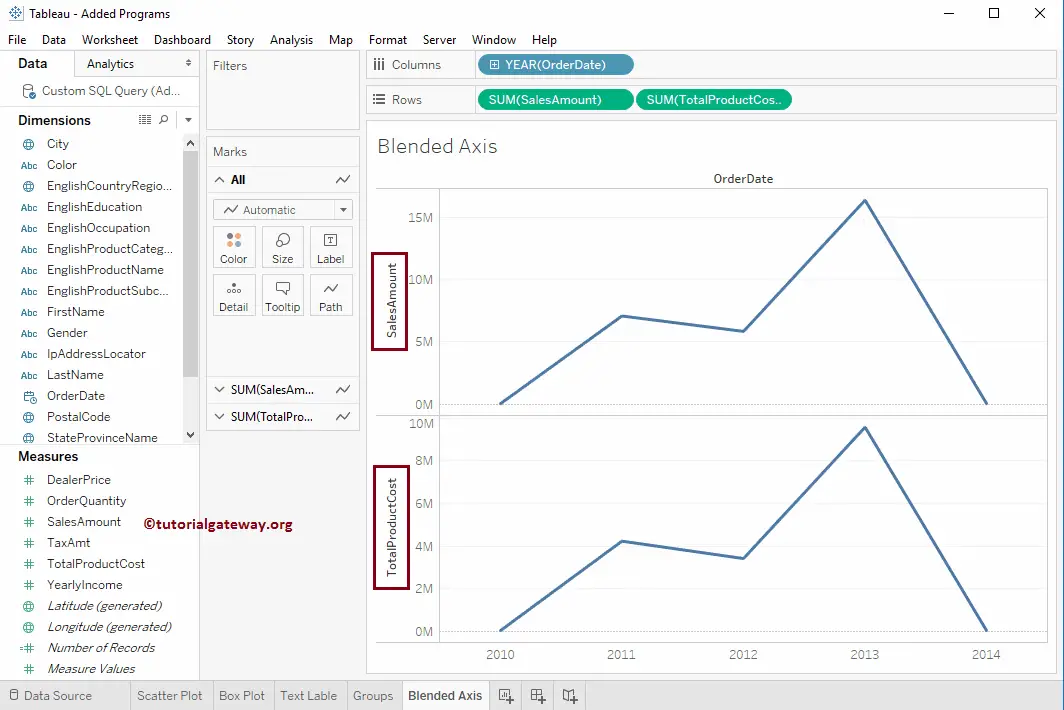
To show the Blended Axis in Tableau First, Drag and Drop the Year from the Dimension Region to the Column Shelf. Next, Drag and Drop the Sales Amount from the Measures Region to the Rows Shelf. Because it is a Measure value, the Sales Amount will aggregate to the default Sum. Once you drag them, the Line Chart report will be generated.
Creating Blended Axis in Tableau
In this example, we want to compare the Sales Amount against Total Product Cost. So, Drag and Drop one more measure value, i.e., Total Product Cost, from the Measures section to Rows Shelf. Since it is a Measure value, Product Cost will aggregate to the default Sum.
To create a blended axis in the tableau Report, Please drag and drop the Total Product Cost from the Row Shelf to the Sales Amount axis, as shown below.
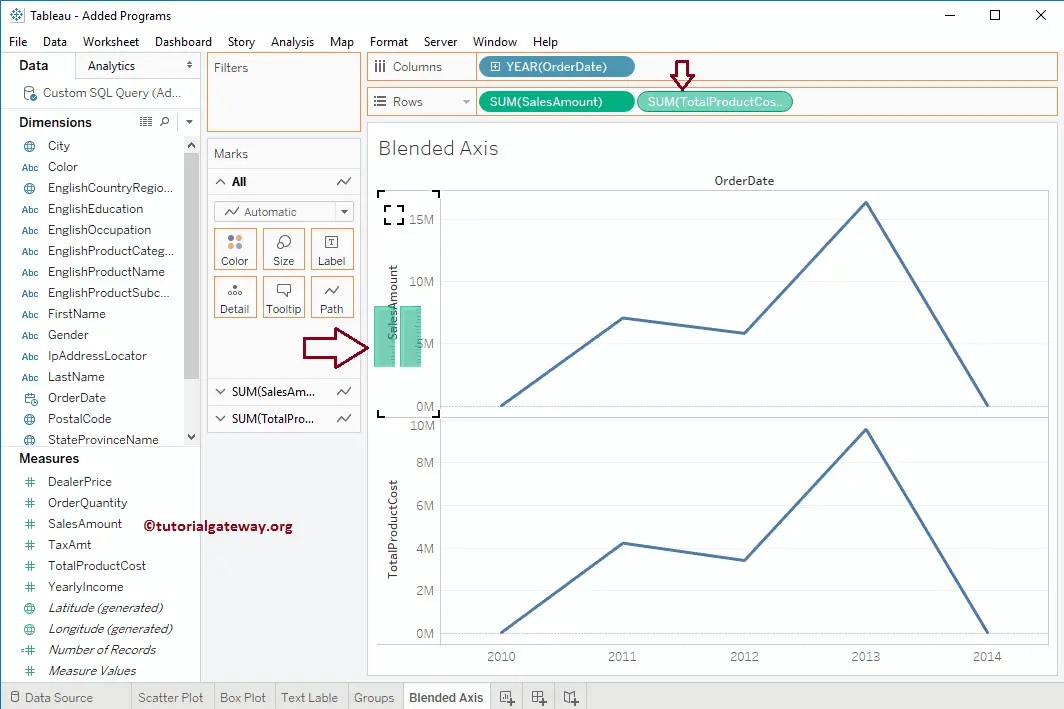
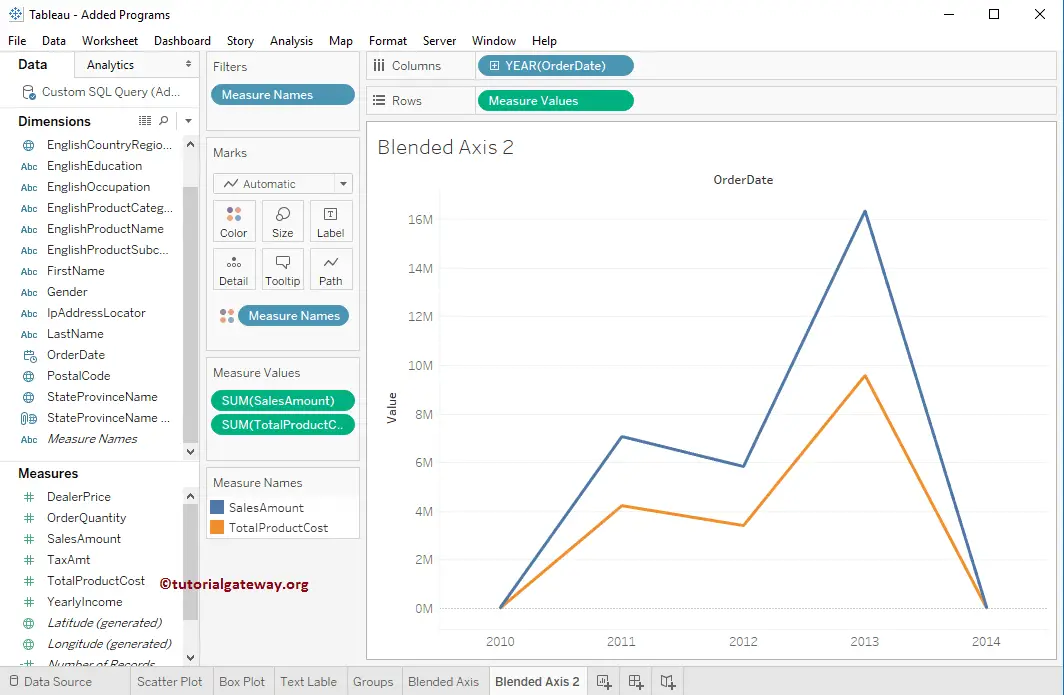
The following screenshot will show you the report after the blended axis.

The second approach to creating a Blended Axis
You can directly drag the measures item from the measures region to the axis, as shown below.
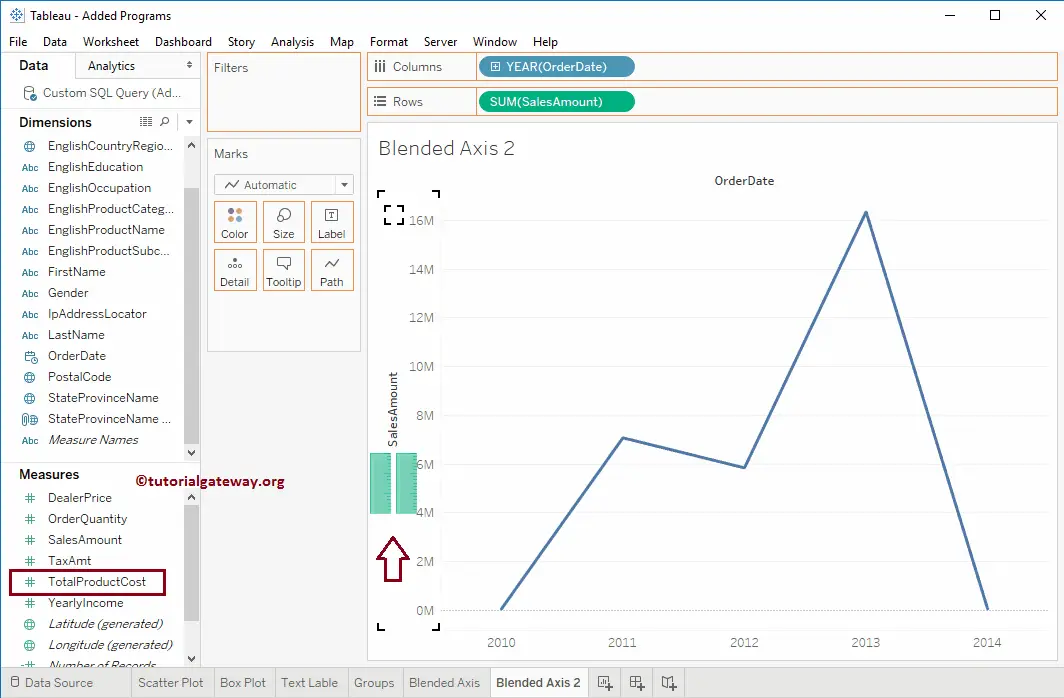
The following screenshot will show you the Tableau blended axis report
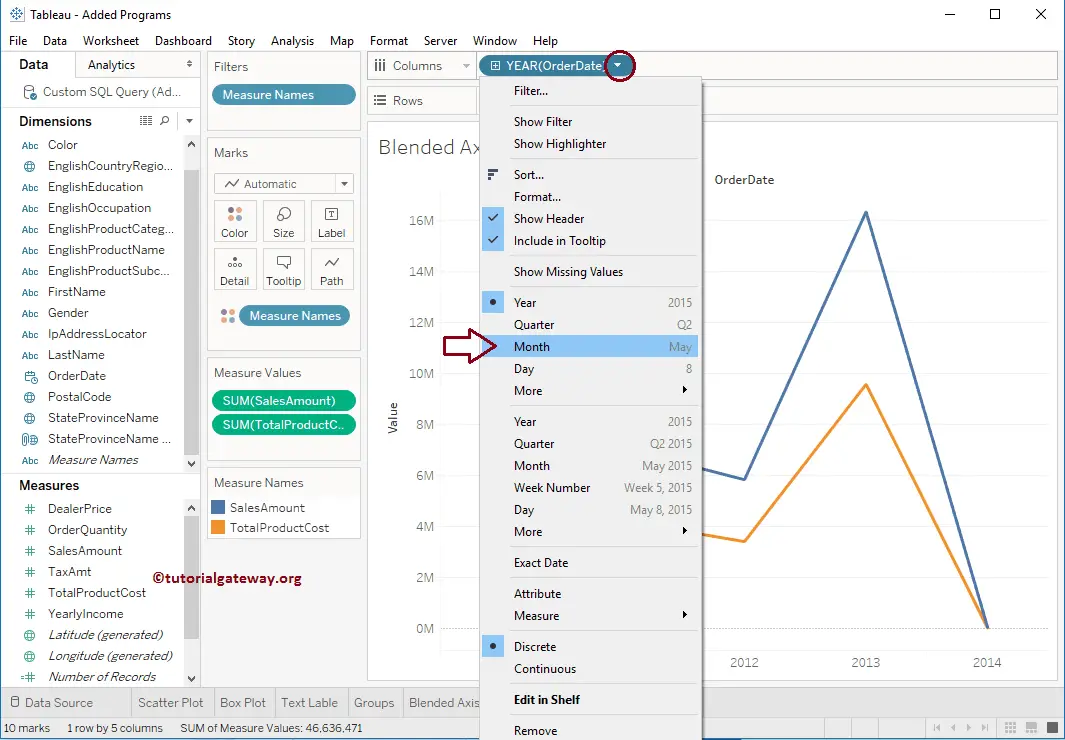
Let us change the Year value to Month for a detailed report
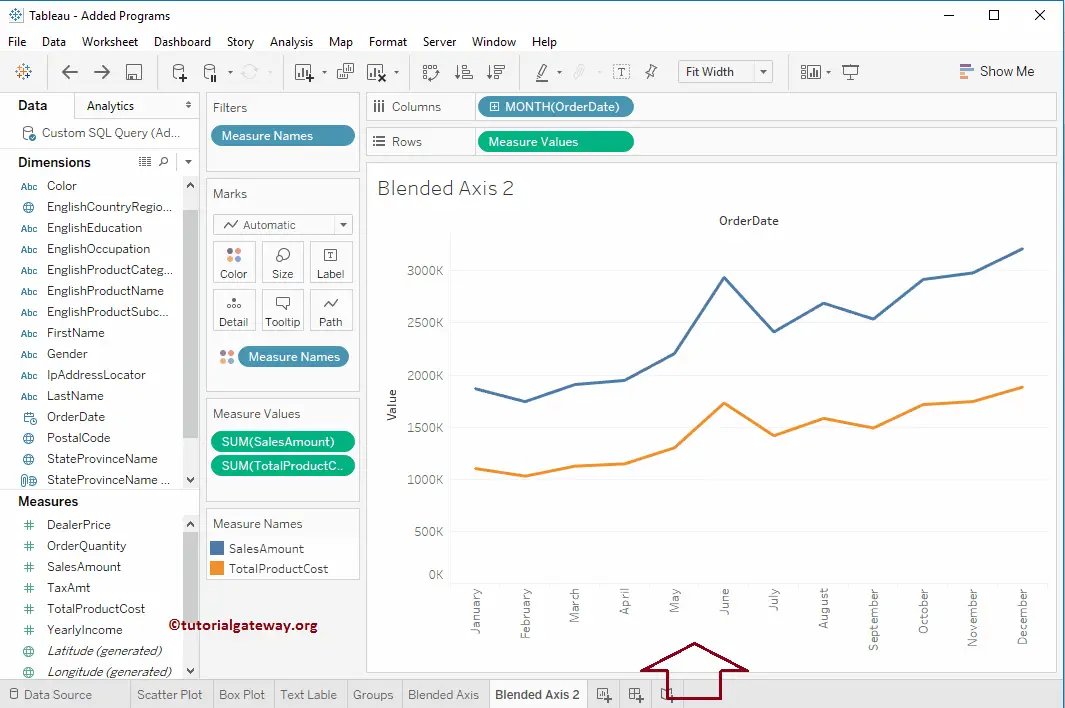
Now you can see the blended axis report for each month
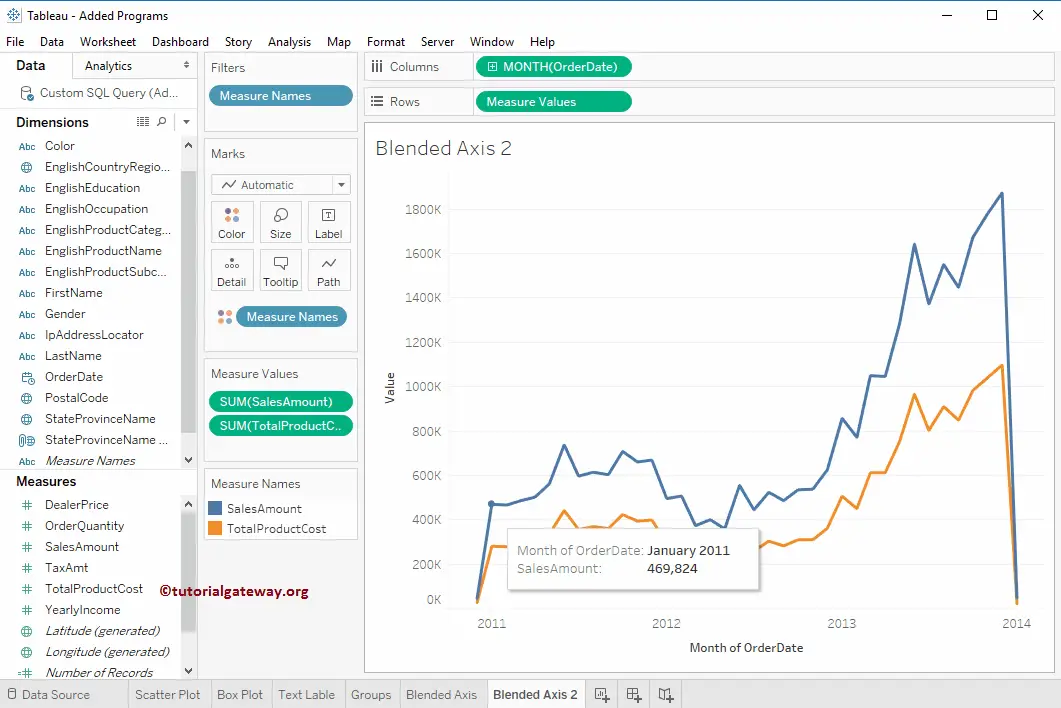
Let us change the value from Month names to All months present in each year
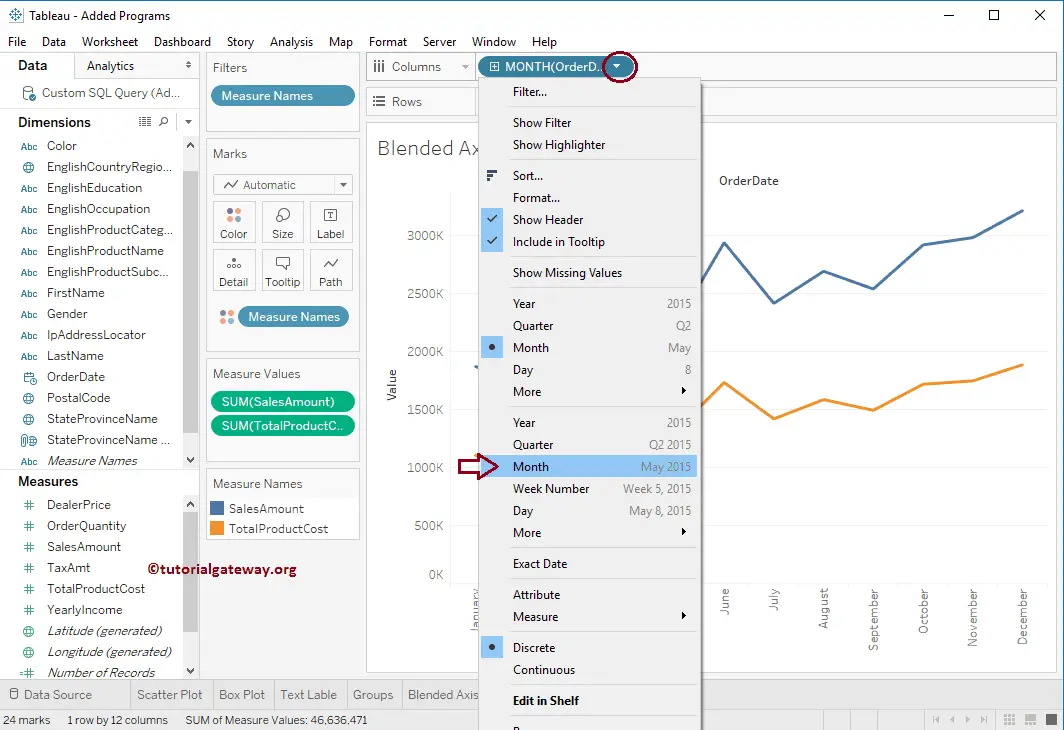
Now you can see the detailed blended axis report for each month of 2011, 2012, 2013, and 2014
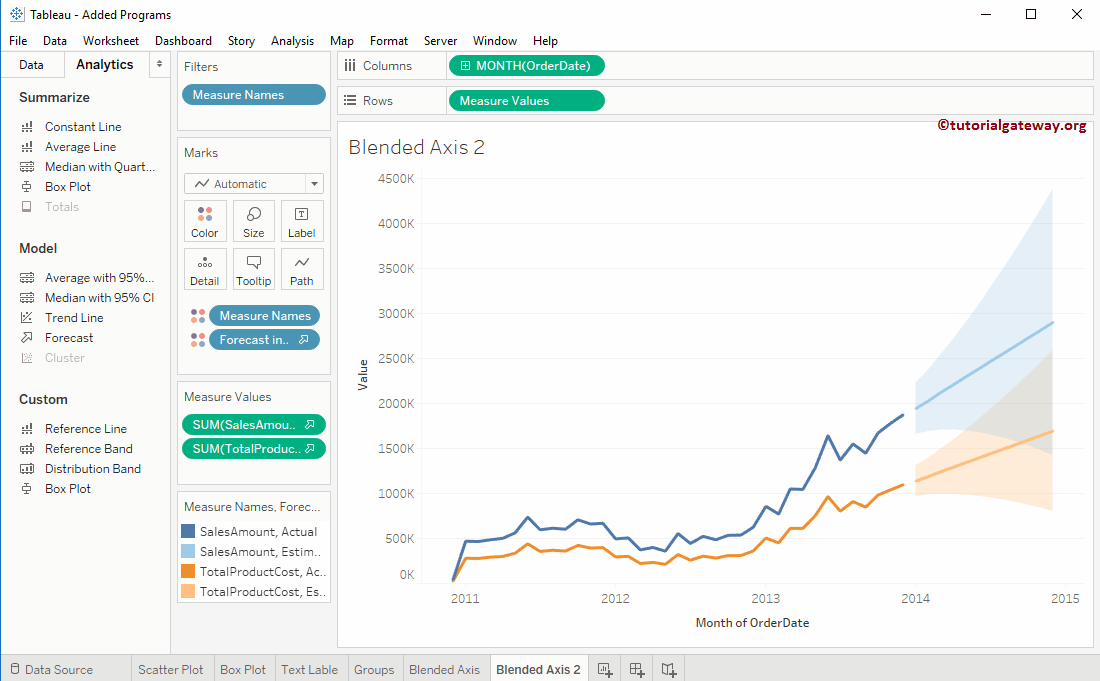
Add Analytics to Tableau Blended Axis Report
To add analytics, please navigate to the Analytics tab and double-click on the Forecast option under the Model section.
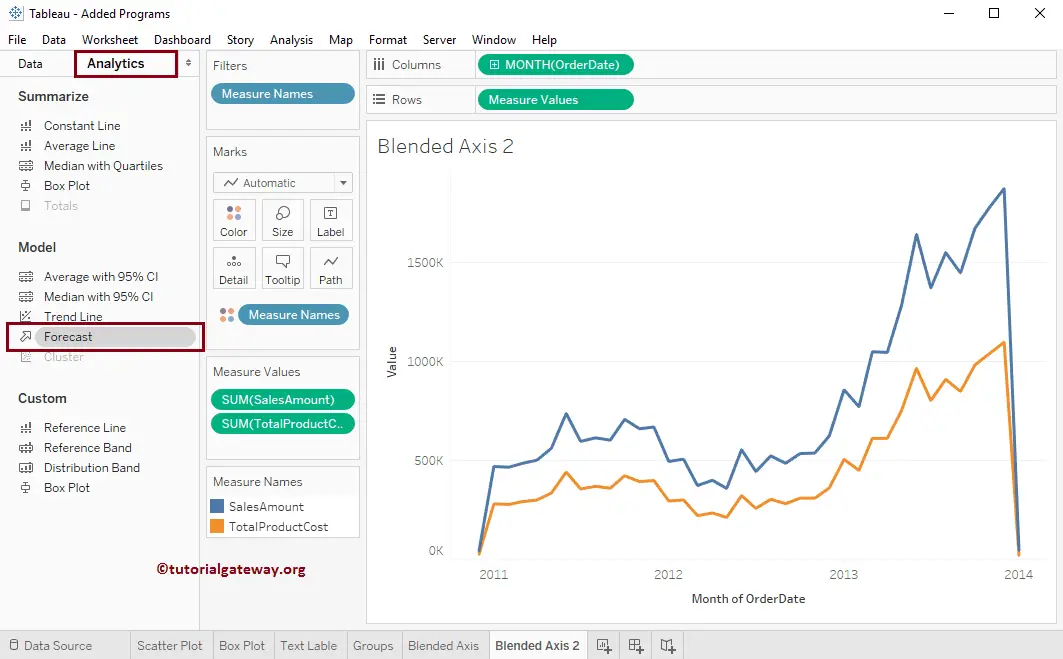
Once you double-click on the Forecast option, the Forecast will be added to a chart. I hope you understood the creation of Blended Axis and adding a forecast.