Tableau Bins are useful for creating a range of data, similar to SQL Buckets. This article will show you how to Create Bins with an example.
To create bins in Tableau, we will write the Custom Query against the SQL Server Data Source. Please visit the Connecting to SQL Server article to understand the configurations. The Custom SQL query we are going to use for this Tableau report is:
SELECT Prod.Productkey, Prod.EnglishProductName,  Prod.Color,
       Prod.DealerPrice, Fact.OrderQuantity,  Fact.TotalProductCost,  Fact.SalesAmount
FROM DimProduct AS Prod
INNER JOIN FactInternetSales AS Fact ON Prod.ProductKey = Fact.ProductKey
Create Tableau Bins
Before we start creating bins, we need a report. First, Drag and Drop the Product Key from the Dimension Region to the Rows Shelf. Next, drag and drop the Sales Amount from the Measures Region to the Field region. Since it is a Measure value, the Sales Amount will aggregate to the default Sum.
Once you drag them, the table report will be generated. You can observe that there are 158 rows. In this Tableau bins example, we are going to create Buckets on the Product Key.
As we know, the numeric bucket is a group of equal sized data. So, please right-click on the Product Key dimension, select the Create option, and choose the below-shown option from the context menu.
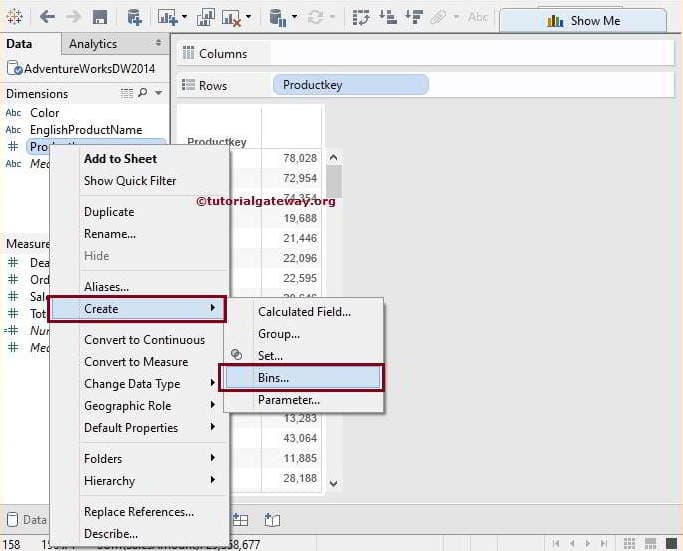
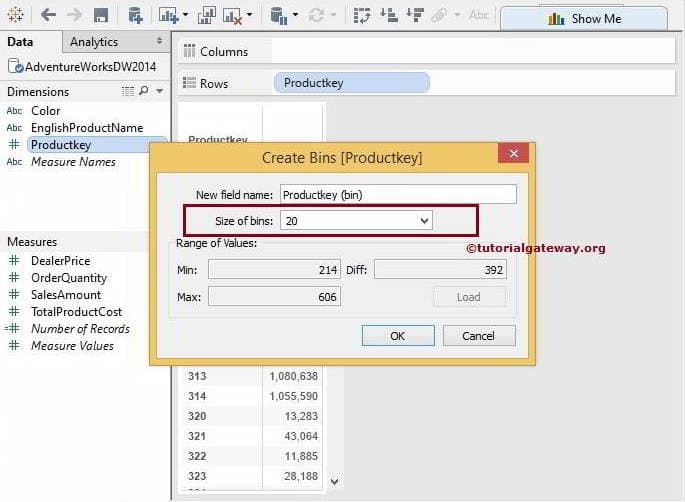
Once you select the option, a new window called the Create Bins dialog box will open with the default Name and the default size of 10.
If you don’t know the Tableau Bin size, click on the Load button. The desktop will display the Minimum, Maximum, and Difference values and the best possible size by clicking this button. For now, we are using the Static Number 20 as the Size and clicking OK to merge data into groups.
It shows the newly created Bin in the Dimension section. Please replace the Product Key dimension with the Product Key Bucket on the Row Shelf.
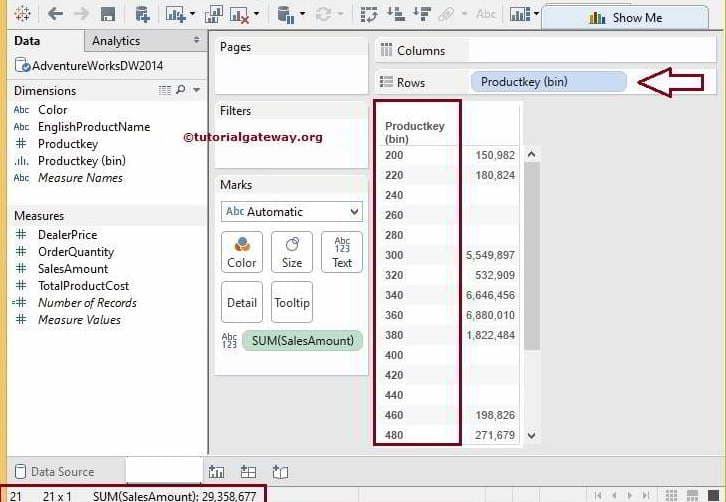
From the above Bins screenshot, you can observe that Product Key Data is organized into Buckets, and the total rows are only 21. Drag and drop the Product Key dimension to the Row Shelf to display the product keys available in each group.
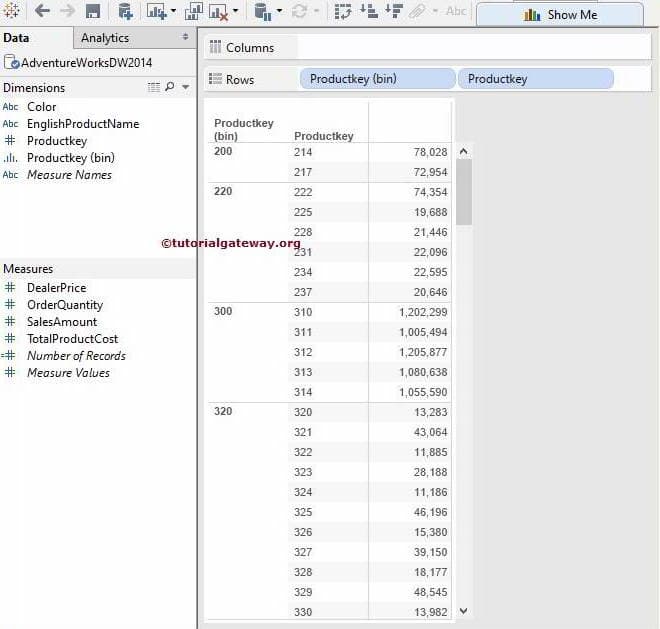
From the above screenshot, you can see the newly created one in the table report.
How to Delete Tableau Bins
It is effortless and straightforward to delete the Bins. To do so, select the one you want to delete and right-click on it to open the context menu. Here, it is Productkey(bin), please select the Delete Option from teh context menu.
Create a Stacked Bar Chart Using Bins
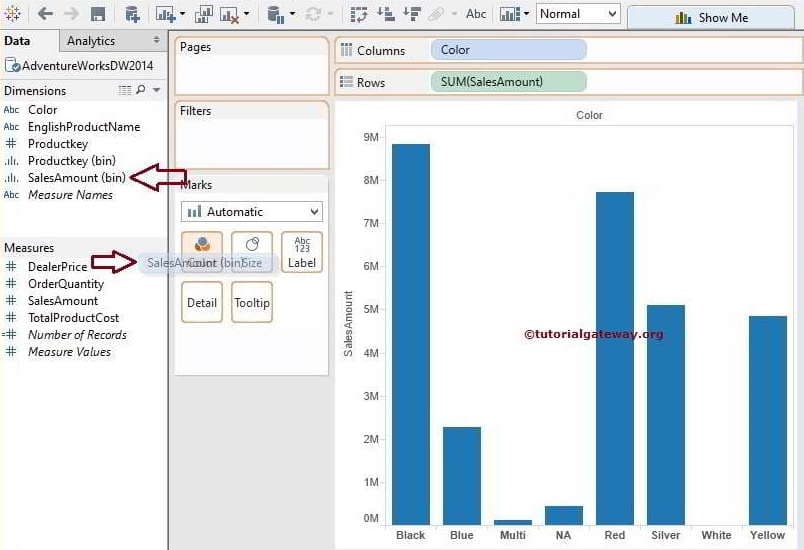
This Tableau desktop tool allows us to create Bins on both Dimensions and Measures, and in this example, we will generate a Measure value. Using that value, we create a Stacked Bar Chart. The following screenshot will show you the Default Bar Chart with Color dimensions on the Row Shelf and the Sales Amount on the Column Shelf.
Right-click on the Sales Amount Measure and select the Create Bins option from the menu. Now, we are using the default bin size generated by the Desktop (i.e., 357.598).
Next, drag and drop the newly created Sales Amount bucket from the Dimension region to the Color Option in the Marks Card.
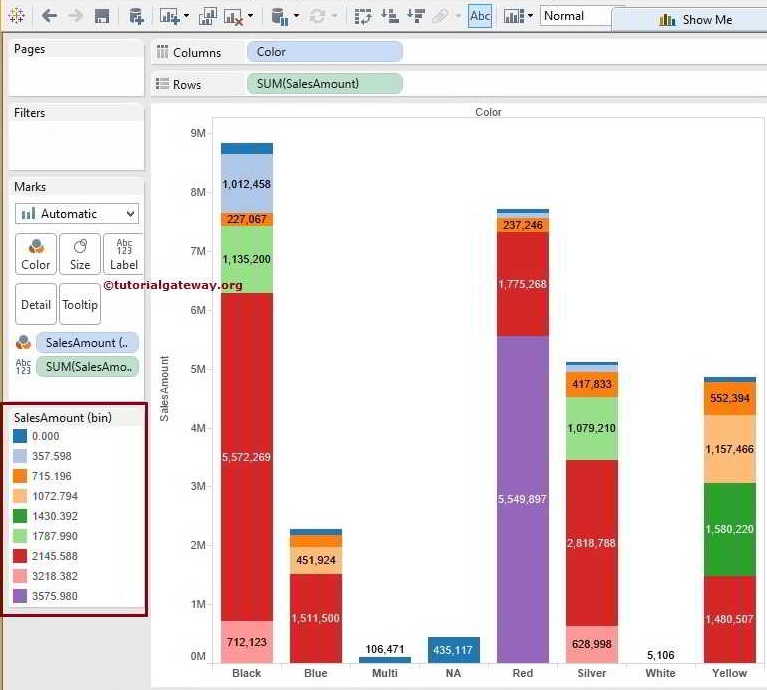
Once you complete it, you can see the Stacked Bar Chart. The Desktop allocates default colors to stacked bars, but you can edit the colors by selecting the Edit Colors.. option. For more Charts >> Click Here.
Let us add the Data Labels and see whether we successfully created the stacked bar charts using the Bins or not.
Comments are closed.