In Tableau, we can create Pivot data (also called Text Labels or Crosstabs) by placing one dimension on the Column shelf and another dimension on the Row shelf. Let us see how to create a Text Label with an example.
For this Text Label demo, we will write the Custom Query against the SQL Server Data Source. I suggest you refer to the Connecting to SQL Server and Charts article to understand the Tableau configurations. The custom SQL query that we are going to use for this report is:
SELECT ProdCat.EnglishProductCategoryName,
       ProdSubCat.EnglishProductSubcategoryName,
       Geo.EnglishCountryRegionName, Geo.StateProvinceName, Geo.City, Geo.PostalCode,
       Geo.IpAddressLocator, Prod.EnglishProductName, Prod.Color, Prod.DealerPrice,
       Cust.FirstName,  Cust.LastName, Cust.Gender, Cust.YearlyIncome,
       Cust.EnglishEducation, Cust.EnglishOccupation, Fact.OrderQuantity,
       Fact.TotalProductCost, Fact.SalesAmount, Fact.TaxAmt, Fact.OrderDate
FROM DimProductSubcategory AS ProdSubCat
INNER JOIN DimProduct AS Prod ON ProdSubCat.ProductSubcategoryKey = Prod.ProductSubcategoryKey
INNER JOIN DimProductCategory  AS ProdCat ON ProdSubCat.ProductCategoryKey = ProdCat.ProductCategoryKey
INNER JOIN FactInternetSales AS Fact ON Prod.ProductKey = Fact.ProductKey
INNER JOIN DimCustomer AS Cust ON Fact.CustomerKey = Cust.CustomerKey
INNER JOIN DimGeography AS Geo ON Cust.GeographyKey = Geo.GeographyKey
Create a Tableau Text Label
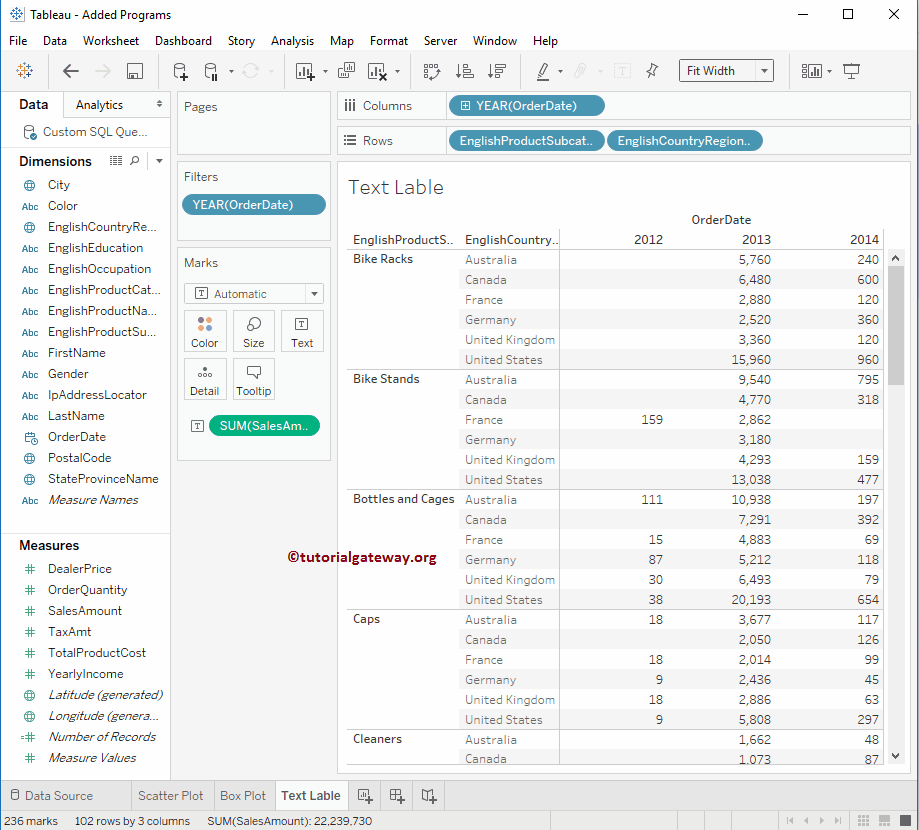
In this example, we will create a text label. For this, first, drag and drop the English Product Subcategory Name from the Dimensions Region to the Rows Shelf and Order Date (Year) to the Column Shelf.
Next, drag and drop the Sales Amount from the Measures Region to the Text field present on the Marks Shelf.
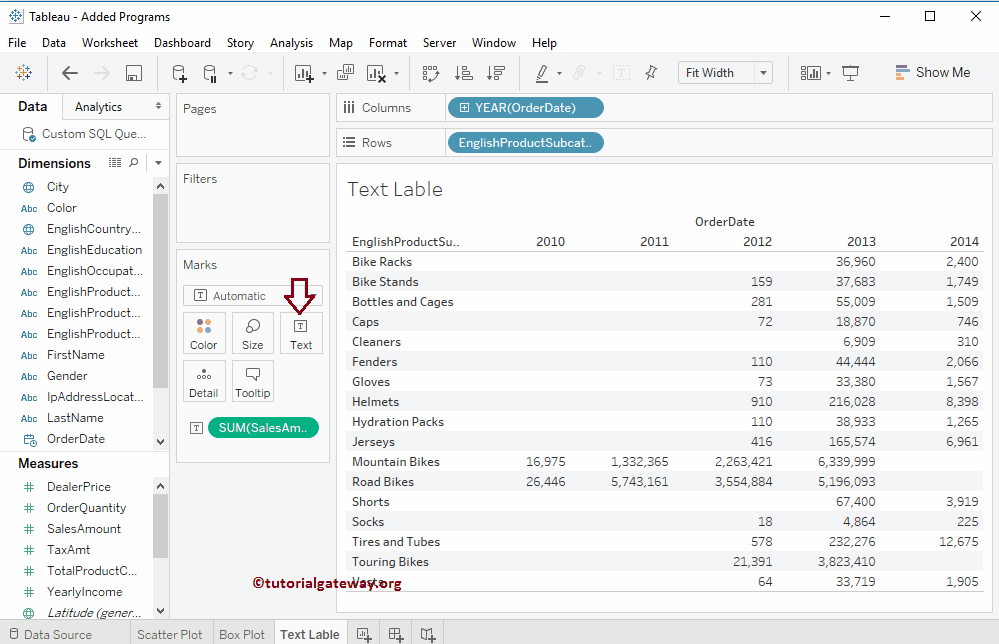
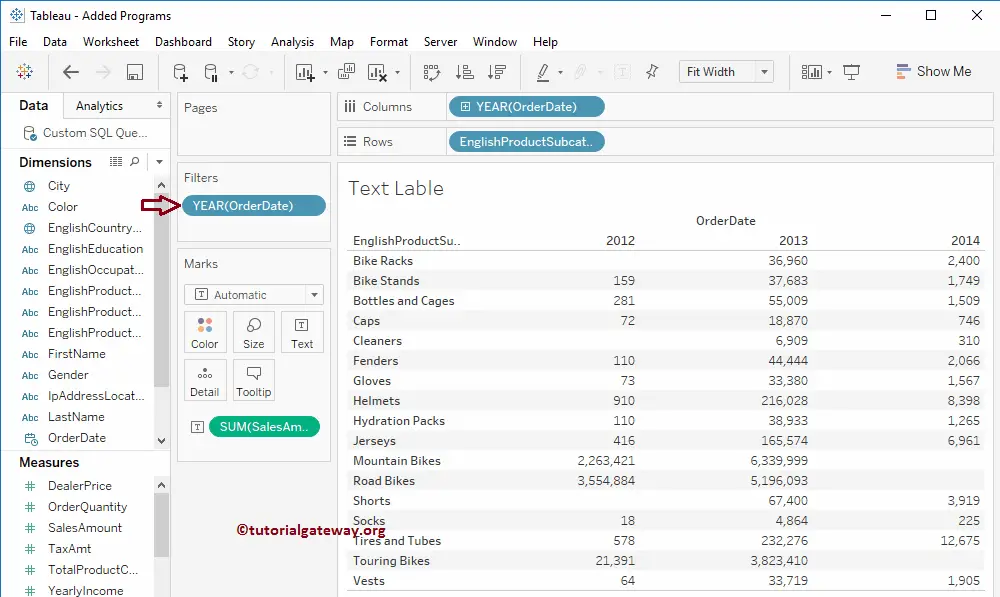
From the above screenshot, we don’t have much data for the years 2010 and 2011. So, we excluded those years by selecting those columns in a report and choosing the Exclude option from the tooltip.
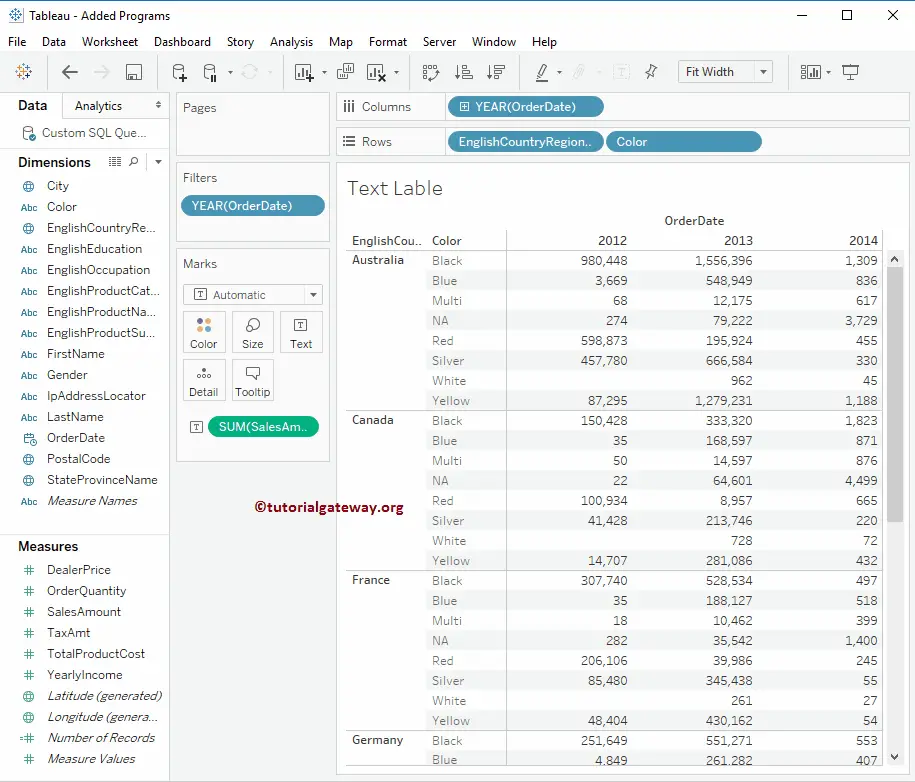
Next, drag and drop the English Country Region Name from the Dimensions section to the Rows Shelf on the left side of the product subcategory.
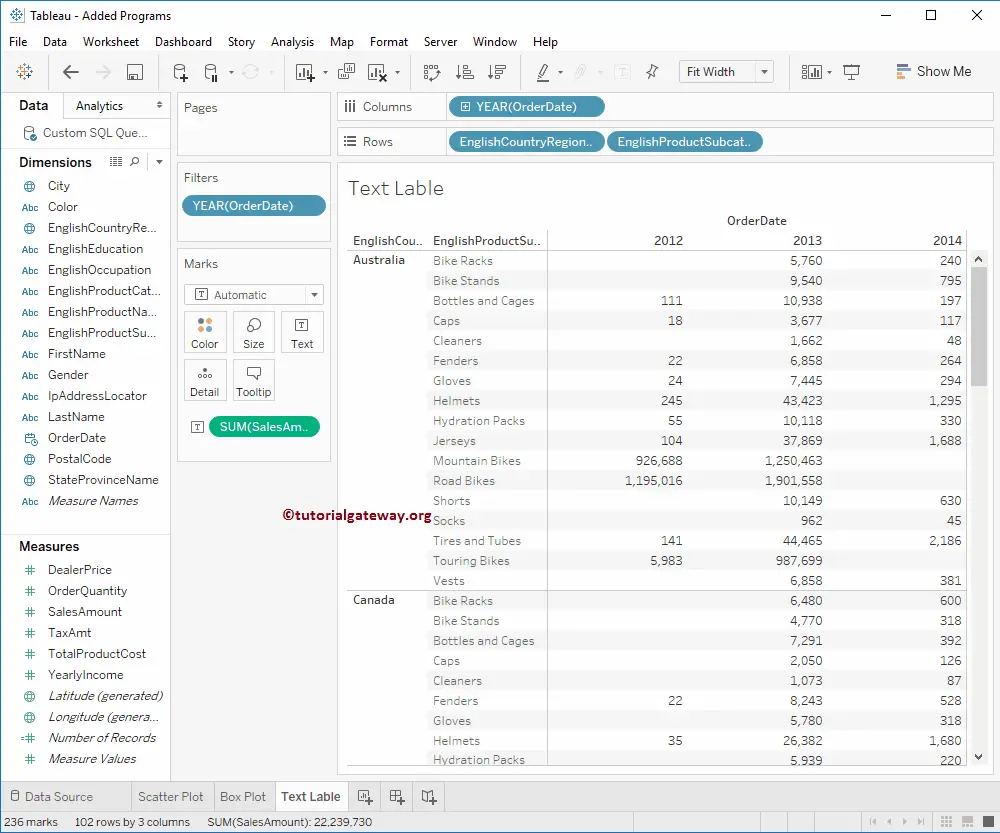
The above screenshot shows the complete Tableau Text Label crosstab report. Let us interchange the positions of the dimensions in the Row shelf.
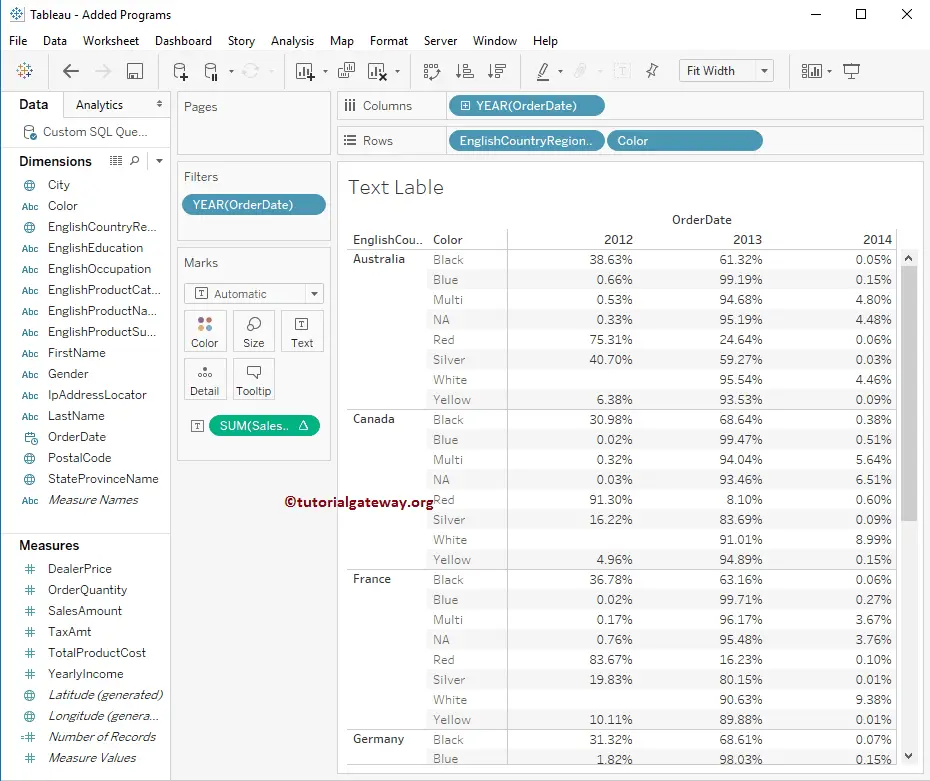
Here, we replaced the product subcategory name in the row shelf with the color dimension.
- Add Row and Column Totals.
- Add Subtotals and Grand totals.
- Formatting options.
- Alternative Row colors.
- Alternative Column Colors.
- Table Report
- Matrix or Crosstab.
Add Table Calculation to Tableau Text Label
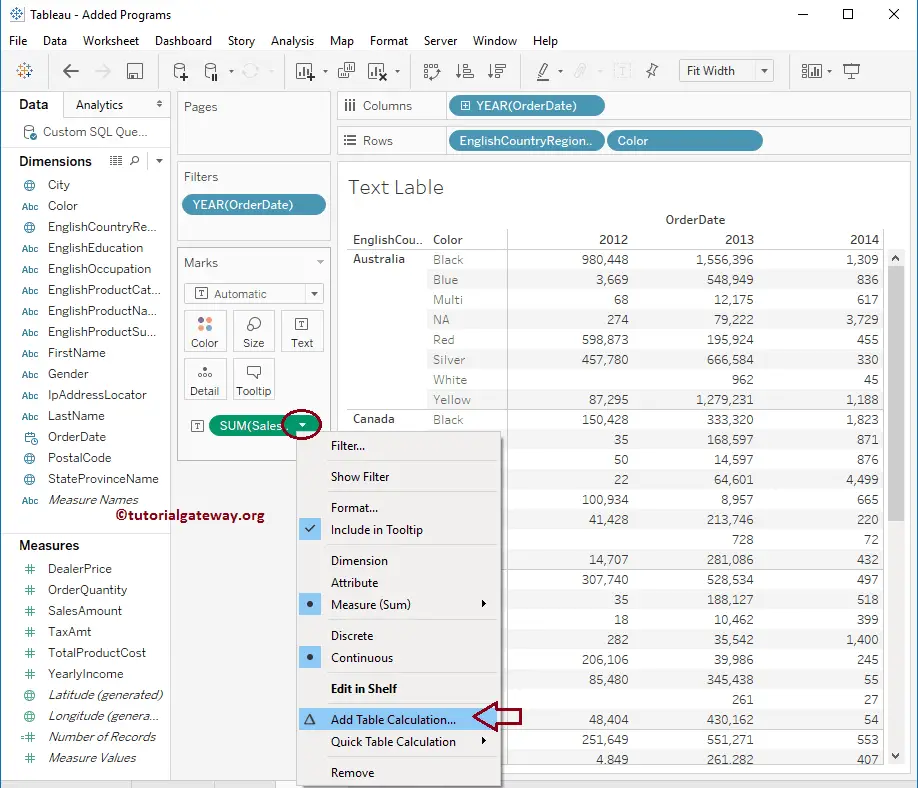
To add the table calculation as a text label, please select and right-click on the Sales Amount measure (change as per your requirement), which will open the context menu. You must choose the Add Table Calculation option, as shown below.
Once you select the Add Table Calculation option, a new window called Table Calculation will open. Here, we choose the Calculation Type as the percent of the Total and Computed by Table (crosstab). Remember, we will discuss the Table calculations in another article, and here, we will only focus on the crosstabs report.
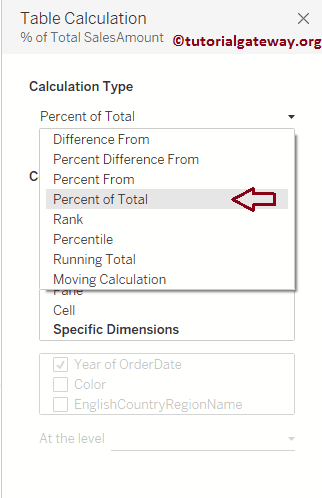
The following screenshot will show you the Tableau text label, the Crosstab report, and the Percentage total. As you can see, we got the maximum percentage of sales in 2013 compared to 2012 and 2014.