Table Report in Tableau is one of the common ways to display your data. In this article, we will show you how to create a Table Report with an example.
To demonstrate this Table report, we will use the data source we created earlier. So, please visit the Data Labels in the Reports article.
Create a Tableau Table Report
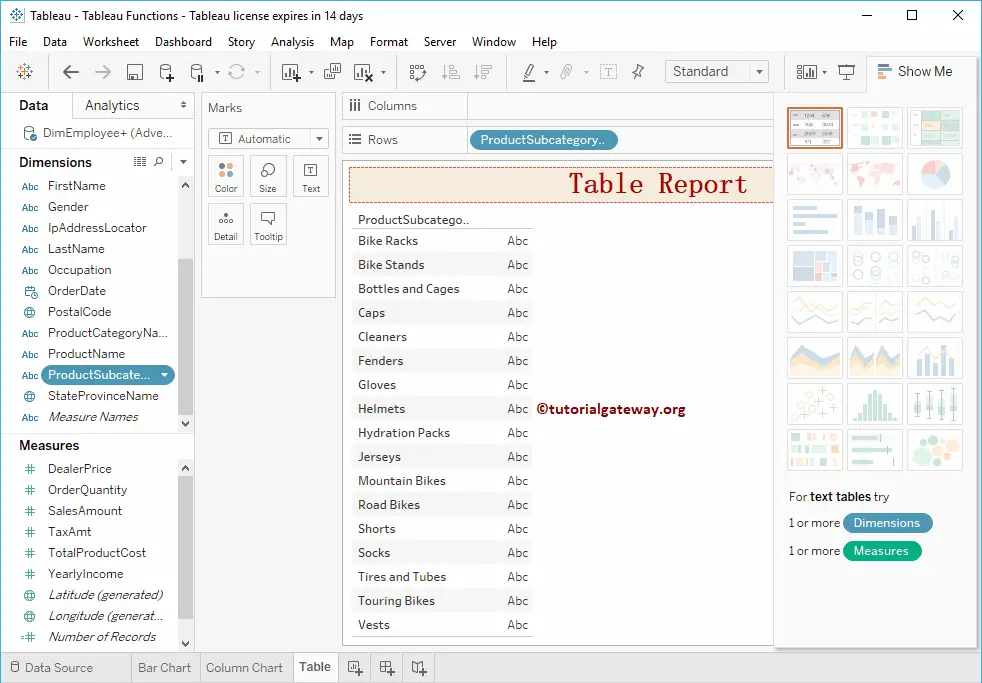
In this example, we are going to create a table. This can be done in two ways. When you select the Product Subcategory Name from the Dimensions Region, it will automatically select a Text label for you.
Clicking the text label will create a Table for you.
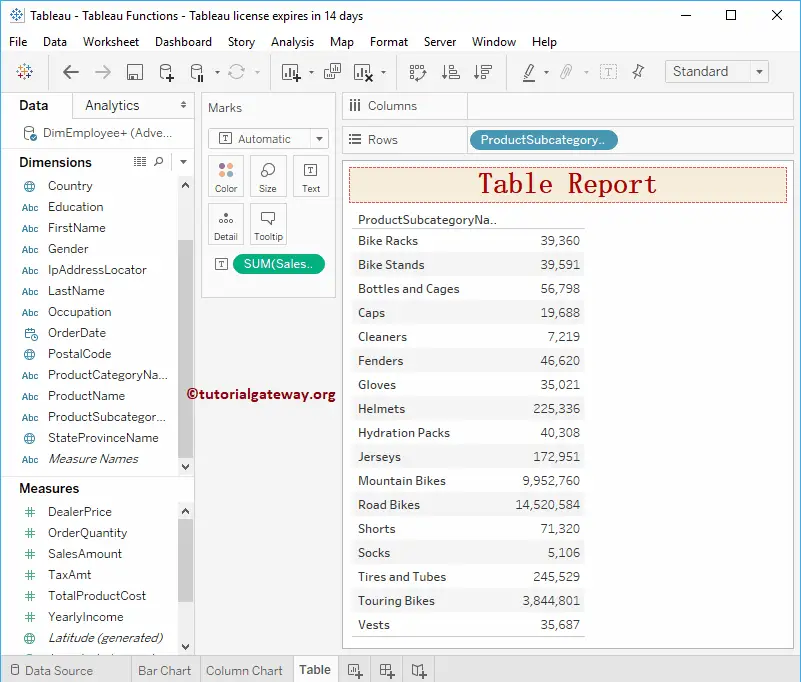
Next, drag and drop the Sales Amount from the Measures Region to the Text field present in the Marks Shelf. Now you can see the table report.
- Add Row and Column Totals.
- Add Subtotals and Grand totals.
- Formatting options.
- Matrix or Crosstab.
- Alternative Row colors.
- Alternative Column Colors.
Create a Table Second Approach
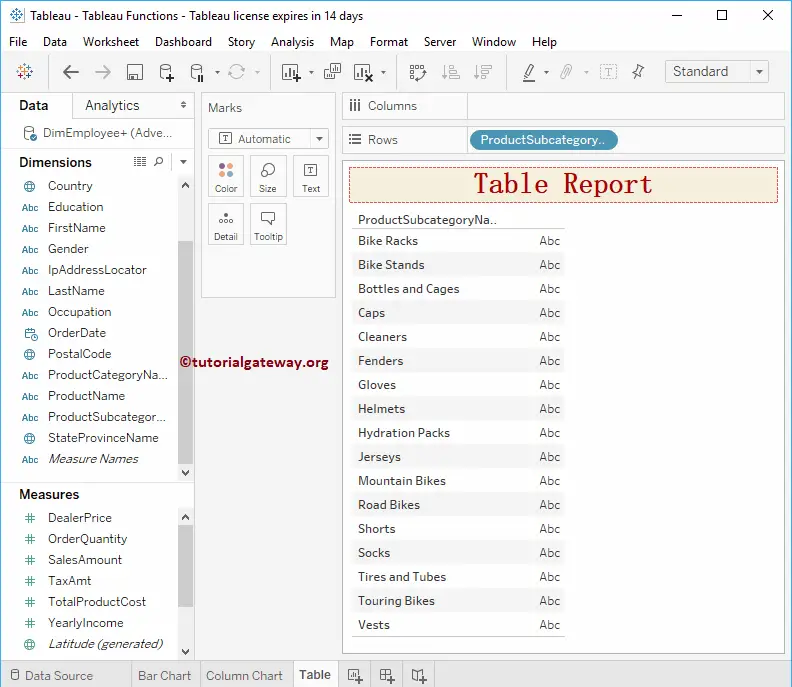
Dragging any Dimension field to the Rows section will automatically create a Tableau table report for you. Let me drag the Product Sub-category Name from the Dimensions Region to the Rows shelf. You can see the Table report on the Desktop.
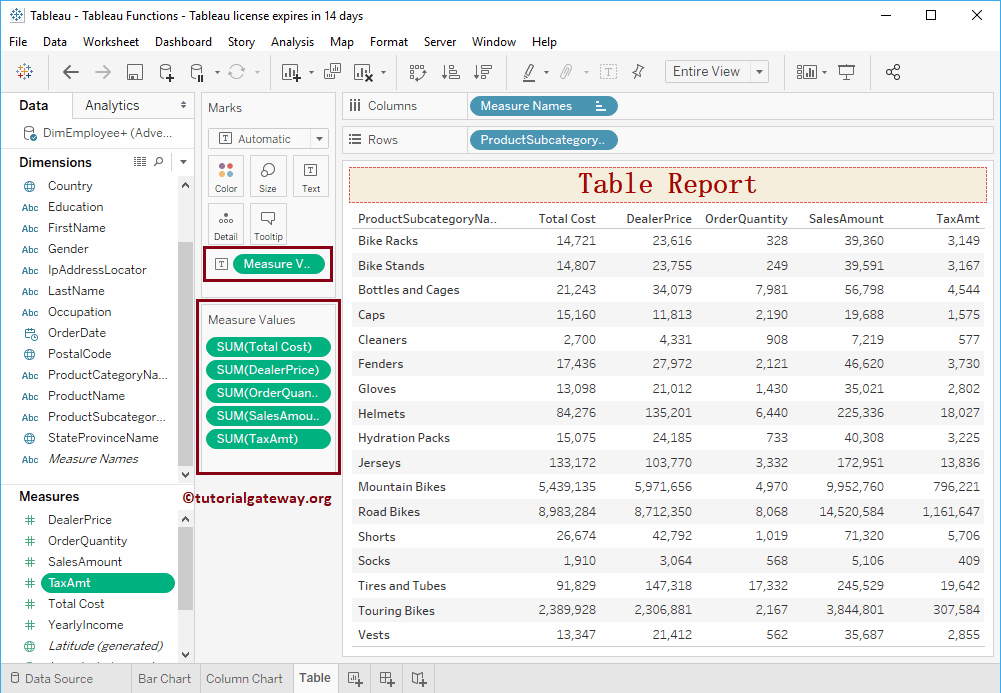
Next, we added the sales Amount to this table. And then, let me add a few more Measures, such as Total product Cost, Order Quantity, and Tax Amount.