Table Crosstab is the best way to display data on a multi-level. This article will show you how to create a Tableau Crosstab or matrix report with an example.
For this Crosstab demonstration, we will use the data present in the Global Super Store Excel Worksheet. So please refer to the Connecting to Excel Files article to understand the connection settings.
Create a Tableau Crosstab Matrix Report
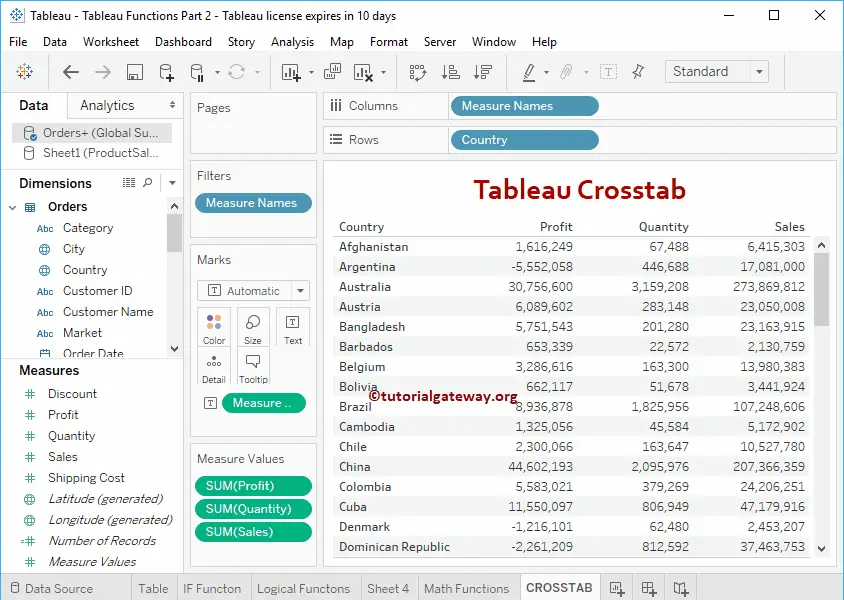
Dragging any Dimension field to the Rows section will automatically create a table for you. Otherwise, selecting the Text label will do the trick. Let me drag Country from Dimensions Region to the Rows shelf. Next, drag and drop the Quantity from the Tableau Measures Region to the Text field present in the Marks Shelf. Now you can see the table report.
Let me add the Sales field to the Measures shelf. Similarly, add one more Measure called Profit to the Tableau Crosstab matrix report.
- Add Row and Column Totals.
- Add Subtotals and Grand totals.
- Alternative Row colors.
- Alternative Column Colors.
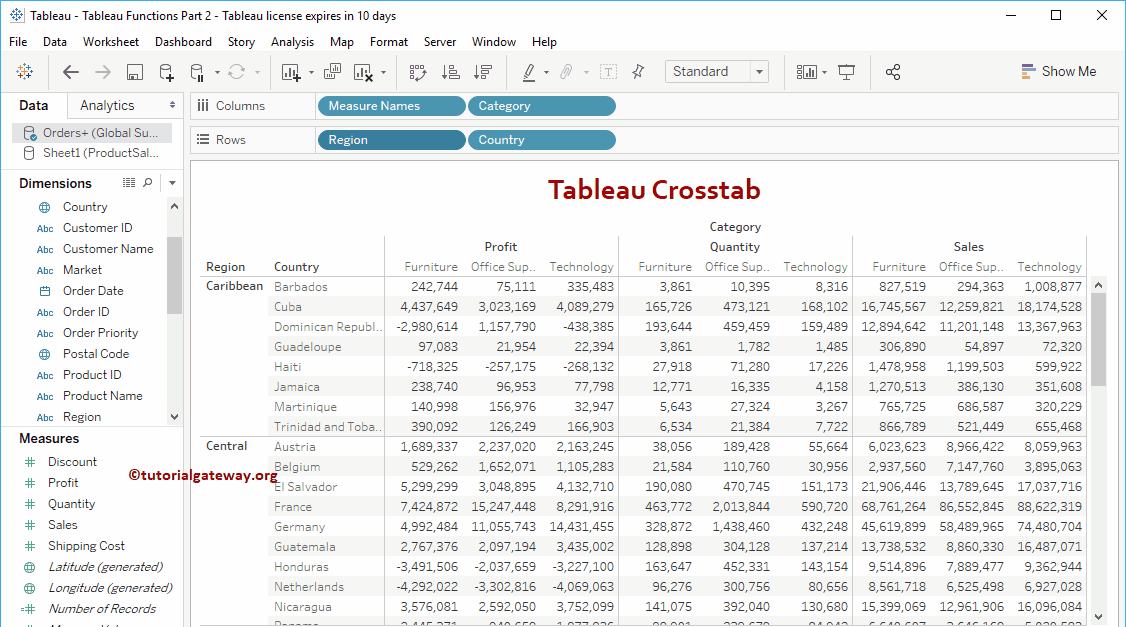
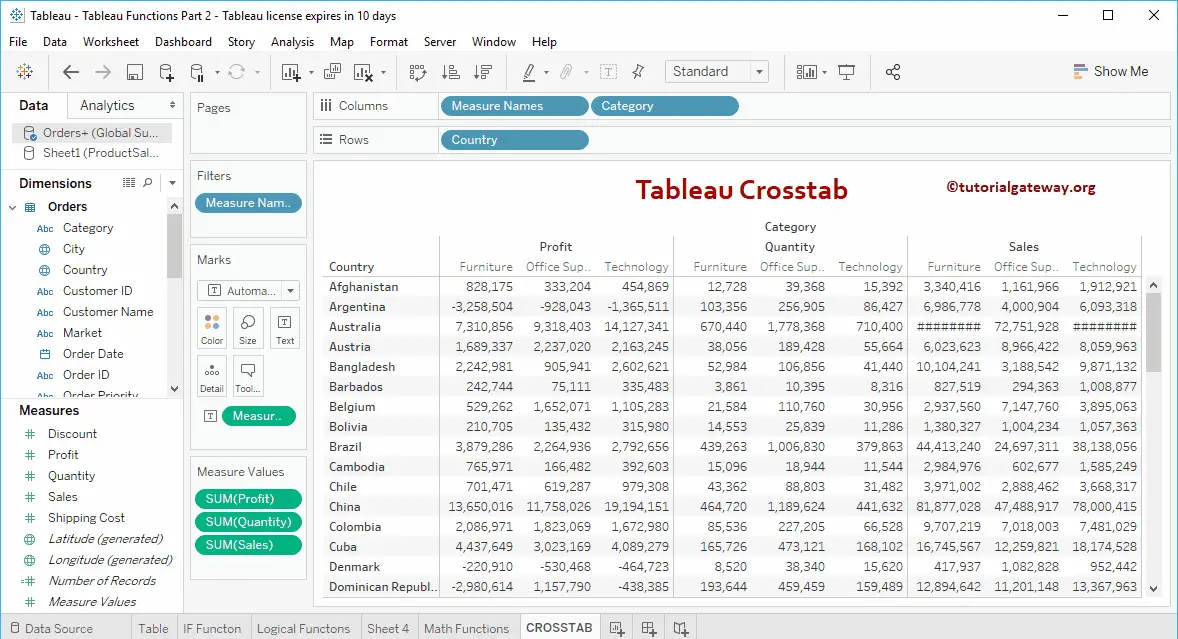
To convert this Table to a Matrix. Drag and drop the category field to the Columns Shelf. Now, you can see the Matrix or crosstab.
Let me add one more dimension (Market) to the Column’s shelf
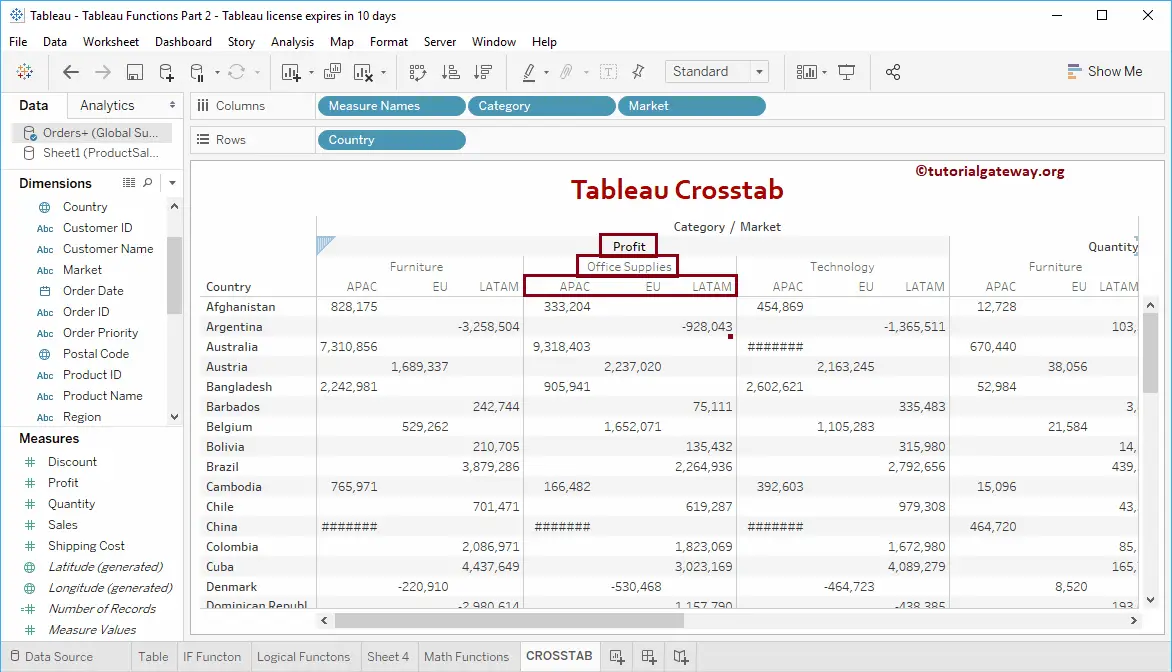
You can also add fields on the Rows shelf to group row fields