This Tableau article explains all possible formatting options, including font styles, numbers, alignments, borders, alternative row and column colors, etc.
To demonstrate the Tableau formatting option, we used the DimProduct, DimGeography, DimProductCategory, DimProductSubcategory, and FactInternetSales tables from the Adventure Works Dw database. Please visit the SQL Source and SQL Tutorial article to understand the Data Source.
Tableau Formatting
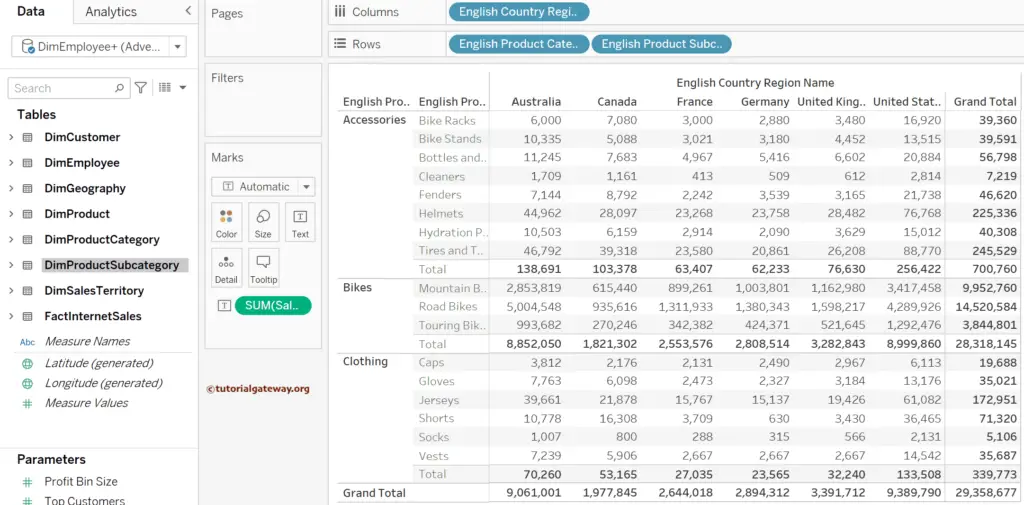
As we can cover more formatting options via Tableau table or cross tab report, we will create the same. For this, drag and drop the English Country Region Name to the Columns shelf and the Product Category and Subcategory dimensions to the Rows Shelf. Next, add the Sales Amount Measure to the Text shelf, creating the following table report. For the remaining charts in Tableau, please click here.
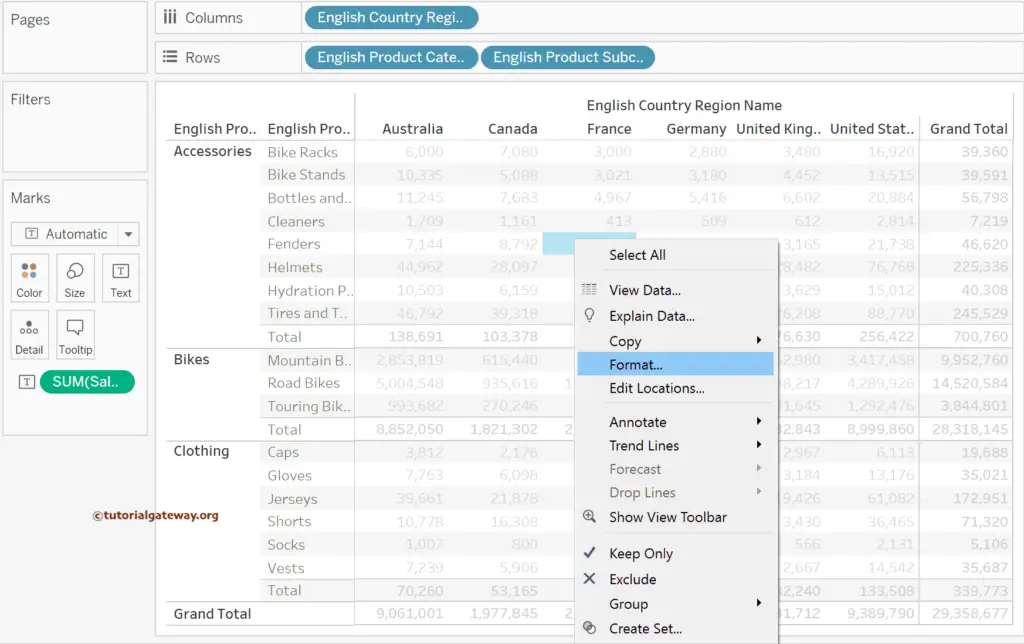
There are two ways to format any report in Tableau. The first option is to click any part of the report and choose the format option.
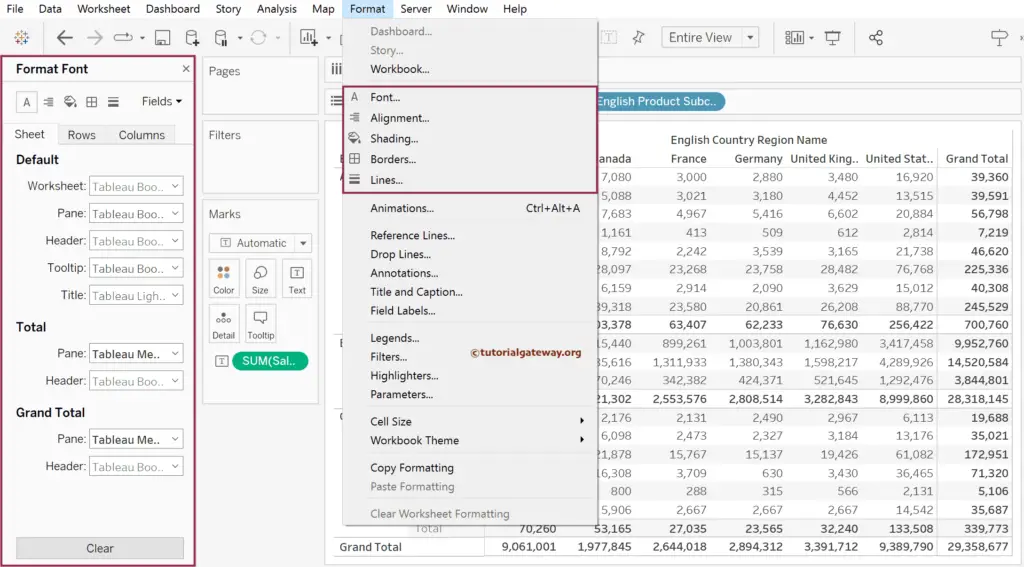
It shows the following Format tab with multiple buttons: A stands for font styles, line button for alignment, paint button to shade, square box for borders, and line button for lines. The second option to access this tab is using the Format Menu. As you can see, it has all the options, and you can click any option to navigate directly to that tab.
Use the Fields to format a chosen Tableau Measure or Dimension field. Apart from the five buttons mentioned above, there are three tabs for each button, and they are:
- Sheet – Changes will apply to the whole sheet.
- Rows – Top work with rows. For instance, row alignment, font, row banding, etc.
- Columns – Top work with columns. For example, column fonts, alignment, borders, column banding, etc.
Format Tableau Report Font (A)
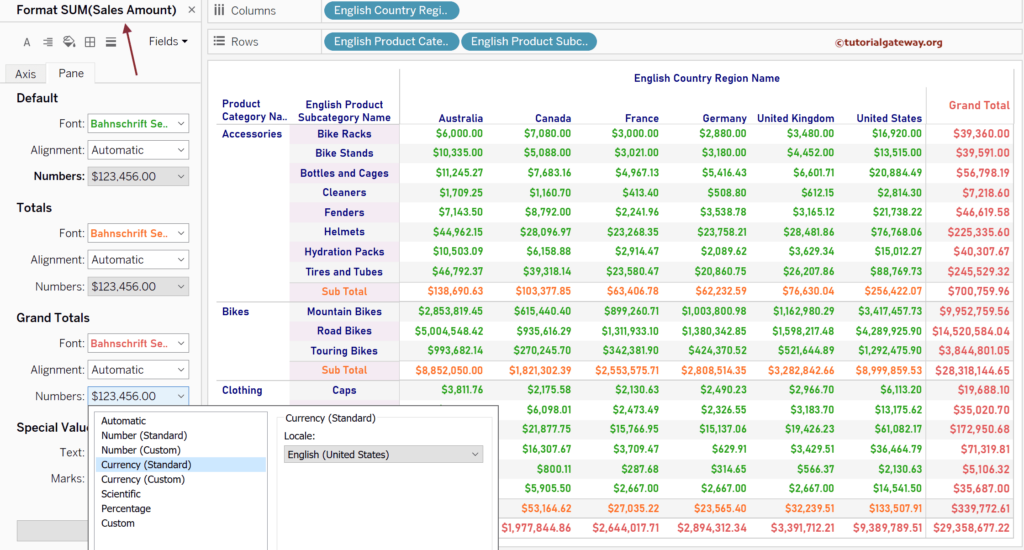
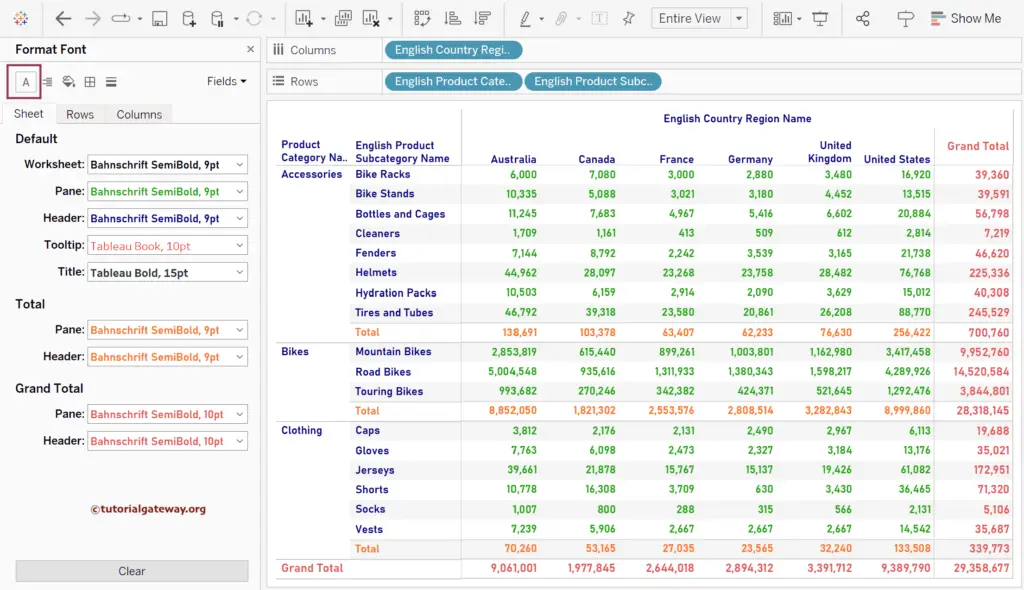
This button is to format the Font Style, Font Size, Font Color, Underline, Bold, and Italic. Let me do some quick formatting by adding distinct colors to each section so that you can distinguish them with the naked eye.
- Worksheet – The changes will apply to the complete worksheet.
- Pane – All the numeric values. Sales of all Countries.
- Header – Column names, i.e., English Product Category, Subcategory, and Country Name.
- Tooltip – Format the tooltip when the mouse hovers on any cell.
- Title – Format the Report title.
- Total – It deals with each pane’s actual Row total value, i.e., Product Category.
- Header – The name of the pane total, i.e., Total.
- Grand Total is the total sum of row total as Row grand total and the total sum of columns as the Column grand total. Use this Tableau section to format the Complete total.
- Header – The name of the grand total, i.e., Grad Total.
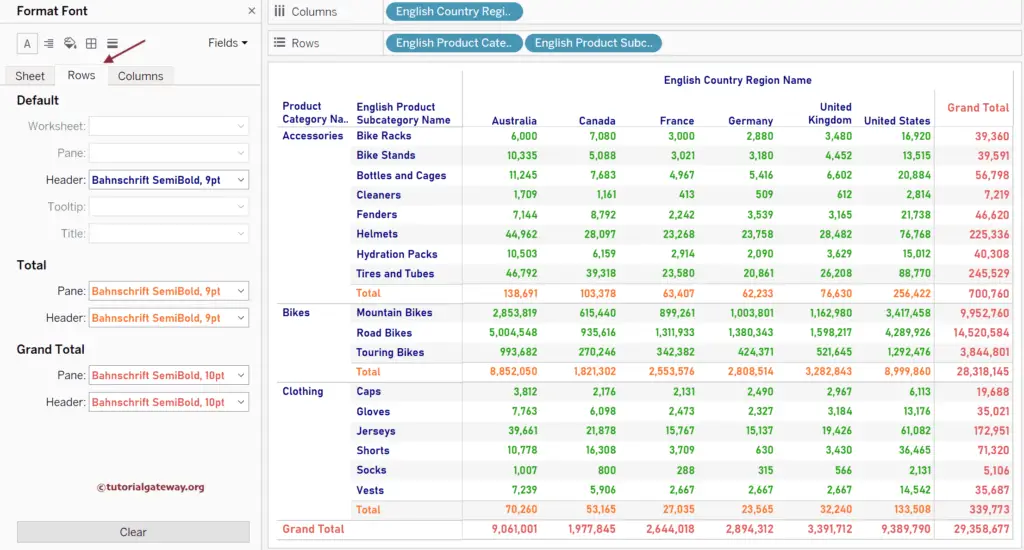
If you go to the Rows tab, you can see the rows-related font formatting options for the Row header and total. Similarly, if you click the Columns tab, you see the column-related font formatting options.
Alignment
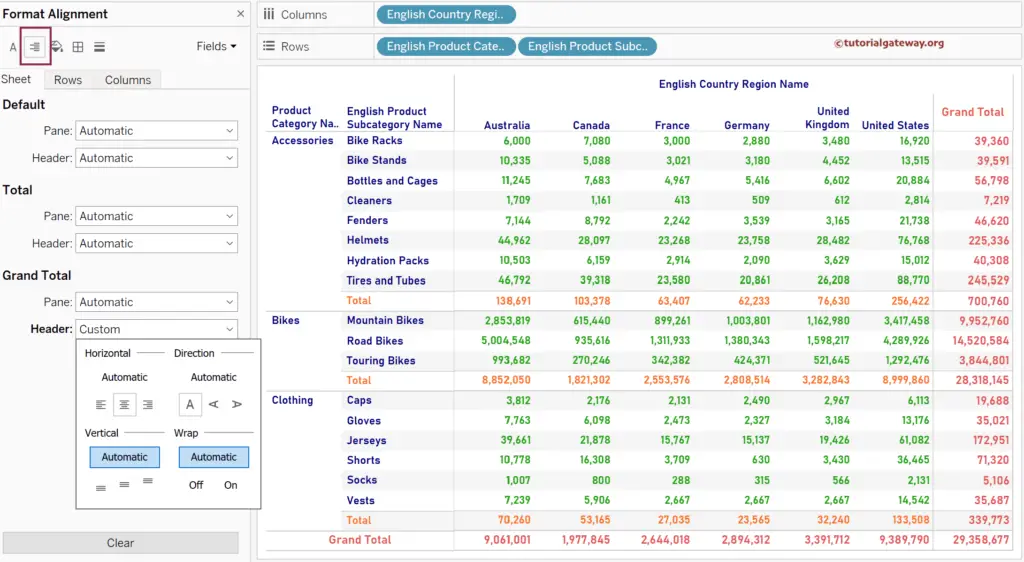
Use this button to align the text as per the requirement. By default, Tableau uses the best possible alignments to fit them inside the cell. However, you can change the alignment of the Dimension labels and measure values, headers, and totals.
To show the available Tableau Formatting options, let me click the down arrow beside the Header of the Grad total. You can see that you can align left, center, right, horizontal, and vertical with left and right faces, vertical text position compared to the cell, and wrap the text within the cell or not.
Shading
Use this Tableau button to provide or format background colors to the rows, columns, headers, row totals, column totals, and the complete sheet. We have already covered the total and Grand total concepts in the Font section. We assigned distinct colors to each property to show you the difference in each property.
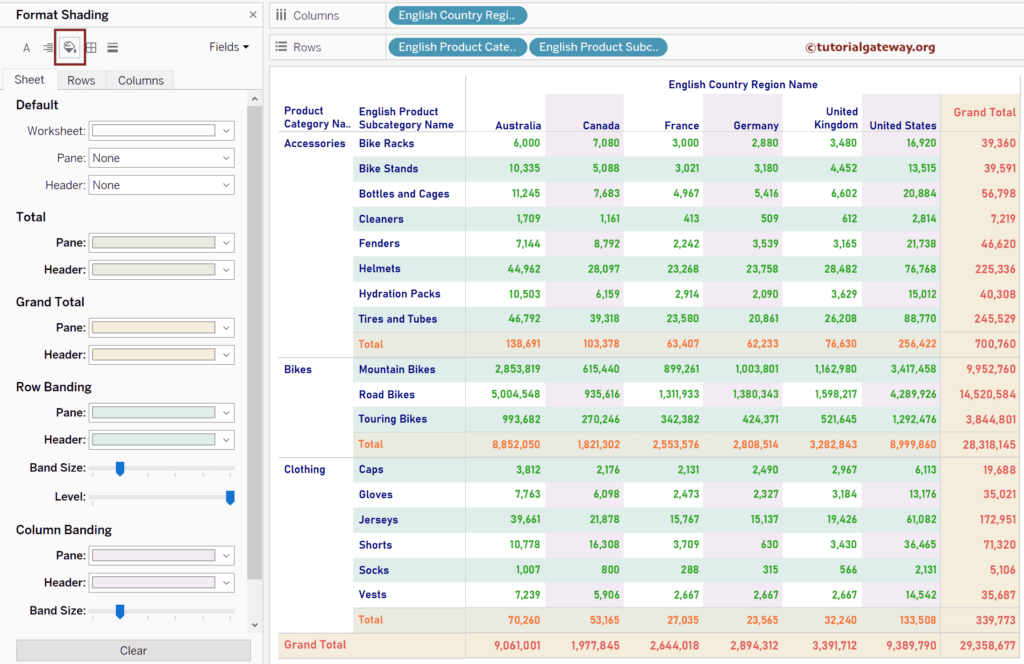
Apart from the totals, there are two options: Row Banding and Column Banding to add the alternative row and column colors. For instance, the Row Banding property provides alternative row colors.
- Pane: Provide an alternative color to the pane or measure values (sales).
- Header: Provide alternative color to Subcategory Name.
Increasing the Band Size by one step provides an alternative color for every two rows. Similarly, the column banding provides alternative column colors.
Format Tableau Report Borders
This section helps to format Borders, including each cell, totals, and headings.
- Row Divider: If the Level is in the middle, the lines will apply for each Category (Header, Accessories, Bikes, Clothing, Grand Total). If you drag the Level to the end(maximum), it will apply to all the rows.
- Column Divider – If the Level is minimum, it applies to the Column Header. If you drag the level slider to the end(maximum), it will apply to all the columns.
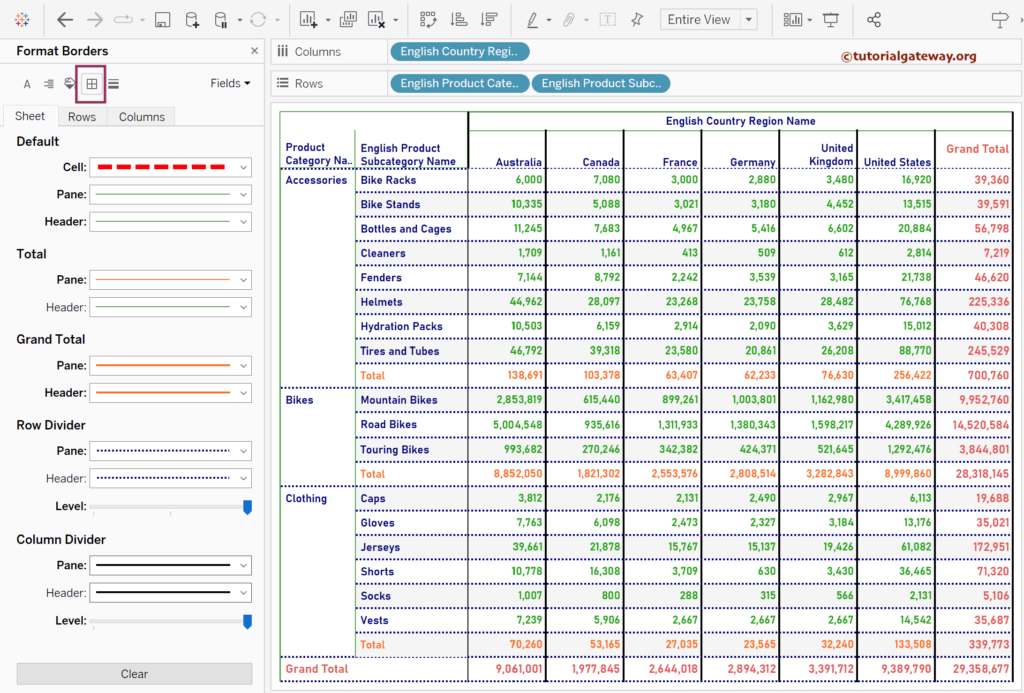
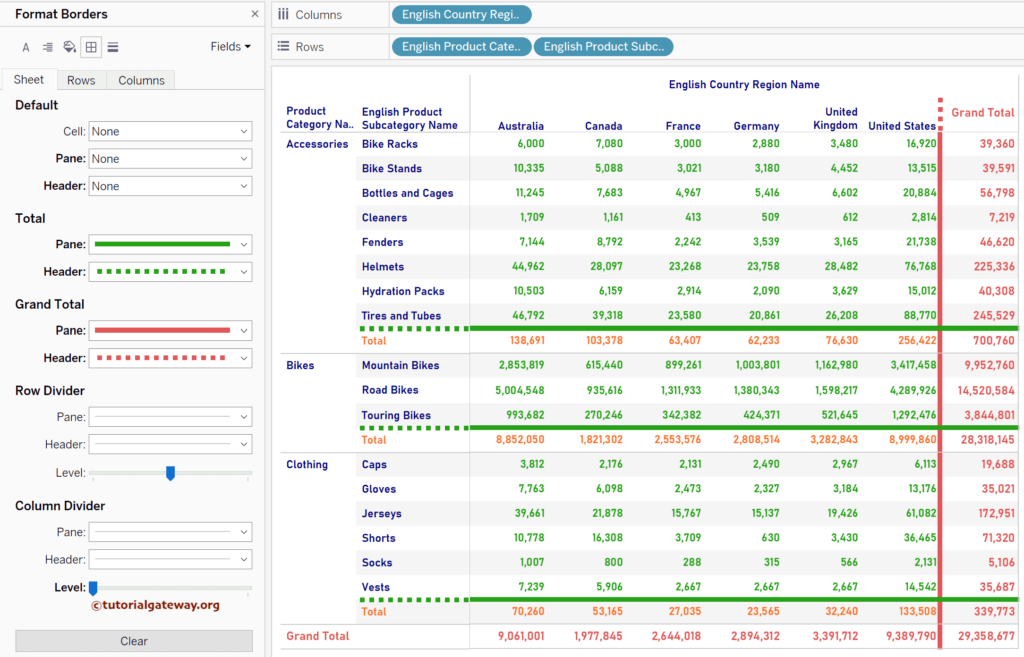
If you observe the above Tableau screenshot, there is no Formatting impact on the total and grand total borders because they are dominated by the row and column divider. To prove the same, let me click the clear button to set the borders to default and apply the border total and grand total. You can notice the change in the pane (solid line) and header(dotted line).
Lines
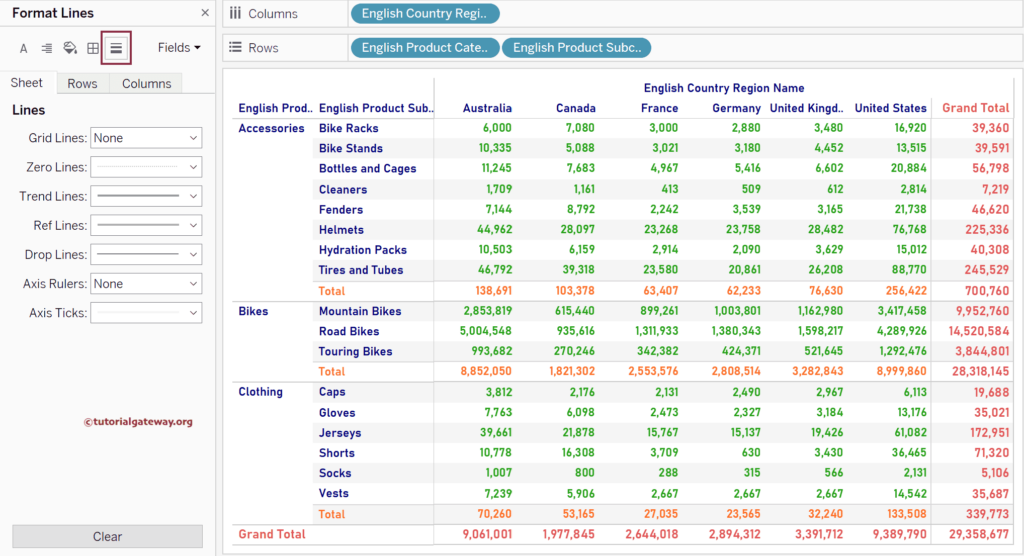
The Tableau lines section helps format the default lines based on the chart. For instance, some charts may note Zero lines or Grid Lines, and some may need them. Similarly, you may not need the axis tick marks or the rulers. In such scenarios, you can use this section to format the Grid, Zero, Trend Lines, Reference Lines, Drop Lines, Axis Rulers, and Axis Ticks.
Format Tableau Report Fields (Dimensions & Measures)
It helps to format the individual measure or dimension. Please click the down arrow to see and select the available dimension or measure from the report. As you can see, there are four fields (3 dimensions and one measure); let me choose the subcategory.
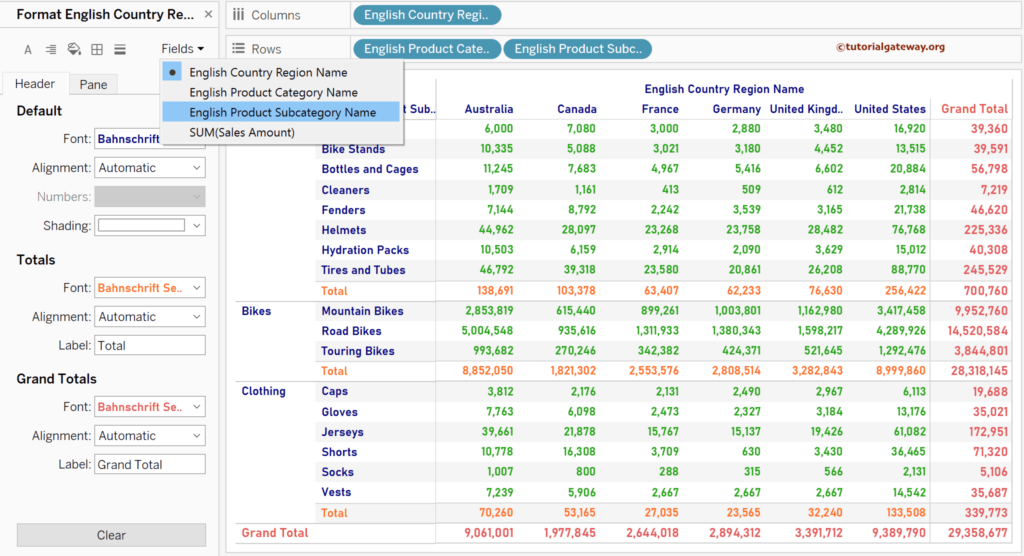
Let me change the font alignment to Center and the background color to light pink and change the Totals and Grand Totals. Remember, although we formatted the Grand Total, it won’t reflect the Tableau report because it belongs to the Category (not the subcategory).
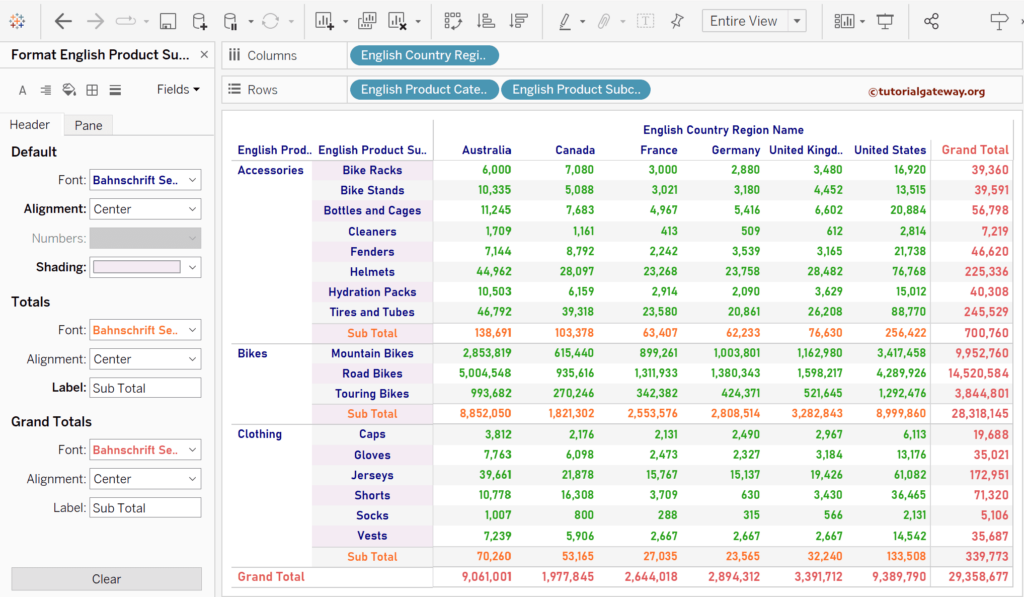
The setting will change if you select the Measure (SUM(Sales Amount). Please use this section to format numbers, currency, and alignment. If you see the font colors of Totals and Grand Totals, they both changed because we are working with measure. Wherever the sales value is, the formatting option will apply.
