In general, a Table or Matrix doesn’t need alternative column colors. However, in some cases, it will help you highlight the numerical values to see the difference, etc. This Tableau article shows how to add and remove alternative column colors to Matrix or Table using the Column Banding option present in the Format Menu.
To demonstrate this Tableau example, we use the below shown Matrix and add alternative column colors to them. To create the same, drag and drop the product category Name, English product subcategory Name fields to the columns Shelf, and English country Region Name to the column shelf. Next, add the Sales Amount to the Text shelf.
Add Alternative Column Colors in Tableau
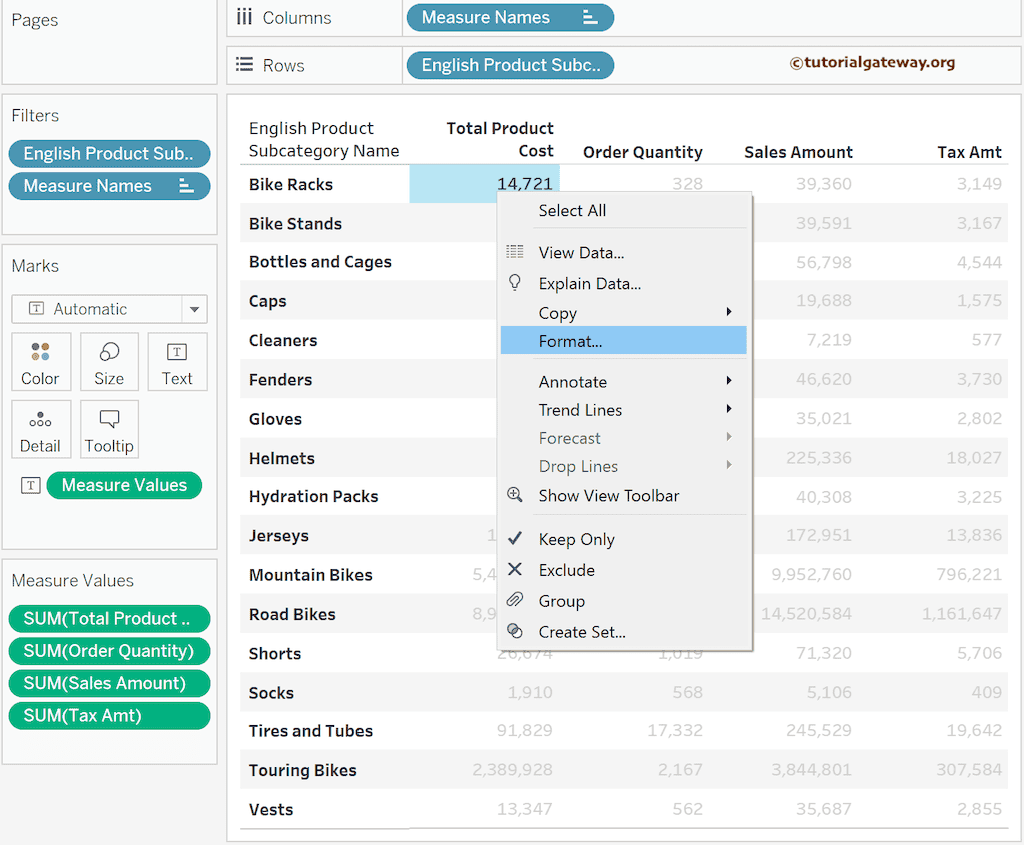
Click any cell in the matrix report to provide the alternative column colors and choose the Format option. Otherwise, Go to the Format Menu and choose the Shading option.
The Format Shading tab will be shown below. You can use this section to format any portion of the table or Matrix. In this Tableau example, our job is to add alternative column colors to the crosstab or matrix. So, use the Column Banding option in the Sheet or Columns tab.
- Pane: It adds the chosen color to the Numeric values. Here, color will add to the values under each country, not the country name. For example, 6000, 10355, etc.
- Header: It adds the chosen color to the English Country Region Name—for example, Australia, Canada, etc.
- Band Size: Choose the number of continuous columns the color has to apply.
- Level: Number of Nested Groups.
First, let me remove the alternative row colors by simply changing the Row Band Size to 0. Next, with the Column Banding section, use the drop-down menu beside the Pane to pick the color for the numbers.

In this Tableau alternative Column Colors example, Let me add the distinct colors to the Column Pane and Header; you can see the change within the crosstab report.
- Add an alternative row Color.
- Tableau.
- SQL Source.
- Matrix
- Table Report
- Add Row and Column Totals.
- Add Subtotals and Grand totals.
- Formatting options.
- Alternative Row colors.

Let me use a table with a Subcategory with four measure values to demonstrate the above-mentioned Column Banding settings. Choose and right-click on any cell and select the Format option from the context menu.
By default, it opens the Format tab with fonts. You must click the Shading button to see the below options. We use the Column tab this time, and you can see no Level option (greyed out). Please change the color of the Column Banding Colors of the Pane and Header to add alternative column colors to the table.
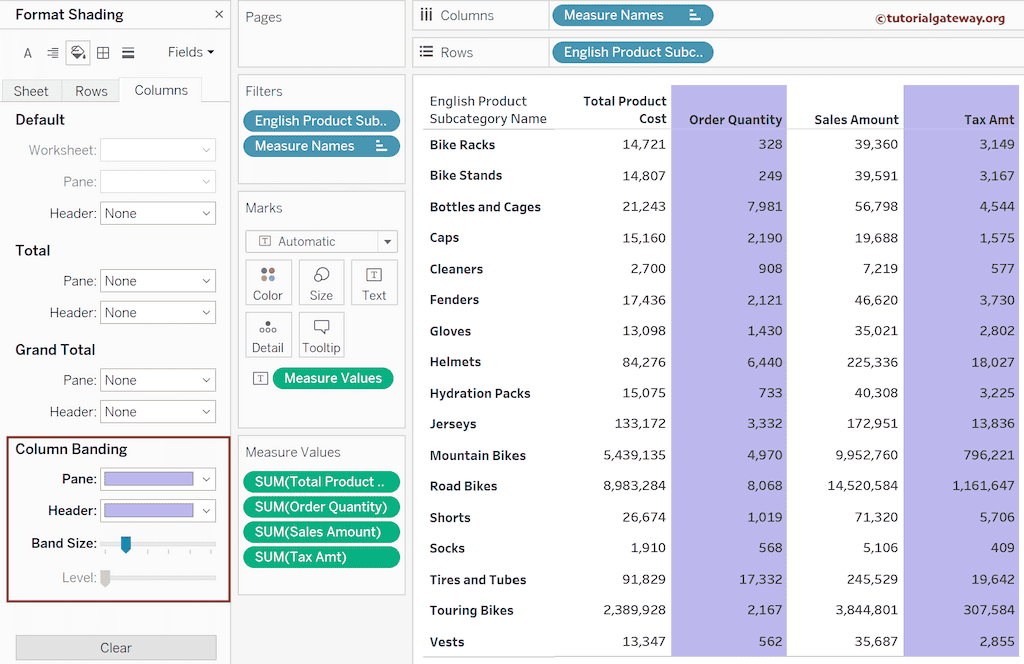
Let me increase the Band Size to one step, and it will consider two continuous columns as a set and add colors to every two alternative columns.
