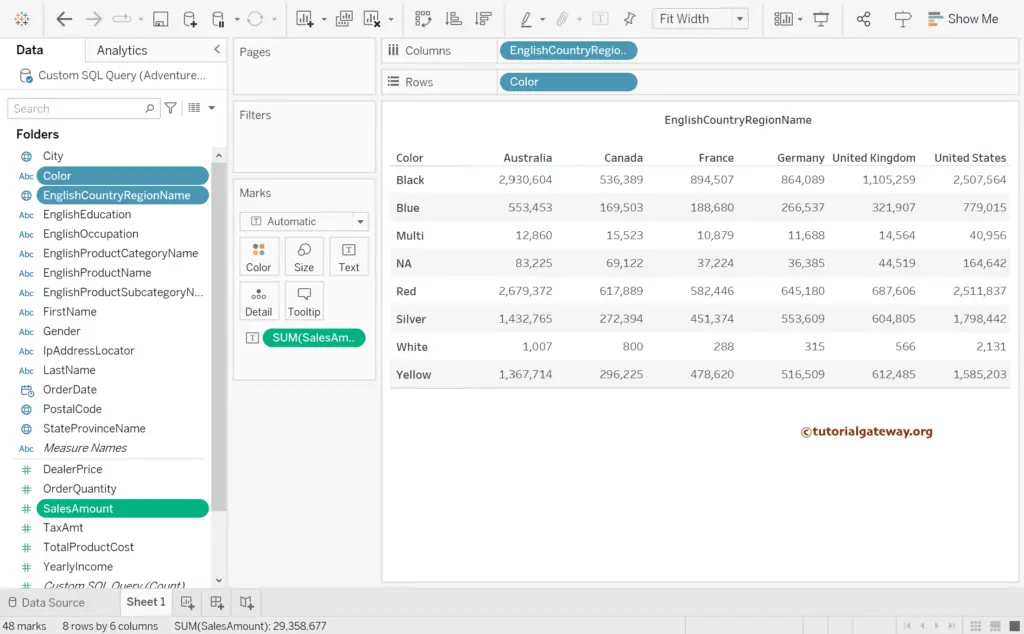
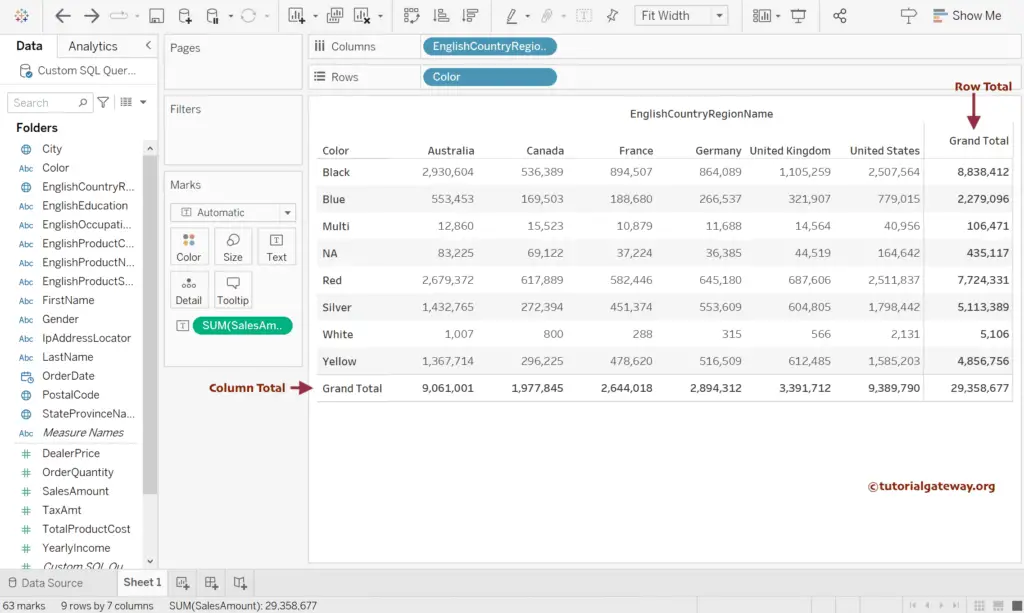
This article uses an example to show how to add row and column totals in Tableau. First, Drag and drop the English Country Region Name to the Columns shelf and Color to the Rows shelf. Next, add the Sales Amount to the Text shelf.
How to add row and column totals in Tableau?
Go to the Analysis Menu, choose the Totals, and then select the Show Row Grand Totals option. Please refer to the following article for more information.
- Connect to SQL Server
- Tableau
- Data Source
- Matrix
- Table Report
- Add Subtotals and Grand totals.
- Formatting options.
- Alternative Row colors.
- Alternative Column Colors.
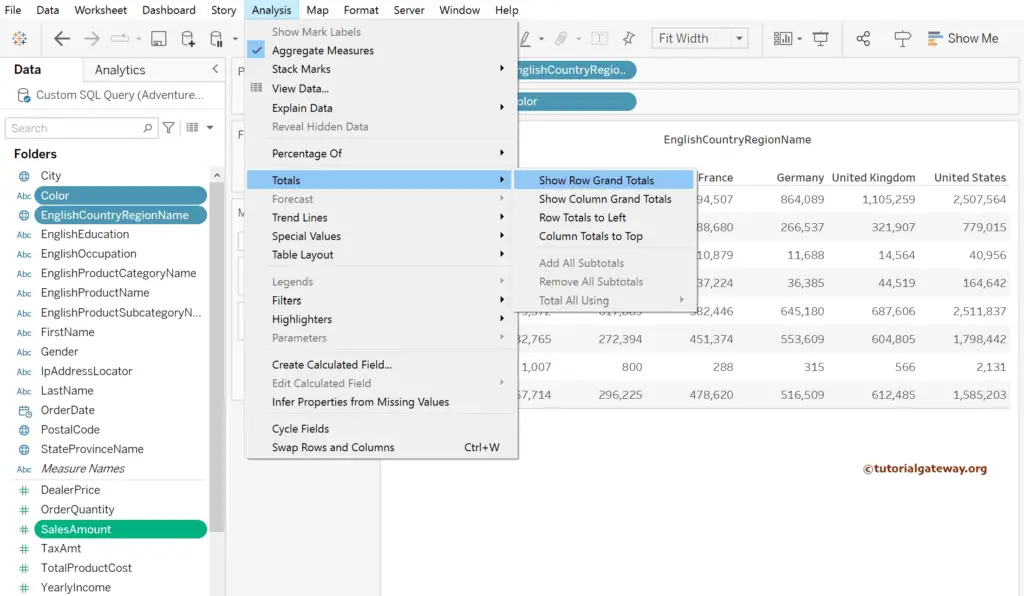
From the below image, you can see the row totals. Next, select the Show Column Grand Totals option.
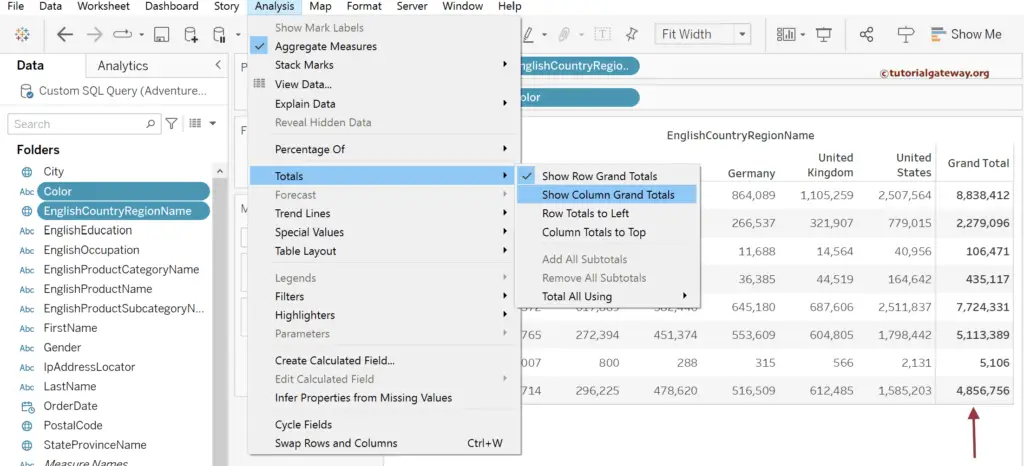
You can now see the matrix or crosstab with row and column totals.
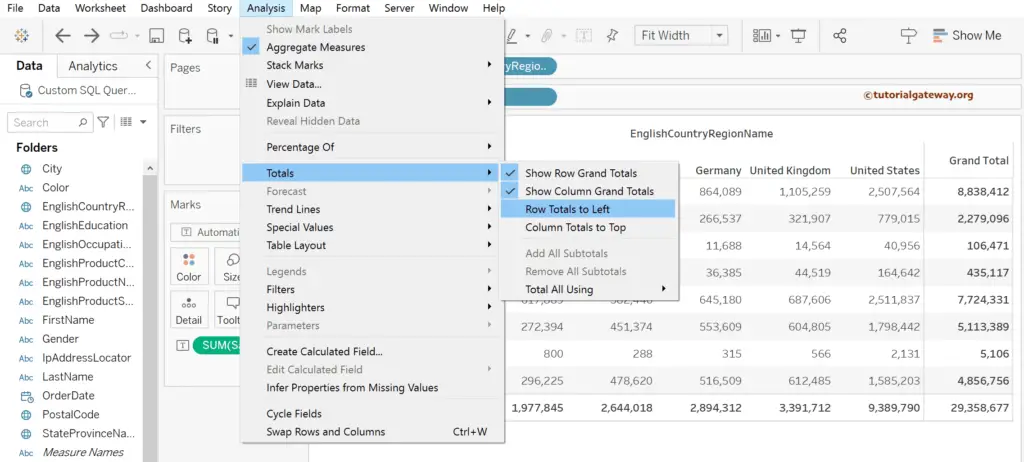
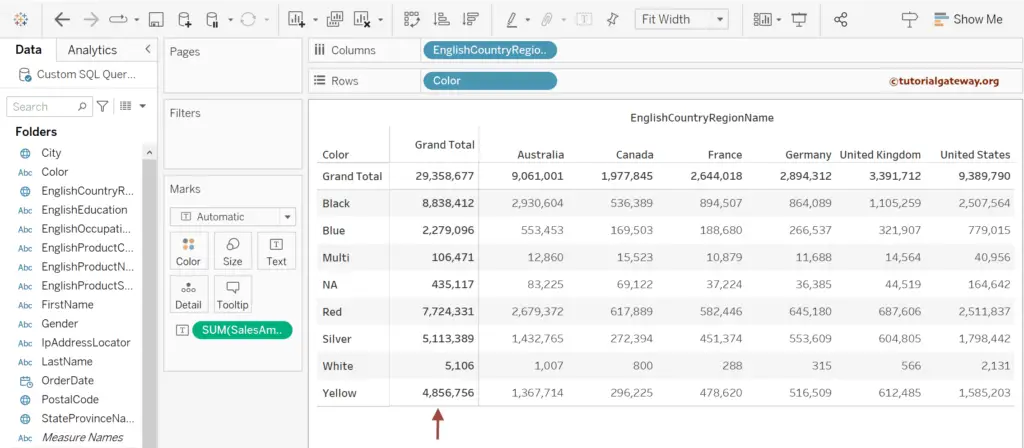
Under the Totals option, there’s a Row Totals to Left option to display the row totals from last to first. Similarly, Column Totals to Top will show the column grand totals at the top of the table.
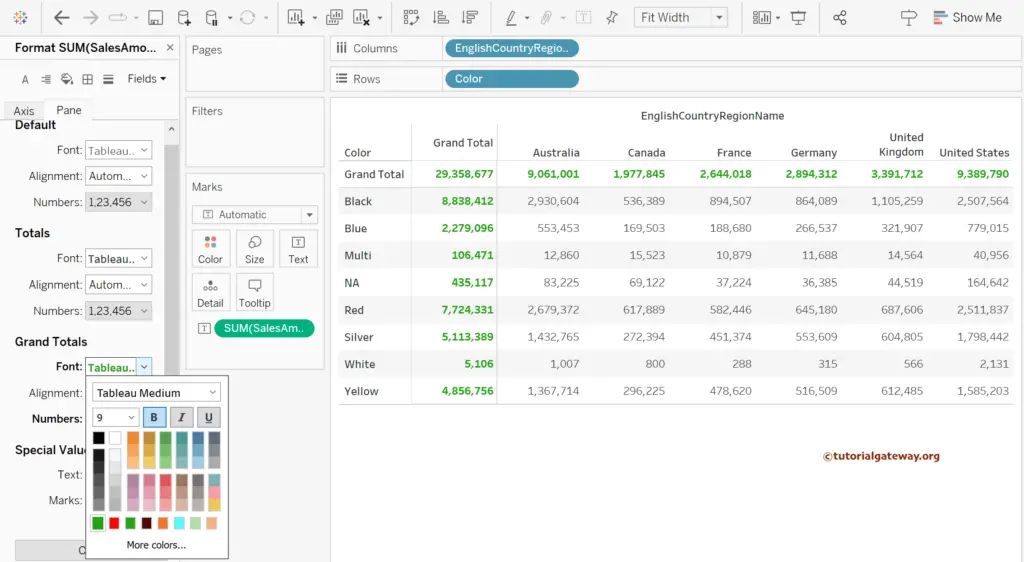
The below screenshot shows the totals.
Use the format option or menu to change the color of both the row and column totals.
