The Tableau Dual Combination Chart is handy for comparing one Measure against Other measures visually. In this article, we will show you how to create a Dual Combination Chart with an example.
For this Dual Combination Chart demo, we will use the Data Source we created in our previous article. Please visit the Data Labels in Reports article to understand the Tableau Data Source.
Tableau Dual Combination Chart Example
To create a Dual Combination Chart, first, drag and drop the Order Date from the Dimensions Region to the Columns Shelf. Next, drag and drop the Sales Amount and Total Product Cost from the Measures Region to the Rows Shelf. Since they are Measure values, both Sales Amount and Total Product Cost values will aggregate to the default Sum.
Once you drag them, a Line Chart will generate, as shown below. Let me change this to the Dual Combination chart. To do so, please expand the Show Me window and select the Dual Combination Chart from it.
TIP: We explained the manual process of creating Dual Combination Charts in the Dual Axis article. So please refer to the same. For more Charts, Click Here.
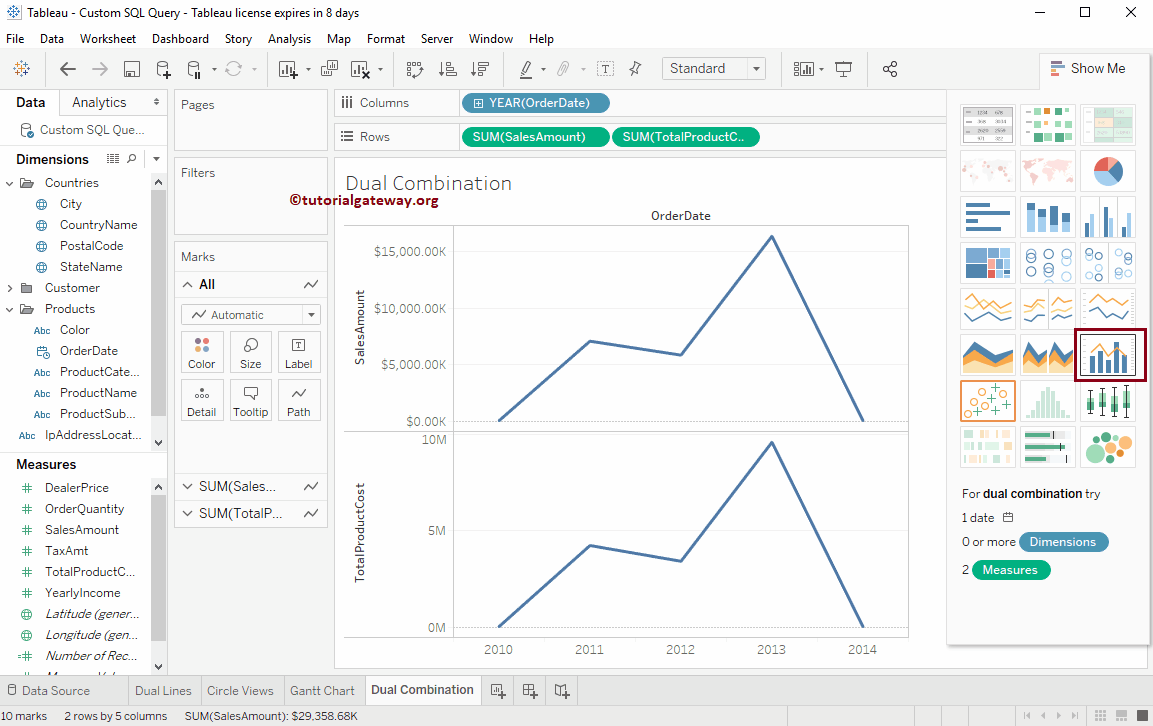
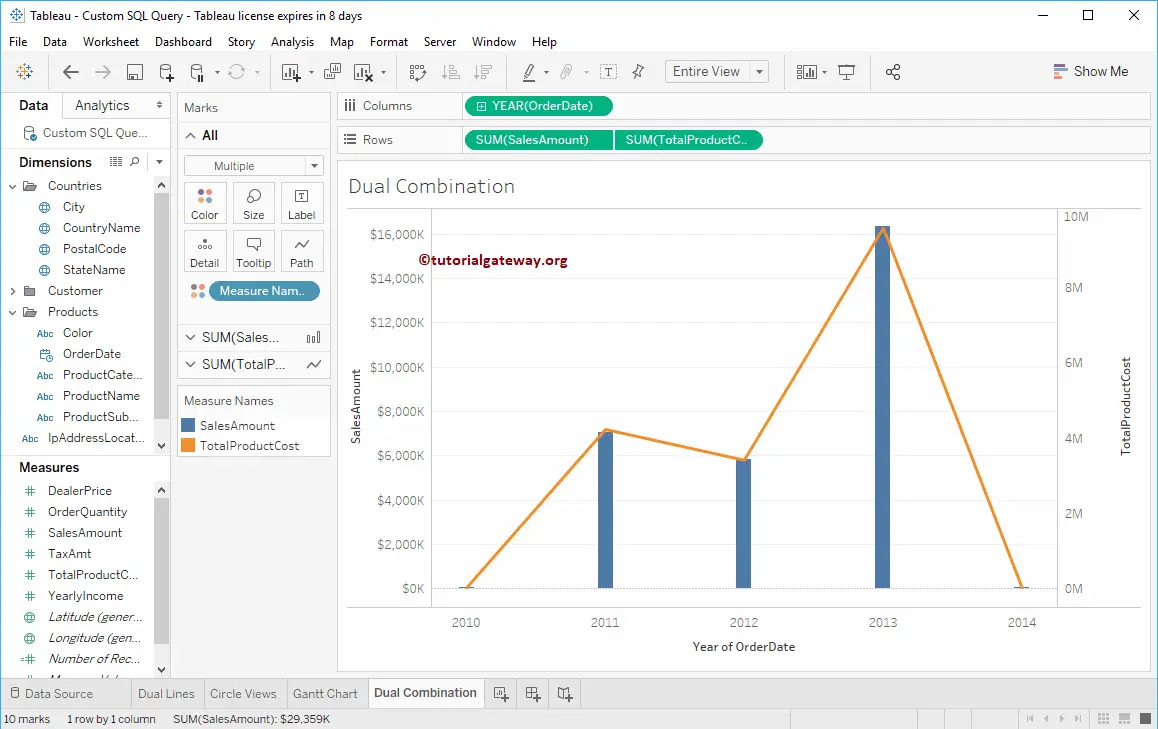
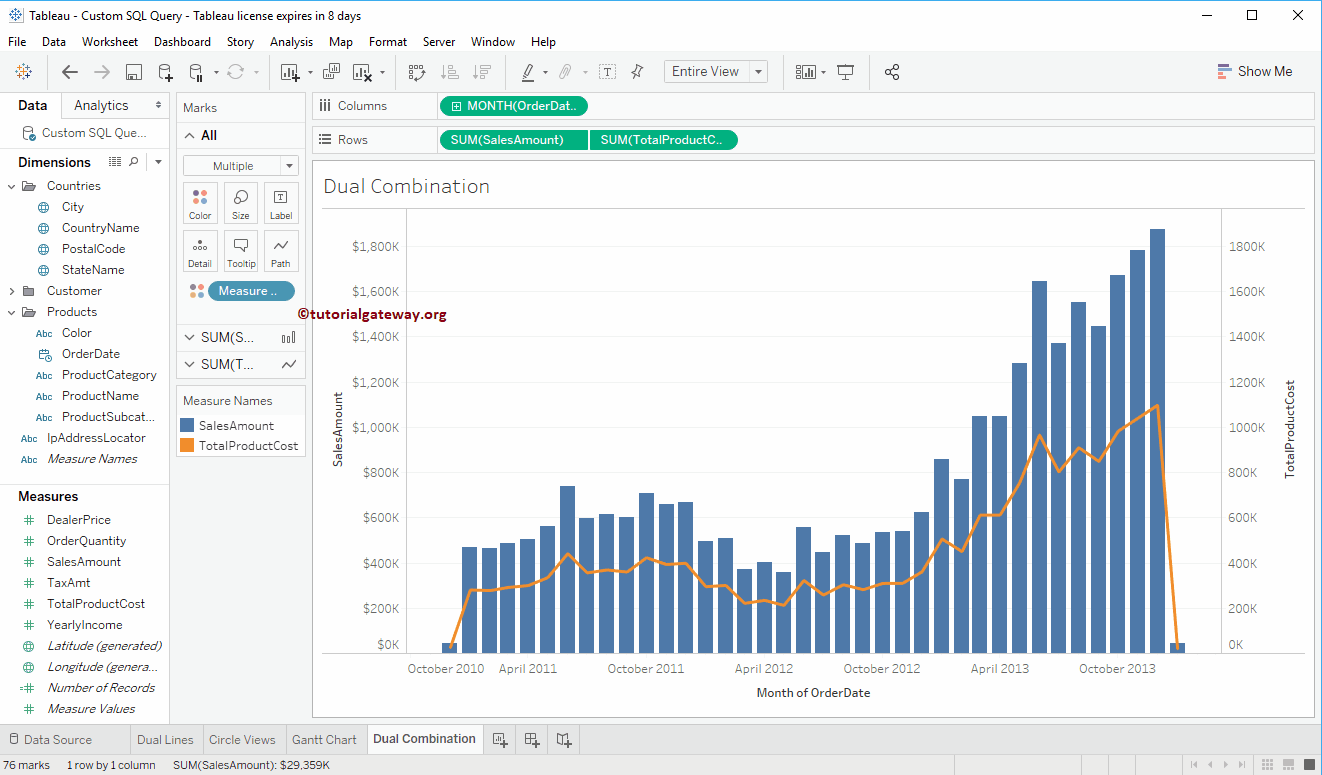
Once you select the Tableau Dual Combination from the Show Me window, the Dual Combination Chart will be displayed, as shown in the screenshot below.
You can expand these Cards “SUM(SalesAmounnt) and SUM(Total Product Cost)” to change Sales Amount to Line, Product Cost to Bar, and so on.
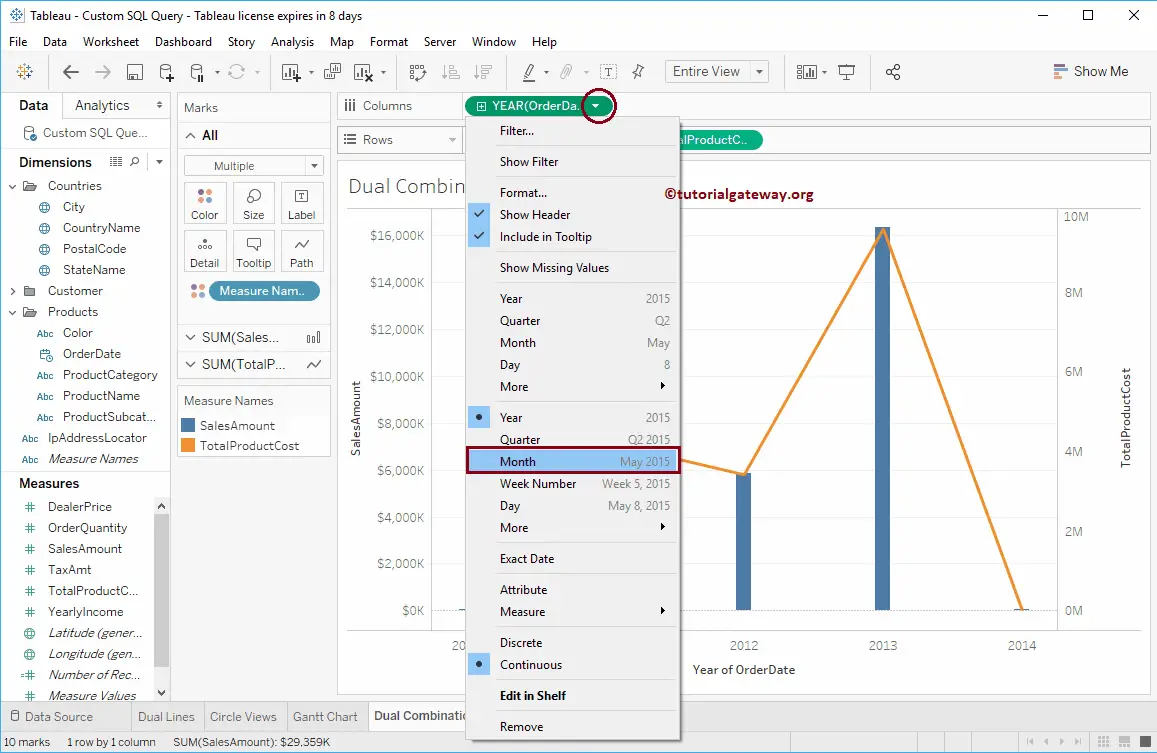
Let me change the Order date value from Year to All months present in each year to see more Bars and detailed trends.
Though the below Tableau Dual Combination Chart looks good. However, if you observe closely, the Maximum Axis value of the Sales Amount is 1800K, whereas the Total Product Cost is 1000K.

If you have no problem with this, leave it as it is. Otherwise, please select the Total Product Cost and the Synchronize Axis.. option from the context menu.
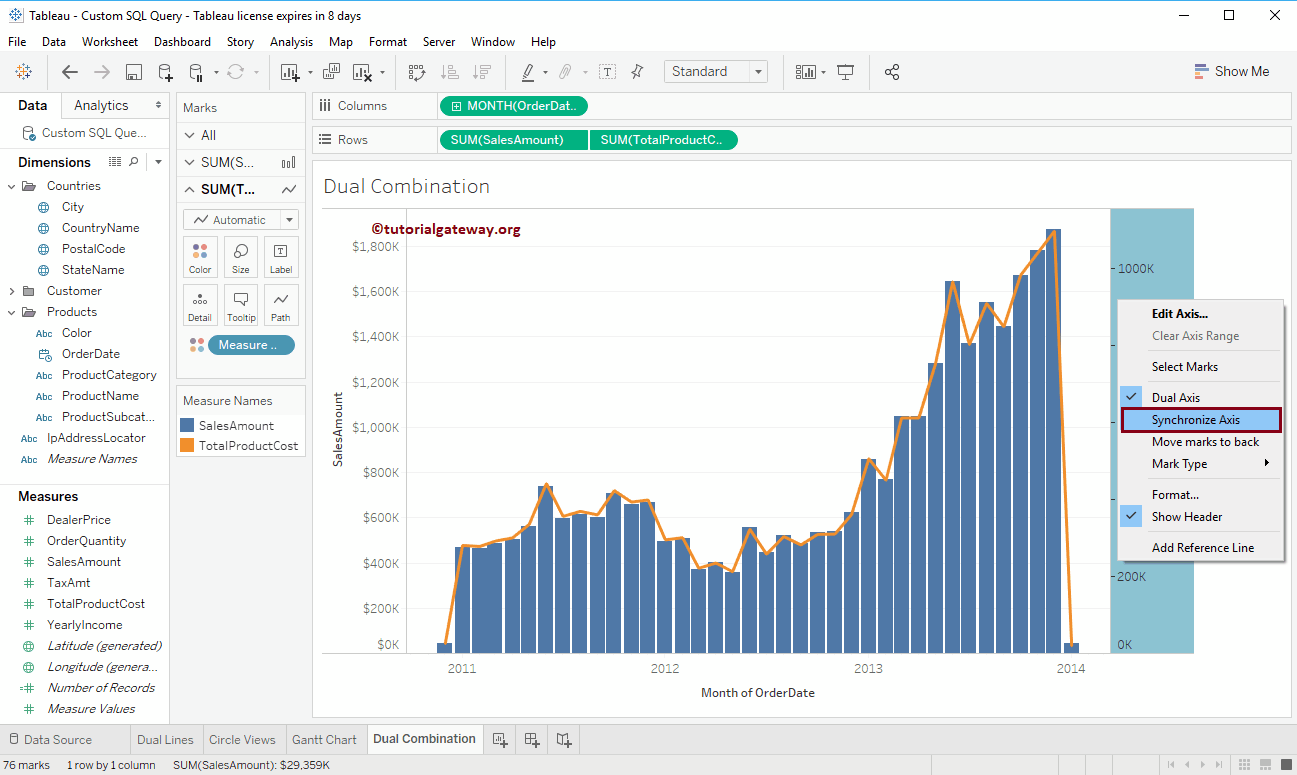
Now you can see the Dual Combination Chart with a Synchronized Axis. You can also remove one axis.
Add Data labels
To add data labels to the Tableau Dual Combination chart, click on the Show Mark Labels button in the Toolbar.
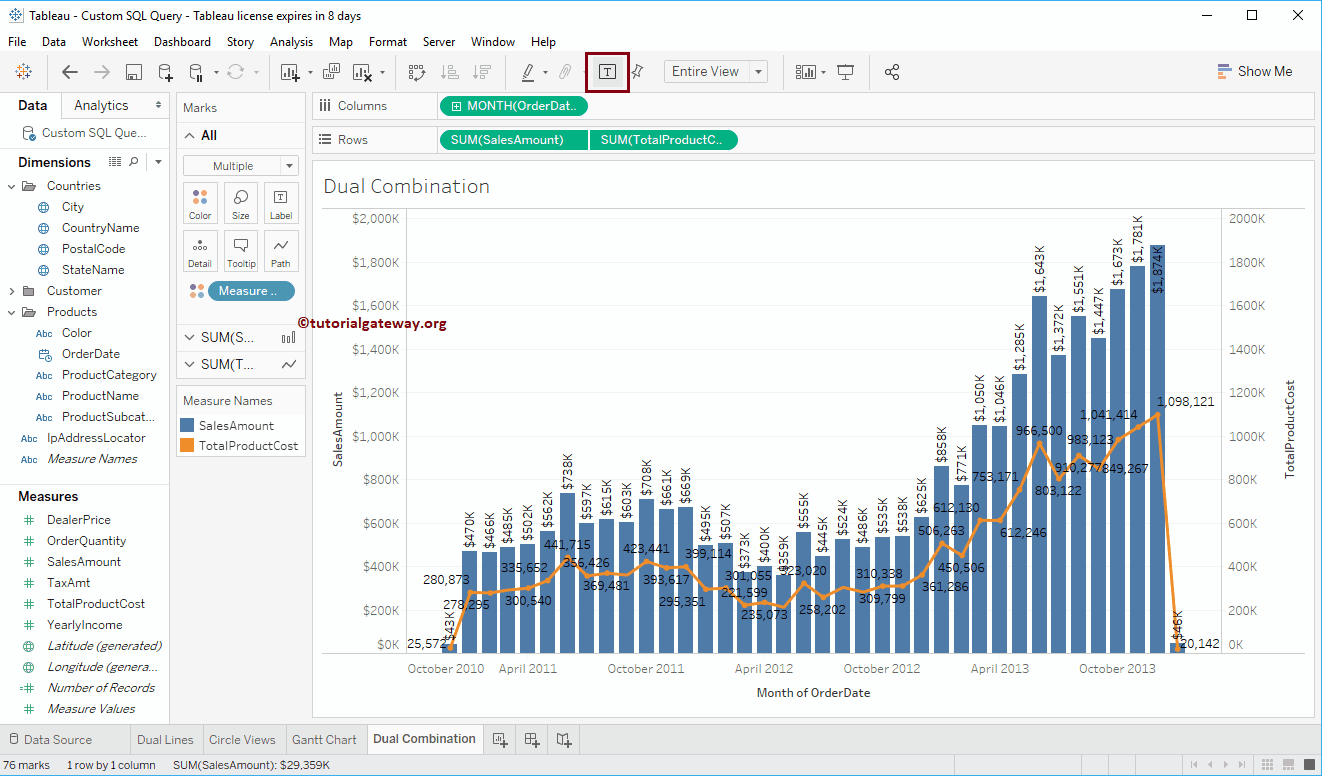
Tableau Dual Combination Chart Stacked
You can convert the existing Dual Combination Chart to the Stacked Dual Combination Chart. Let me add Country Name to the Colors shelf. Highlighting any block will show you the information on that particular slice.
