The Tableau Gantt Chart is used to display the duration of an activity or an event visually. In this article, we will show you how to create a Gantt Chart with an example.
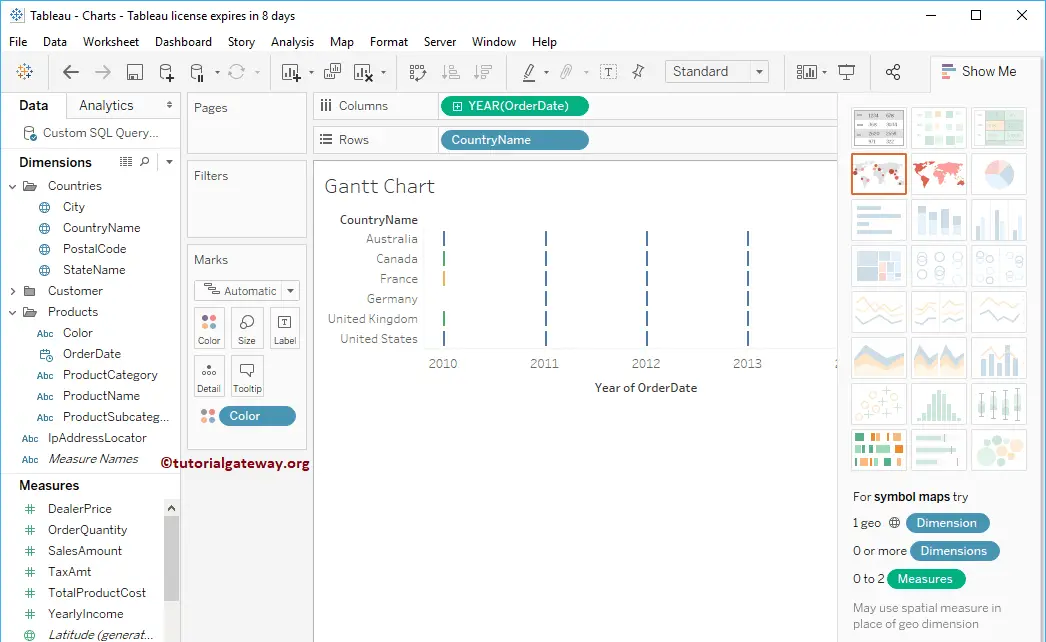
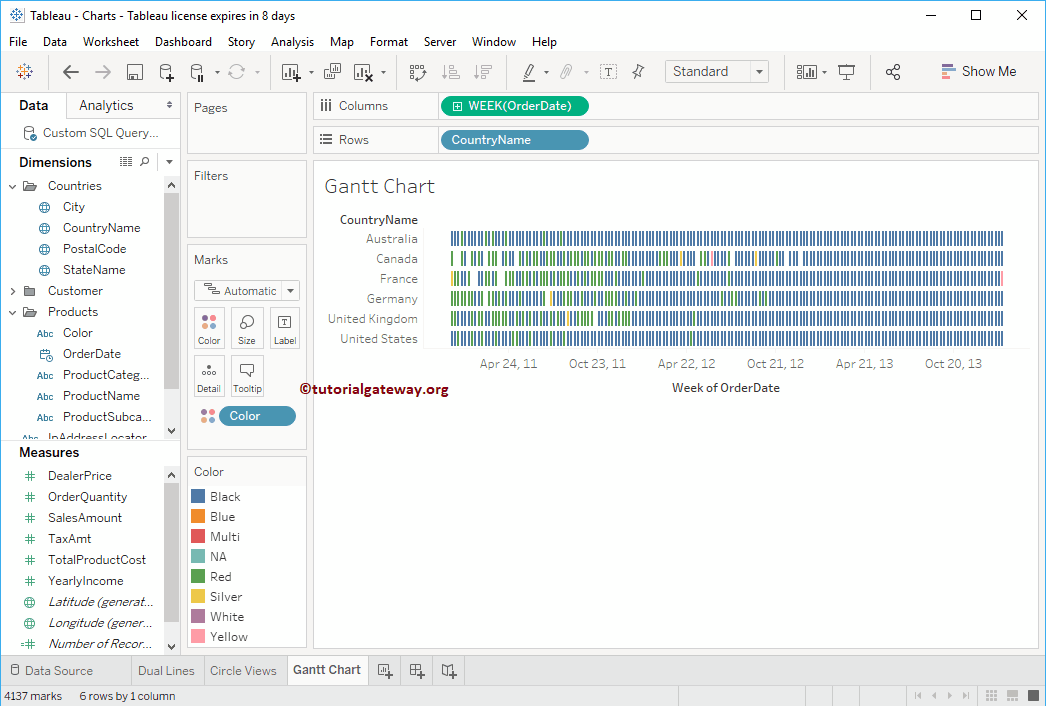
There are multiple ways of creating a Tableau Gantt Chart. We will use the Data Source we created in our previous article for this demo. To create a Gantt Chart, first, drag and drop the Country Name and Color fields from the Dimensions Region to the Rows Shelf. Next, Drag and Drop the Order Date from the Dimensions Region to the Columns Shelf.
Create a Gantt Chart in Tableau
Let me change this Text Label or Matrix to this. To do so, please expand the Show Me window and select the Gantt Chart from it. Please visit Data Labels in Reports and Text Label article to understand the Tableau Data Source.
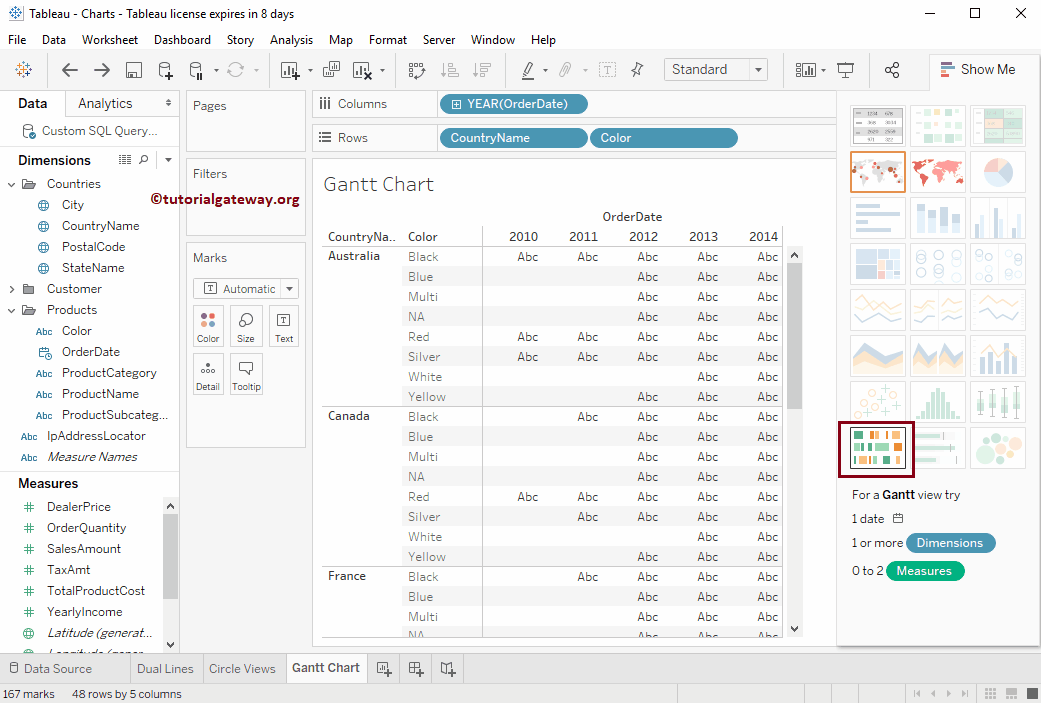
Once you choose it from the Show Me window, the Tableau Gantt chart from the start date and end date will be displayed in the data pane, as shown in the screenshot below.
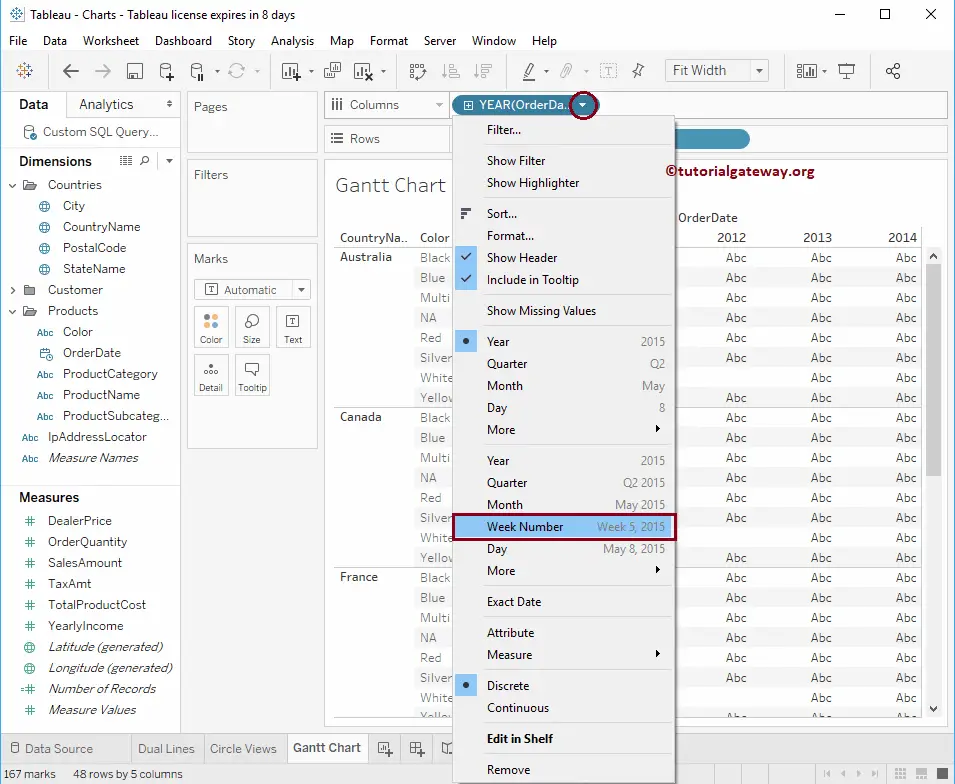
Let me change the Order date value from Year to Week Number present each year to see the detailed information.
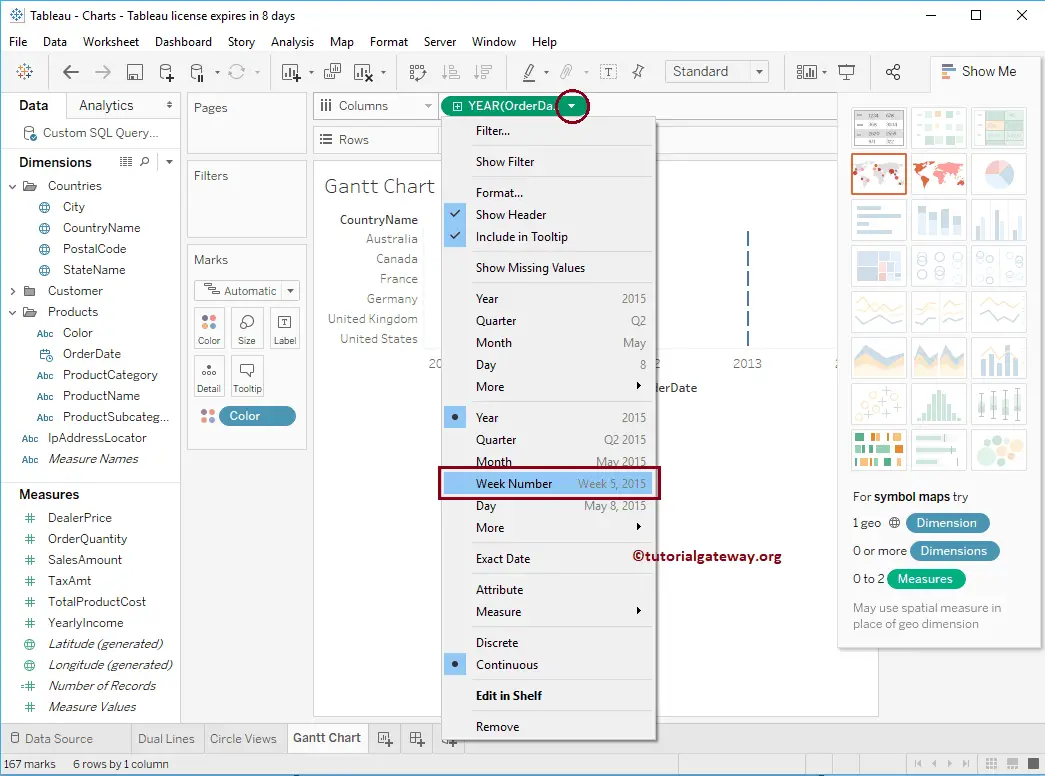
Now you can see that the Gantt chart is displaying Weeks’ information.
We have to specify the Gantt chart size. So, drag and drop the Order Quantity from the Measures region to the Size shelf present in the Marks card.
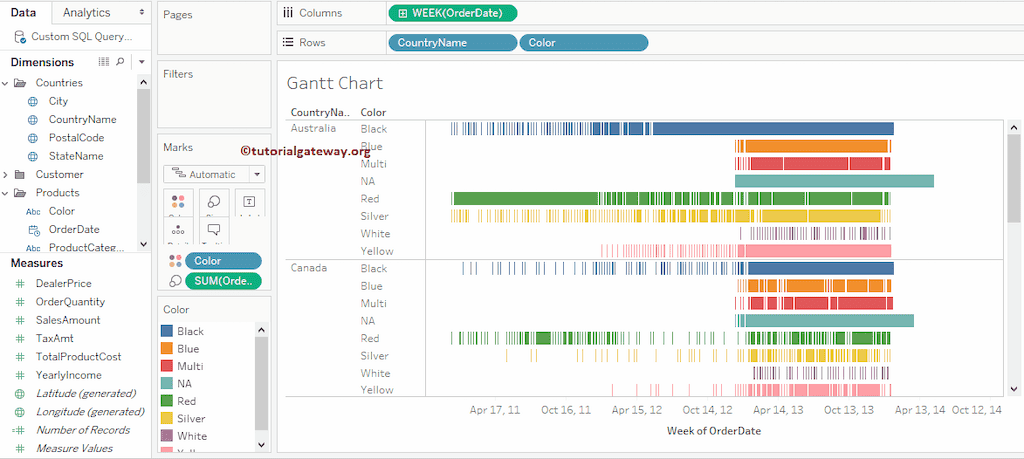
Next, add the Color field to the Rows shelf to further divide the chart. Now you can see the Gantt Bar (I mean, the Proper one).
The second approach to create a Tableau Gantt Chart
To create a Gantt chart, drag and drop the Country Name and Color fields from the Dimensions to the Rows Shelf and Order Date in the Dimensions section to the Columns Shelf. Next, let me alter the Order date value from Year to Week Number present each year to see the detailed information.
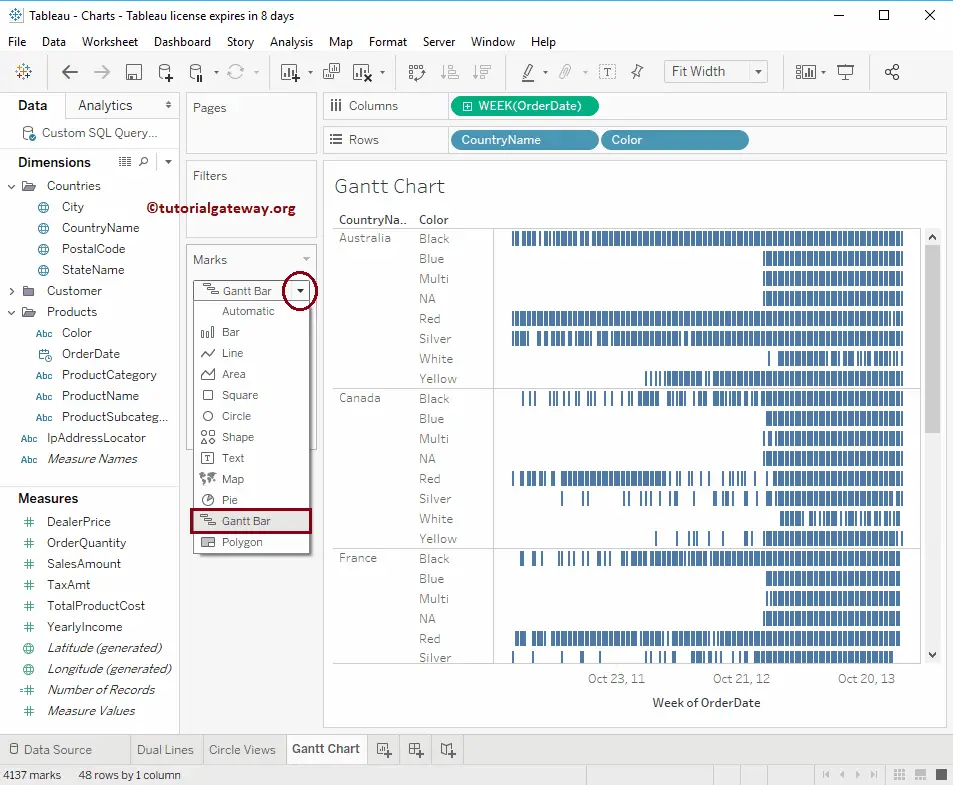
It will automatically generate a Gantt Chart for you. If this is not the case, please change the mark type from Automatic to Gantt Bar mark.
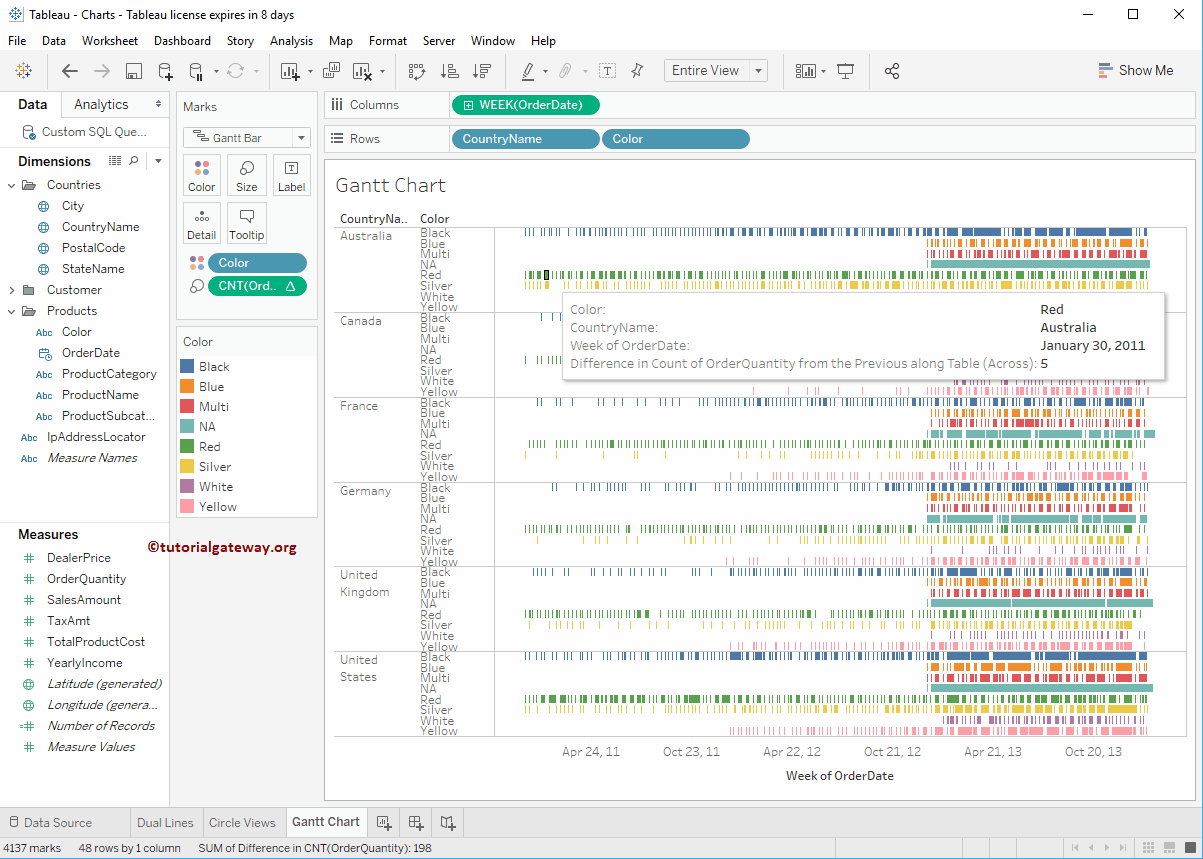
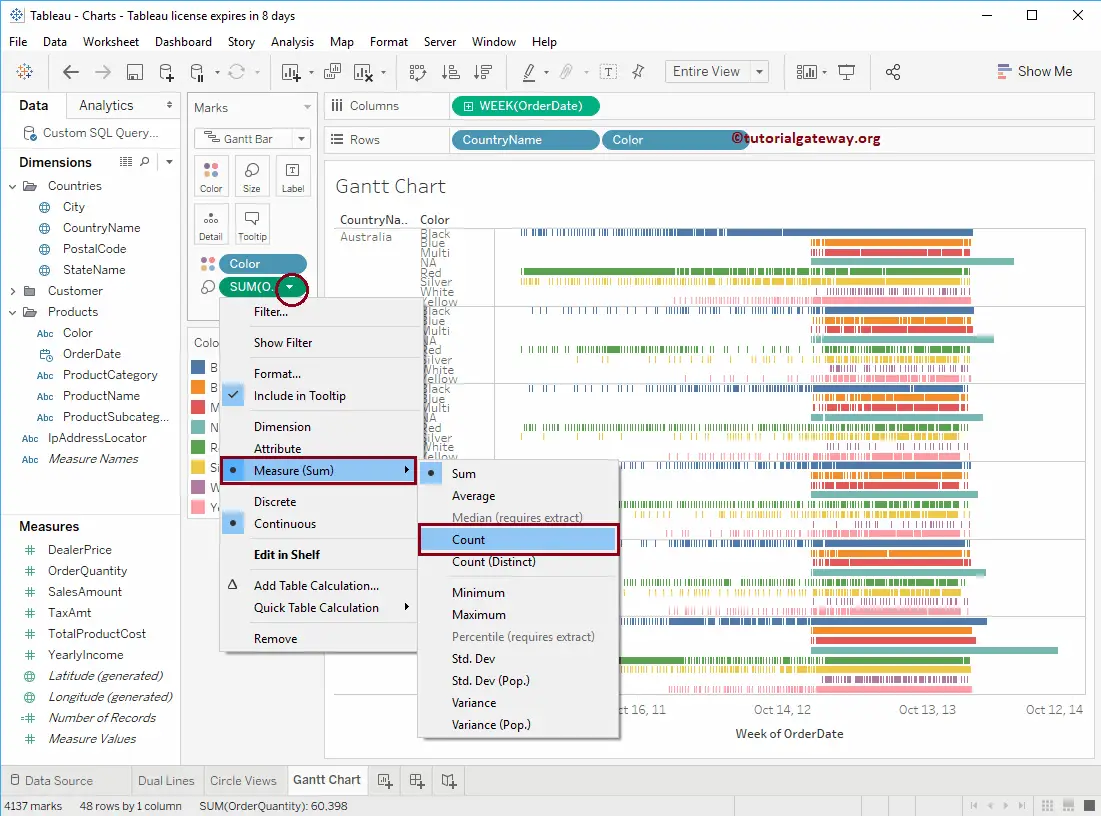
Next, add Color Dimension to the Color Card and Order Quantity to the Size shelf in a Gantt chart. Generally, we use the Count Function for Order Quantity. So, let me change the Default Sum to Count.
To do so, click the down arrow of SUM(Order Quantity) to open a drop-down menu. Here, select Measure (Sum) and then Select Count.
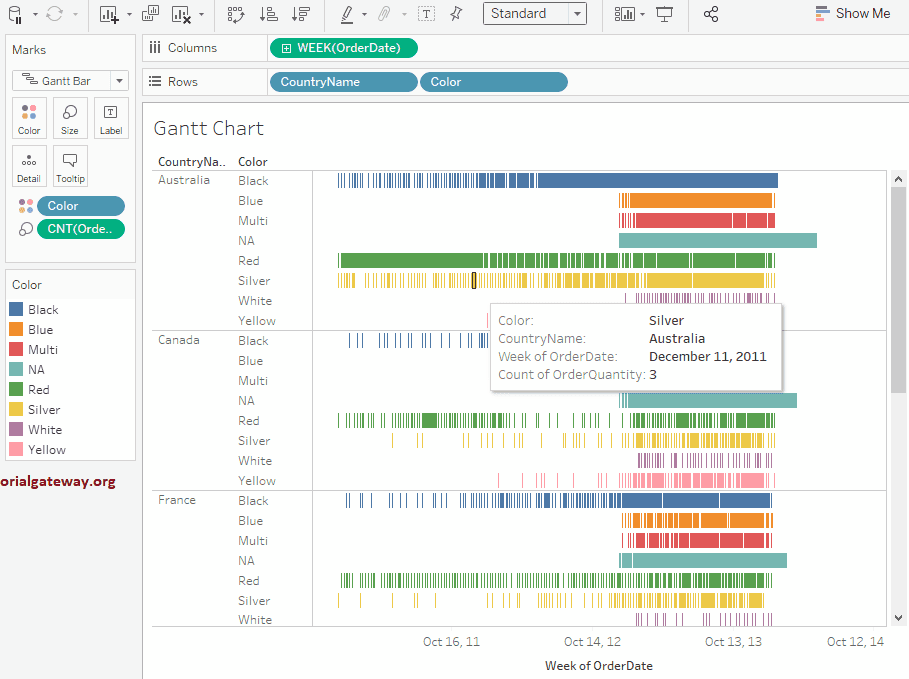
Highlighting a specific block will show you the information about that Tableau Gantt chart block.
This time, we will add a Table Calculation that will calculate the Order Quantity Difference. To add, please click on the Order Quantity, select the Quick Table Calculation option, and then select the Difference, as shown below.
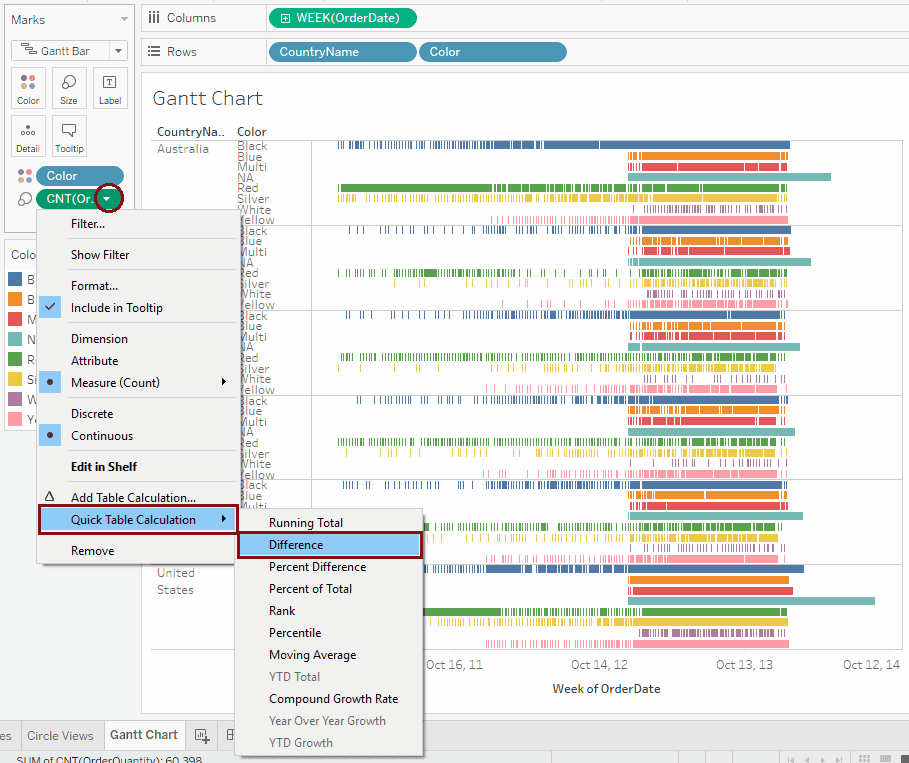
And you can see the result of this. Hover over a Gantt chart block to see the information inside a tooltip.