This article introduces Power BI Dashboard, so we will explore all the information about the dashboards and how to create and delete them with examples. Additionally, we cover how to add reports, images, and tiles to the Power BI dashboard and explore the settings with practical examples.
Individual charts or graphs help see information about a measure against the dimension. However, the organization needs a central hub or dashboard to monitor the business on a single screen. Power BI Dashboard is where users can monitor all the reports, datasets, and workbooks shared with them or created by them.
With Power BI My Workspace, users can create visually appealing charts, graphs, crosstabs, maps, tables, dashboards, and datasets. Once you create or import charts, you can add them to the dashboard with a simple Pin button.
- Create a Workspace
- Publish Desktop Reports
- Creating a Report using SQL and Excel Data in Worksheet
- Upload Excel Files to the Dashboard
- Favorites
- Upload Workbook
- Pin Workbook to Dashboard
- Rename a Dataset
- Rename a Report
- Dashboard Actions
Please refer to the Share a Dashboard, Share a Report and Sharing Workspace articles to learn about the sharing options. For the subscriptions, refer to the Subscribe Dashboard and Subscribe Report.
Power BI Dashboard Introduction
A dashboard is a very customizable one. You can change the titles, add images, web content, videos, and a text box to a dashboard. The best part is it allows you to ask questions about the data. If you enable the Q & A option, you can see all kinds of analytics.
The most exciting thing about Power BI is that it allows you to share the dashboards with others. Apart from this feature, under the actions, with a click of a button, you can see the insights and delete a dashboard.
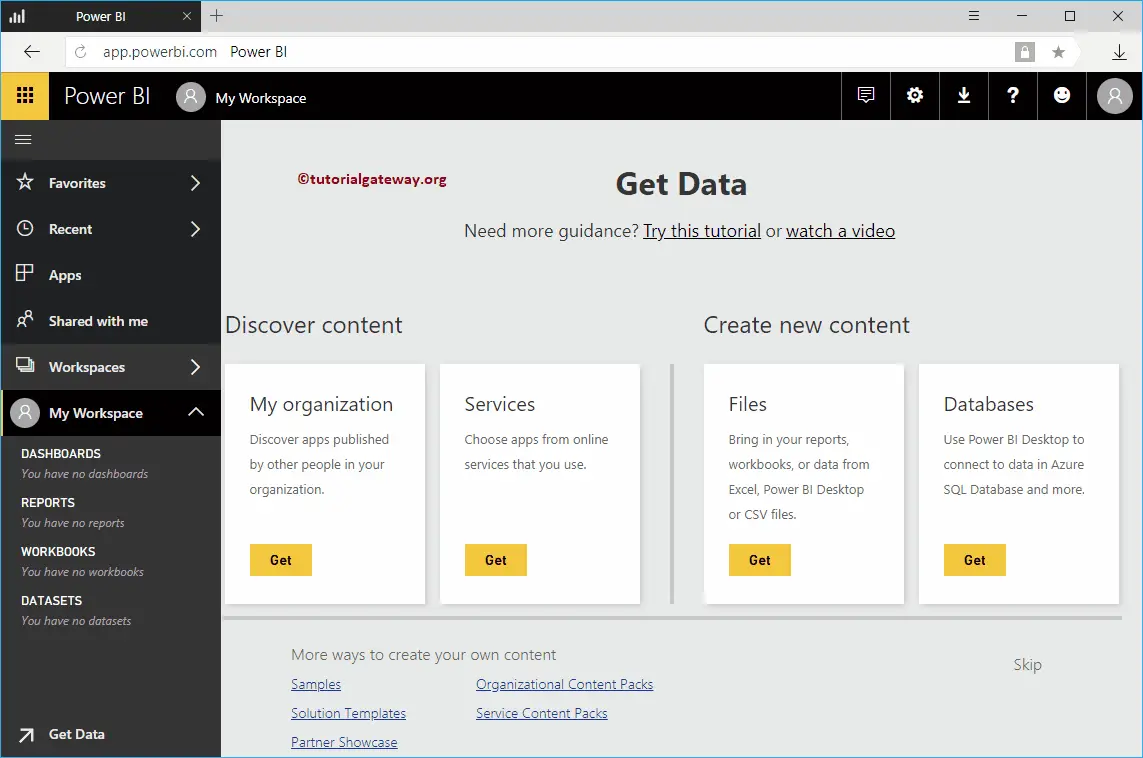
Power BI Dashboard is a collection of reports that explains everything about the business. If this is your first time, the Dashboard displays the page below. Remember, you can see the Default dashboard when you open or log into a Service.
Create a Power BI Dashboard
This section shows you how to create a dashboard with a practical example. Before we start creating, let me show you the list of currently available dashboards in my workspace. As you can see from the screenshot below, there are no available in my workspace.
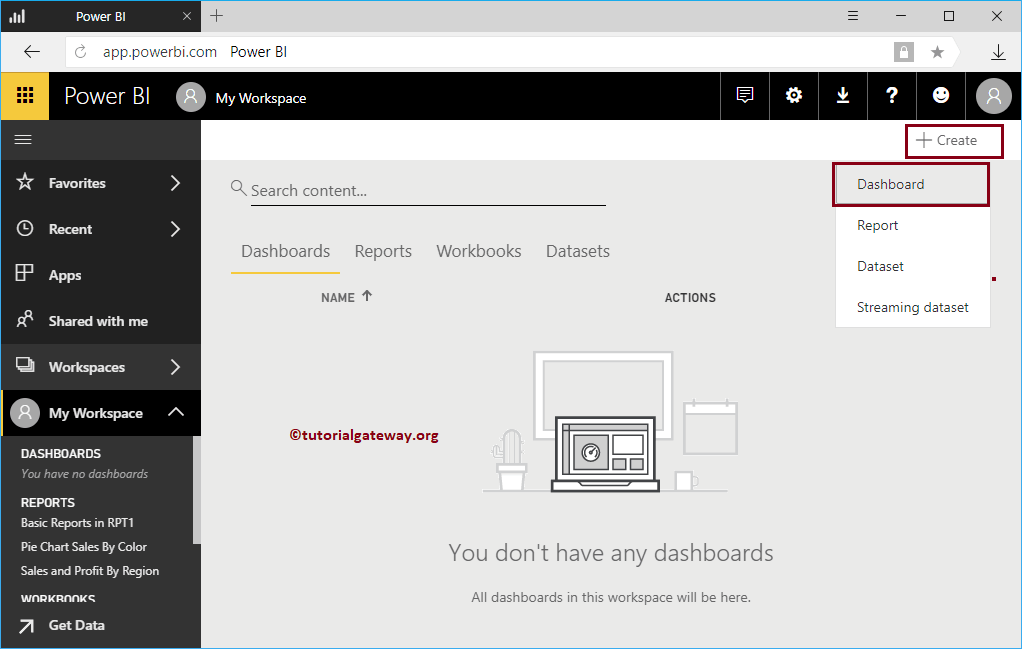
Creating it is easy and straightforward. But first, you must use the + Create button to create a dashboard inside your workspace.
To create a new one in Power BI, click the Create button and select the Dashboard option from the context menu.
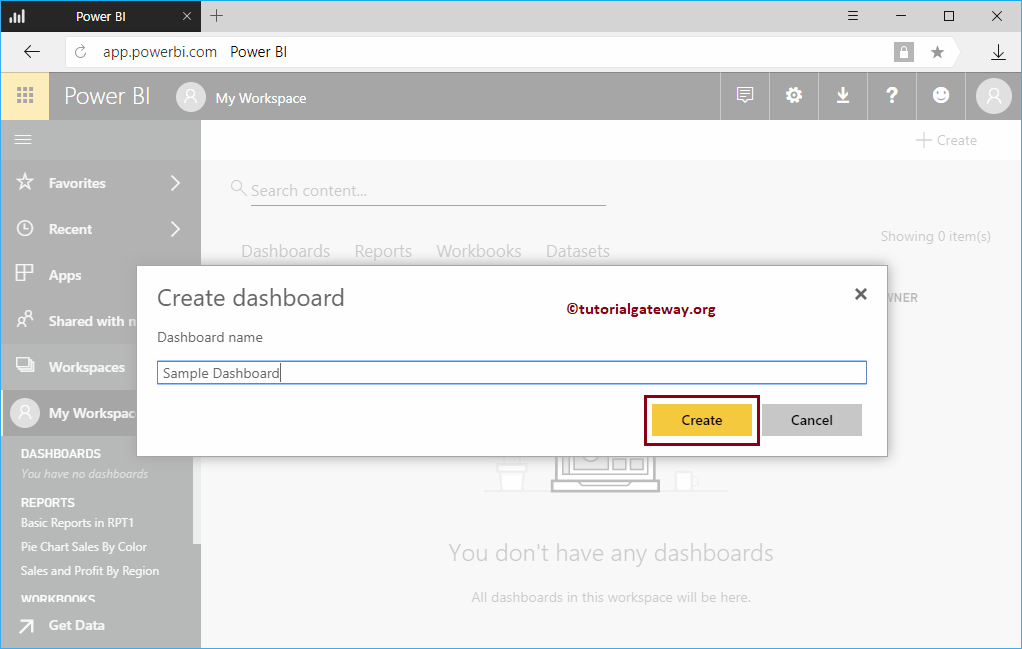
Selecting the option opens a Create pop-up window. Please specify the name as per your requirement. For now, we are assigning the Power BI name as Sample Dashboard
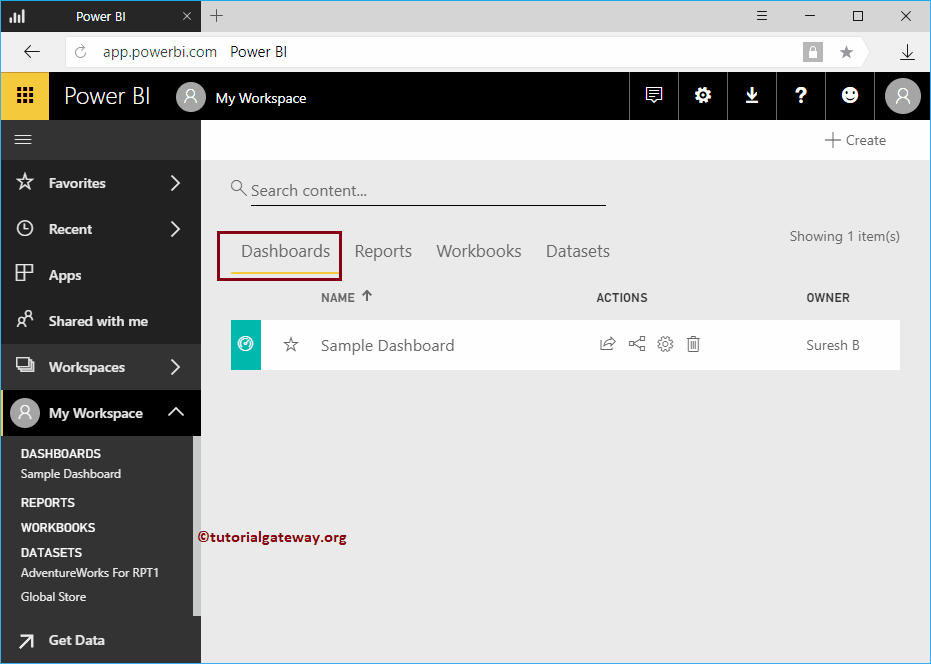
You can see the Sample under the My Workspace section in the left pane.
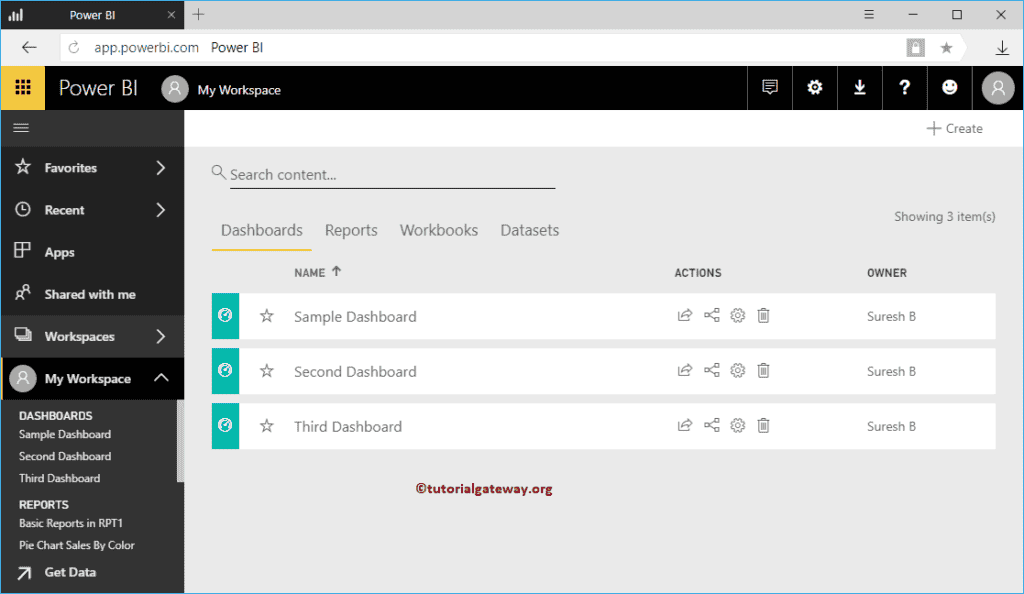
Let me navigate to My Workspace. Under the Dashboards tab, you can see the newly created one. Similarly, create one more dashboard for the next section.
How to add Reports to the Power BI Dashboard?
How to add reports to the dashboard with a practical example? Before we get into the actual Add Reports to Dashboard example, let me add one more dashboard to my workspace in the above image and name it as the second Dashboard.
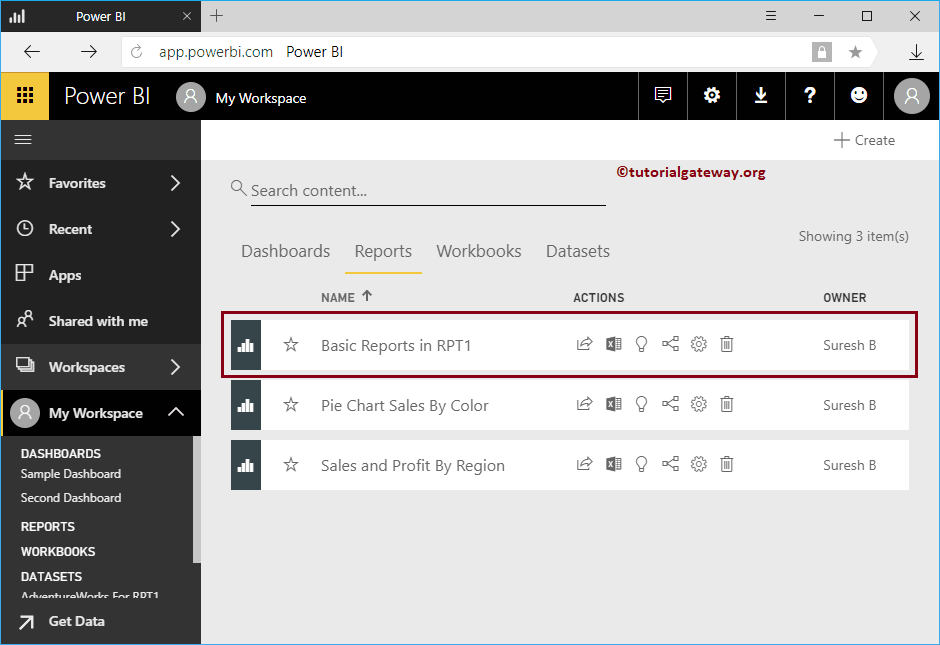
Navigate to see the list of available reports inside your workspace. In this example, we will use the Basic reports in RPT 1 report. So, click on this report to see the pages available in this report.
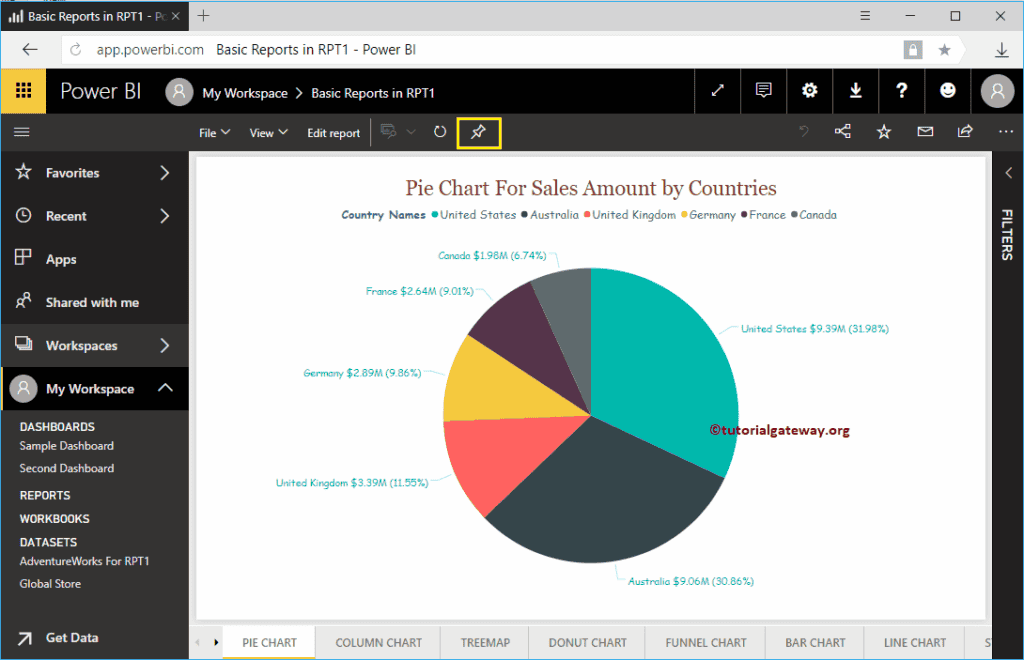
Now, you can see the pages inside the selected report. Let me add this Pie Chart to our dashboard. Please click on the Pin Live Page button shown in the screenshot below.
Clicking that button opens the following window.
- Preview: It shows you the preview of the selected report.
- Existing dashboard: If you want to add this report to an existing dashboard, then you have to select this option.
- New Dashboard: If you want to create a new dashboard for this report, then you have to select this option.
- Drop down Menu: Use this drop-down box to select the dashboard.
Add Reports to Existing Power BI Dashboard
In this example, we are selecting the Existing dashboard option. Next, we selected the Sample dashboard.
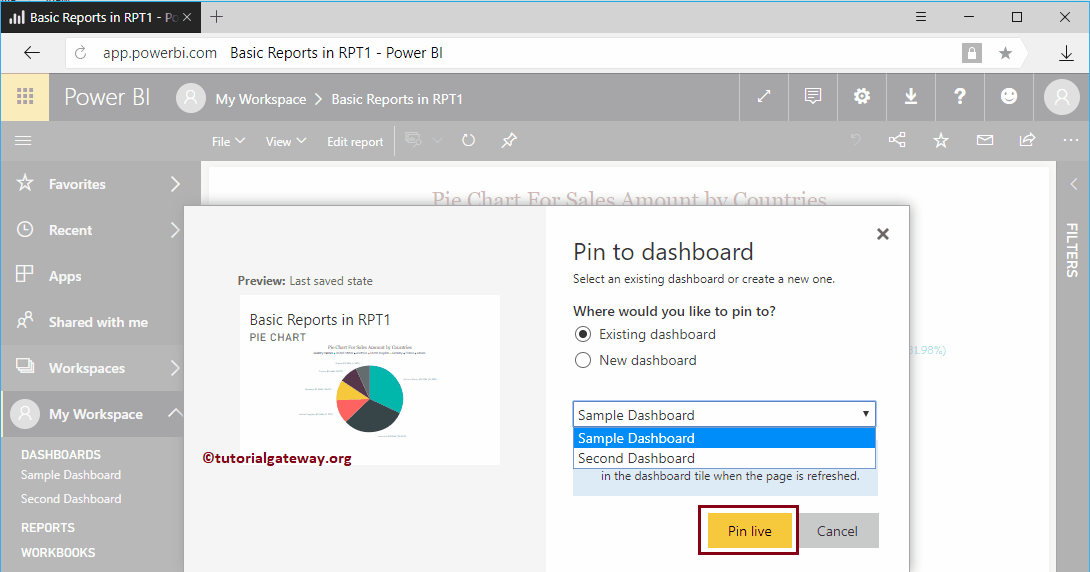
Clicking the Pin Live button adds a report to the sample dashboard. Let me open my Sample Dashboard.
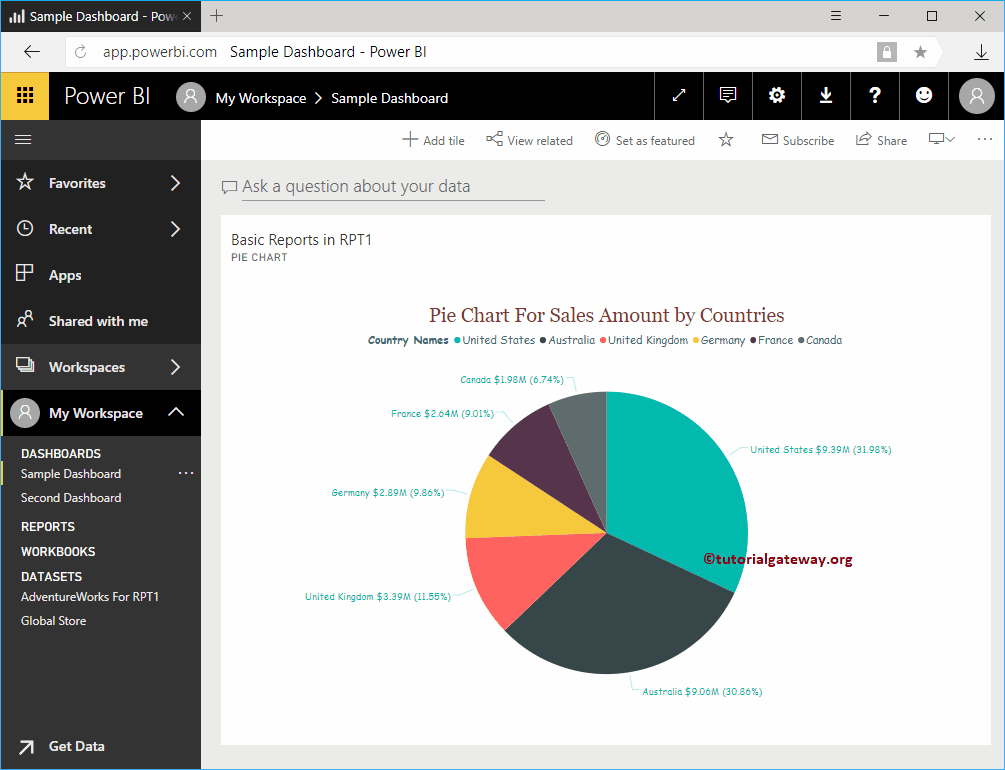
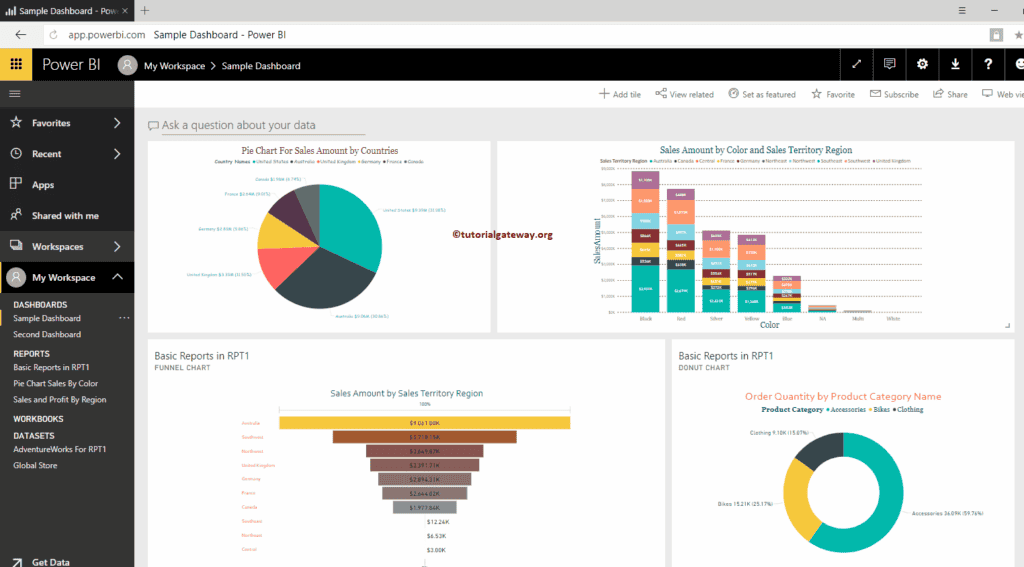
Similarly, you can add multiple reports to a single dashboard. You can use your mouse cursor to adjust the size and position of a report inside your dashboard. Let me adjust it for your reference. Now you can see all the available reports.
Add Reports to New Power BI Dashboard
In this example, we will add reports to the existing Power BI dashboard. So, we are selecting the New Dashboard option. It replaces the drop-down box with the text box. You have to provide your new dashboard name in this text box.
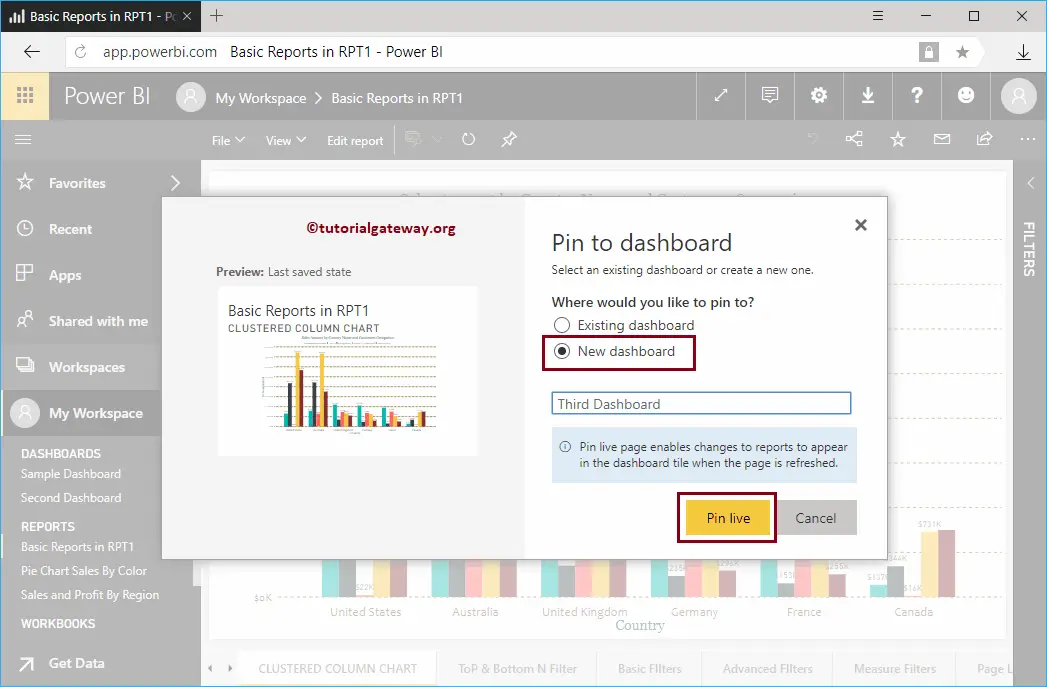
Now, you can see the Clustered Column chart inside your third dashboard.
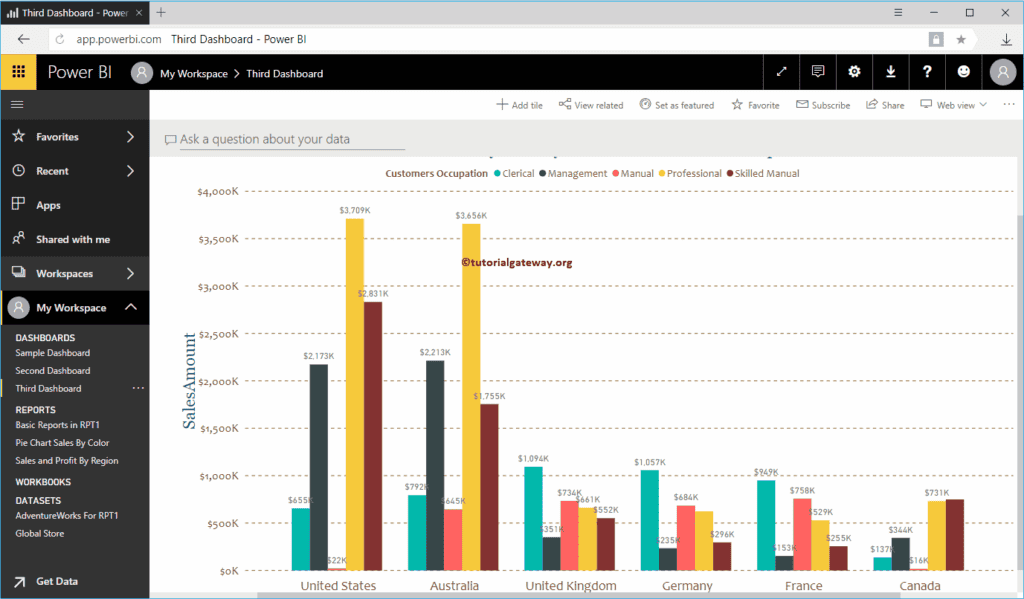
Let me navigate to My Workspace -> and Dashboards tab to see the dashboards. As you can see, it is displaying the Third Dashboard that we created earlier.
Power BI Dashboard Settings
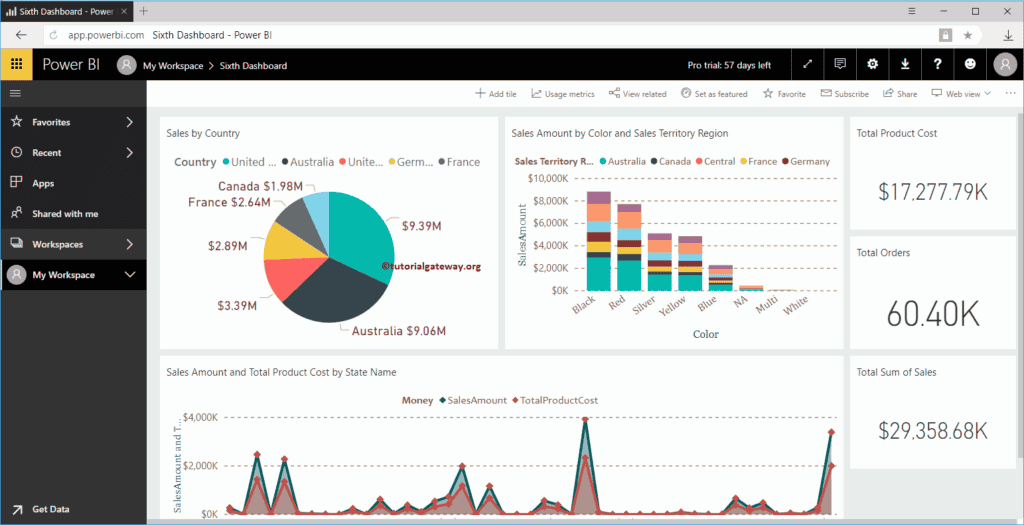
In this article, we show you the Dashboard Settings available. For this demonstration, we will use the Sixth Dashboard available in my workspace.
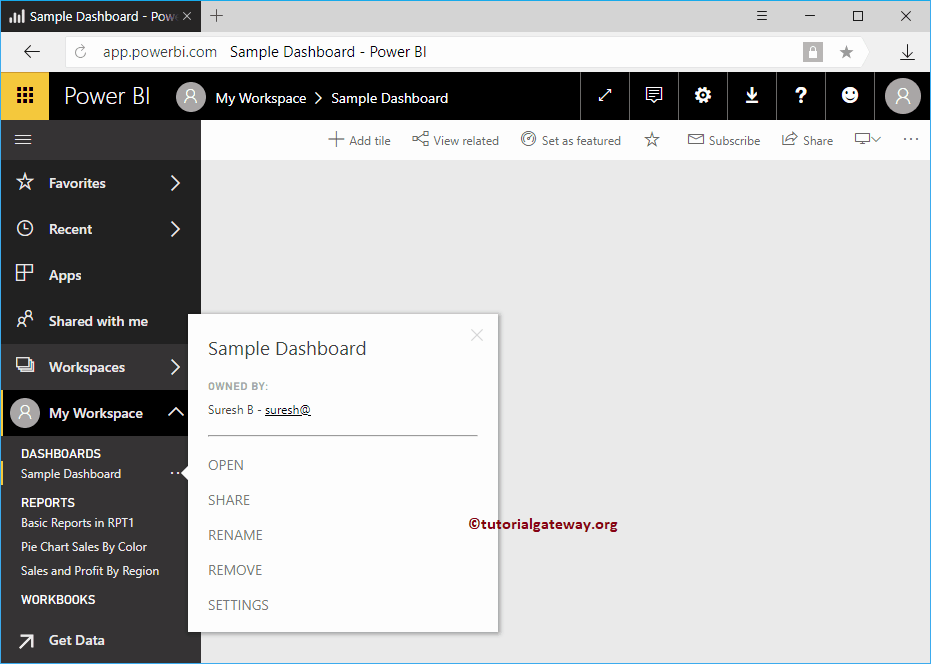
To change this dashboard settings, click the … button in the top right corner, as shown below. Next, select the Settings option from the context menu.
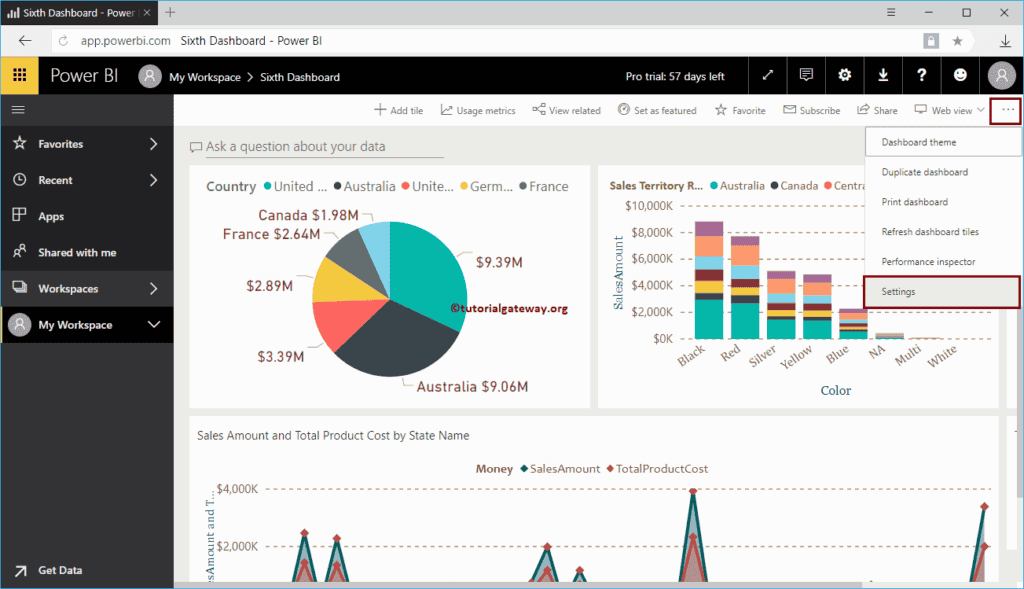
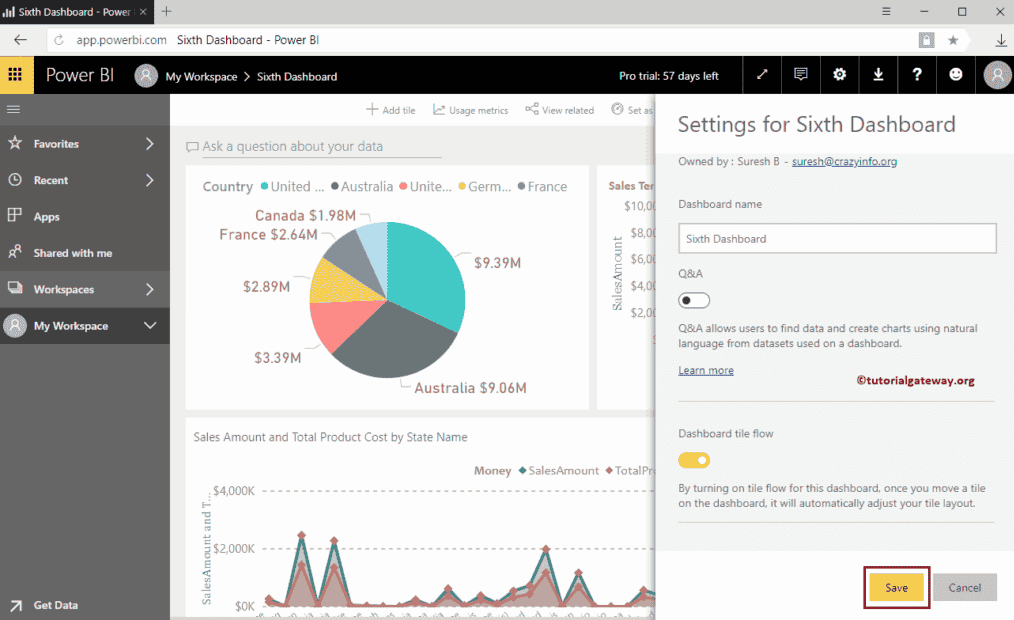
Select the Settings option and open the dashboard settings window.
- Dashboard Name: You can change the dashboard name.
- Q&A: It allows the user to ask questions about the data. It is very useful to generate complete visuals by using natural language.
- Dashboard tile flow: If you enable this option, then the Power BI dashboard automatically adjusts the position of the tiles.
Let me Toggle Q&A to off and the Dashboard tile flow to on.
As you can see from the screenshot below, Ask a question about your data being removed from the dashboard. Note that I was unable to capture the tile flow. Trust me. It works
Pin Report to Power BI Dashboard
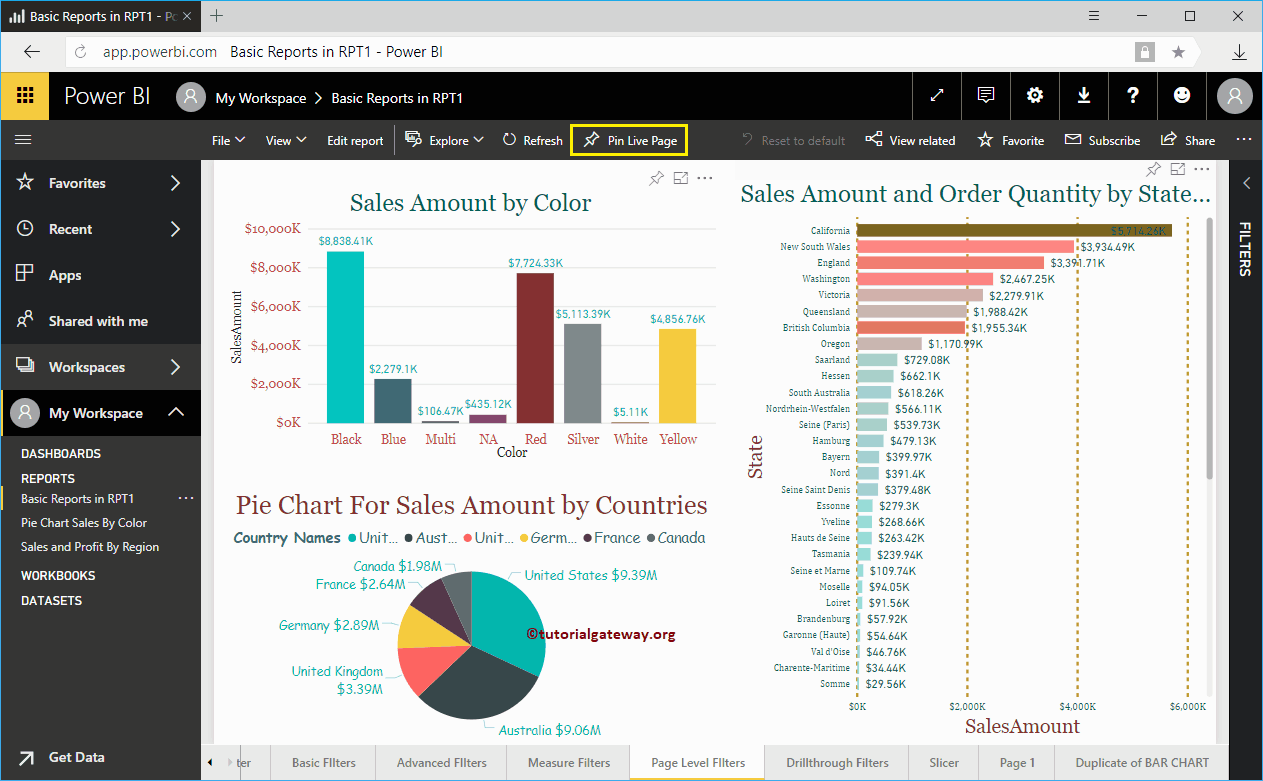
In this section, we show you the step by step approach to pin report to dashboard with a practical example. Before we start pinning the reports to the dashboard, let me show you the page I use in this example.
As you can see from the screenshot below, this is the report that we published from Desktop. To demonstrate this Pin Report to Dashboard example, we use the Page level Filters page.
Pin Report to Dashboard using Pin Live Page
This approach pins all the visuals that are available on this page. I mean Column Chart, Pie Chart, and Bar Chart. In order to Pin the whole page to the Power BI dashboard, click on the Pin Live Page button that we showed in the below screenshot.
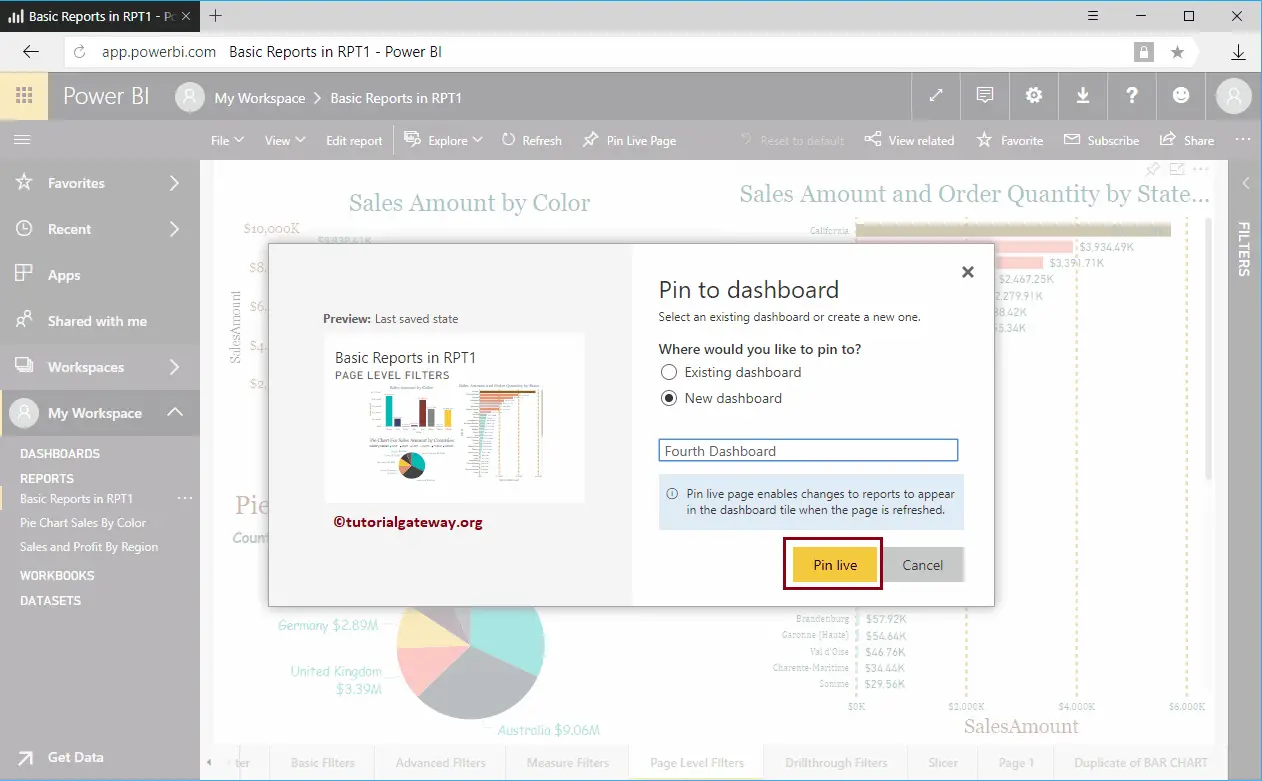
Clicking that Pin Live Page button opens the following window. Let me select the New Dashboard option, and next, we assign the dashboard name as Fourth Dashboard.
- Existing dashboard: Select this option to add this report to an existing dashboard.
- New Dashboard: Select this option to create a new dashboard for this report.
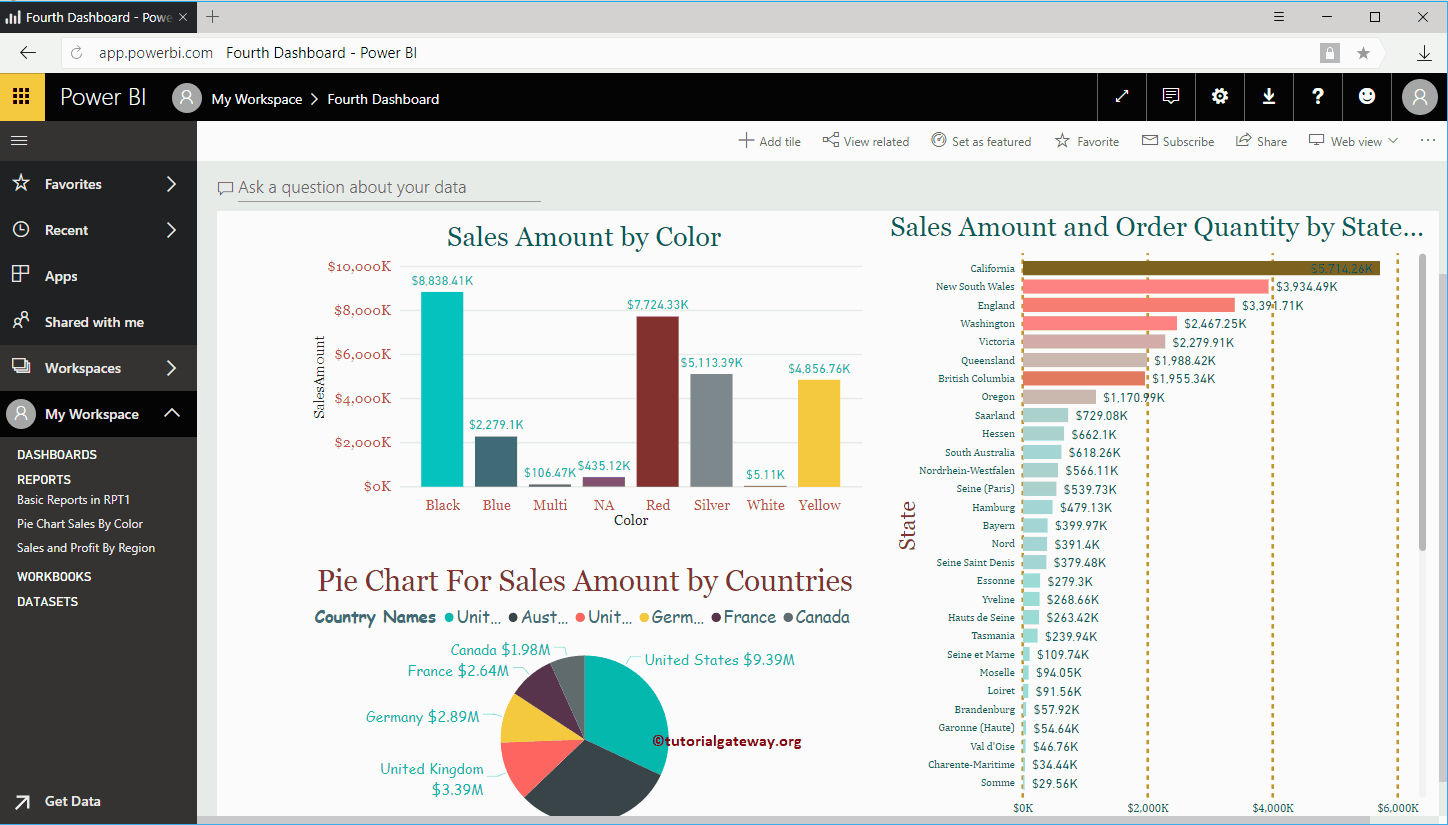
Within the Fourth dashboard, you can see the whole page inside our dashboard.
Pin Report to Power BI Dashboard using Pin Visual option
This approach will pin individual visuals that are available on this page. In order to Pin any individual chart, hover over it, and it will show you the Pin Visual button we showed in the screenshot below.
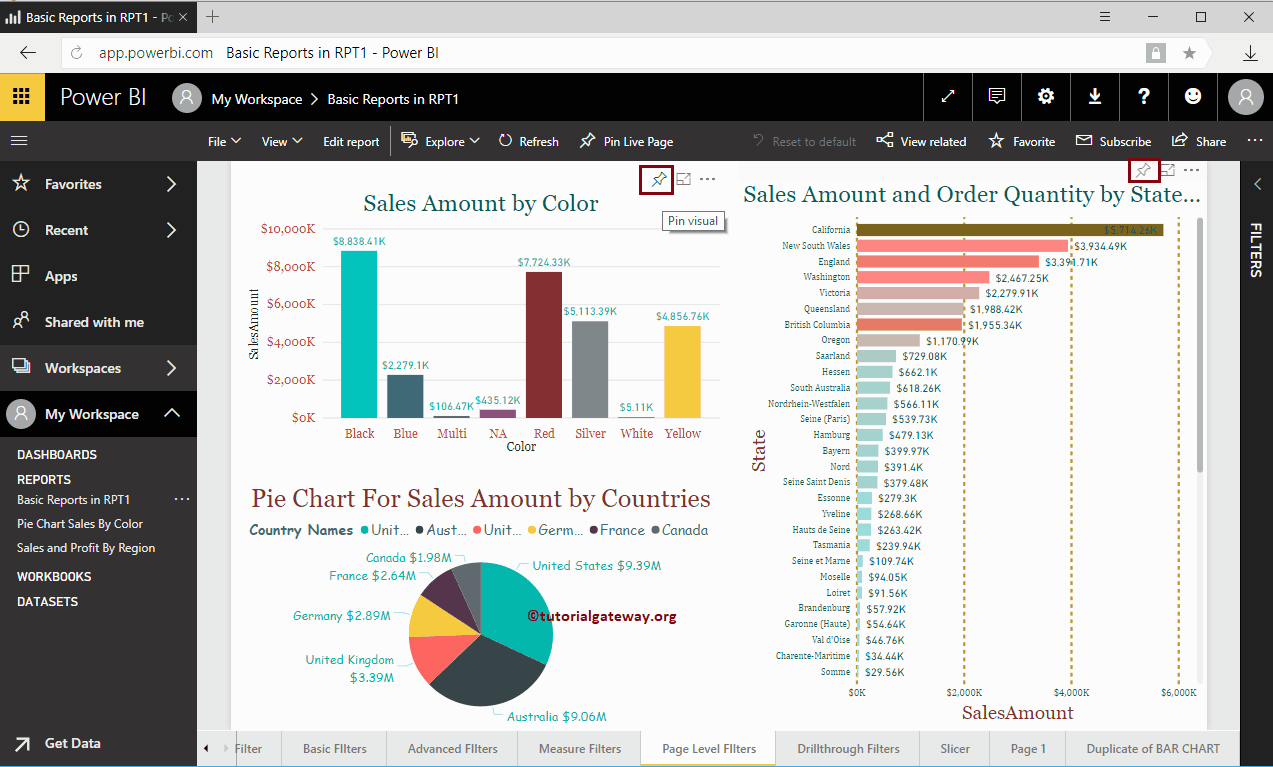
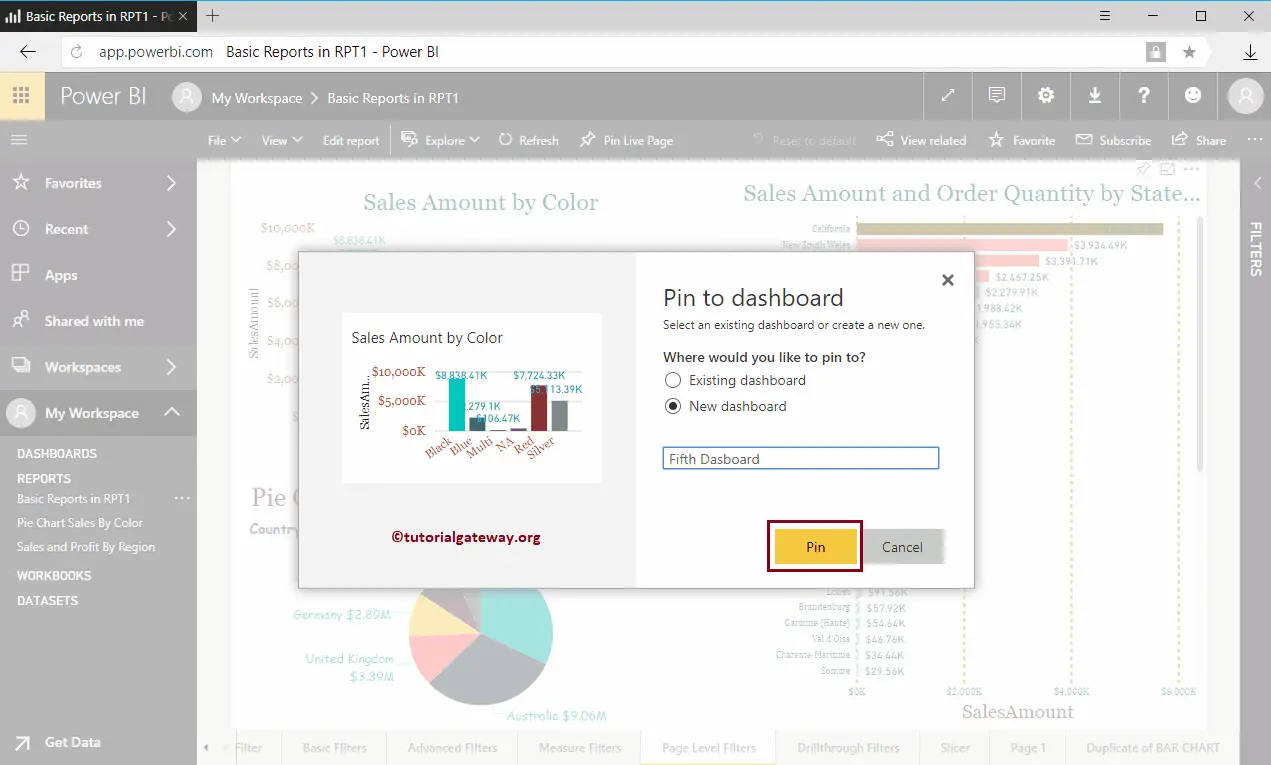
Click on that button to open the following window. This time, we are selecting the New dashboard and assigning the name as the Fifth dashboard.
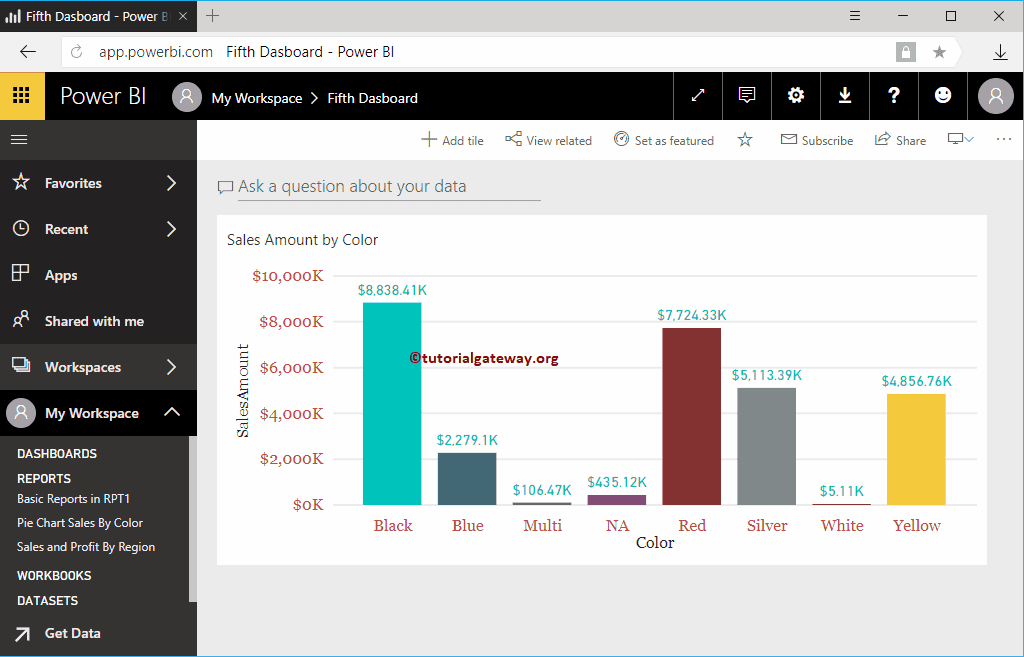
Within the Fifth dashboard, you can see the Column Chart that we pinned before.
How to Delete Power BI Dashboard?
Let me show you the step by step approach to Delete the dashboard with a practical example. Before we delete a dashboard, let me show you the existing dashboards in my workspace.
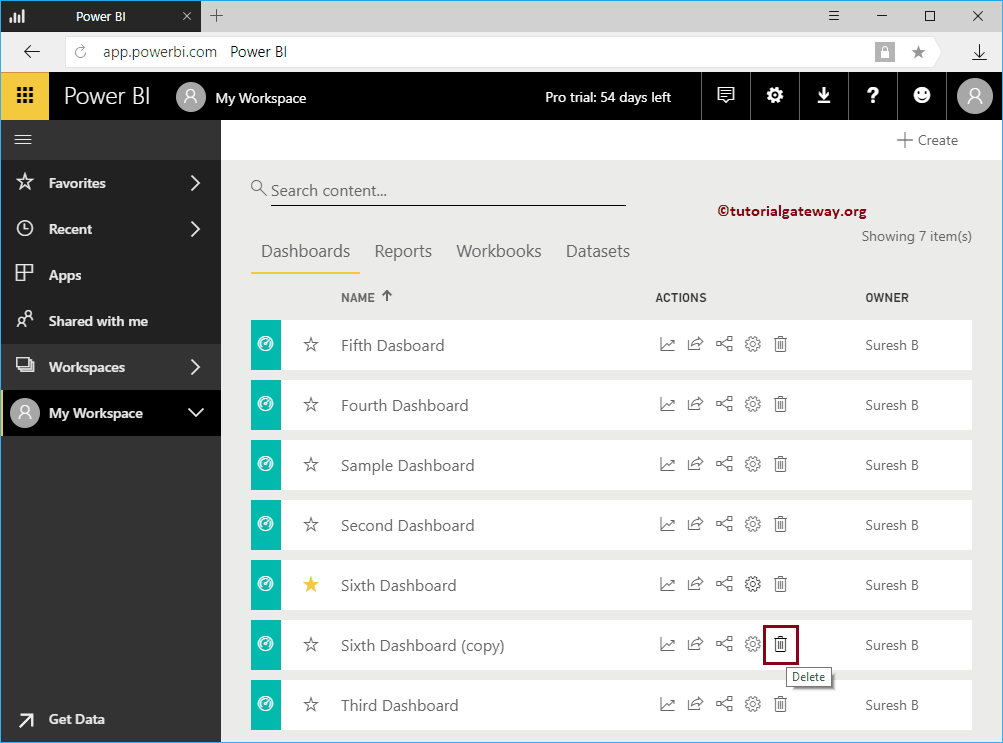
To view them, please click on the Power BI My Workspace and then go to the Dashboards tab. From the screenshot below, you can see that there are seven dashboards.
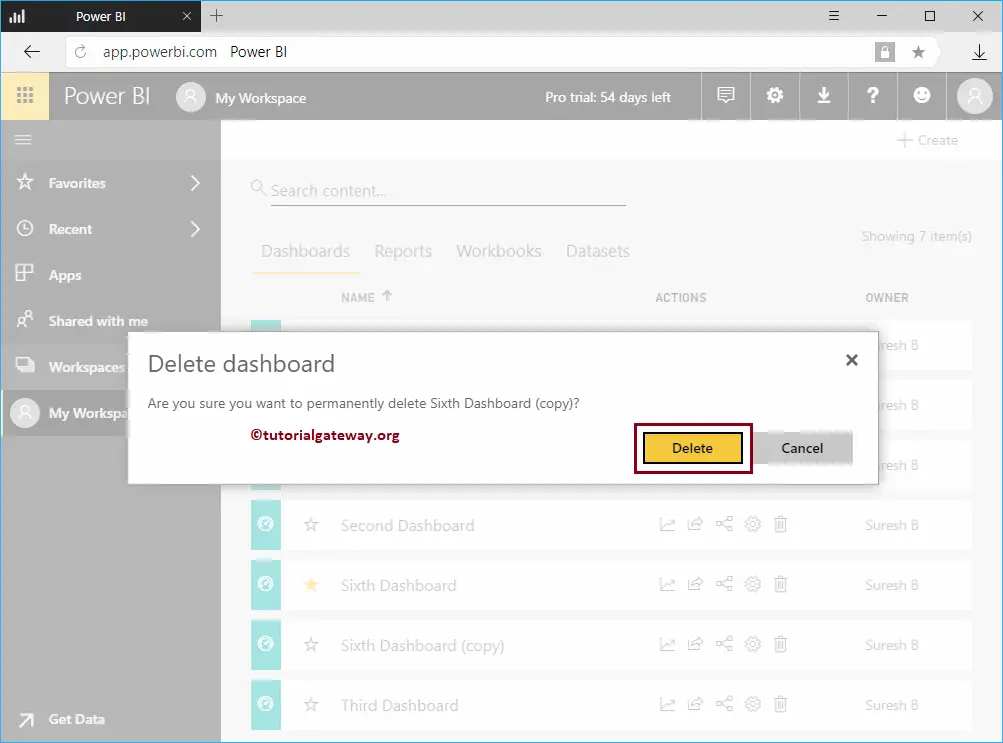
In this example, we will Delete the Sixth Dashboard ( Copy ). It is just a copy of the sixth dashboard. To Delete a Dashboard, click on the Delete button under the Actions section, as shown below.
Clicking the Delete button displays a confirm box. From the below Power BI screenshot, please select the Delete button to confirm the deletion. It will delete the Sixth Dashboard copy in our dashboard list.