The basic Power BI Filters are useful to restrict the data as per the requirements. For example, we can use basic filters to exclude a product from the display or display the top/bottom 10 performing records. Let me show you how to create basic filters with an example.
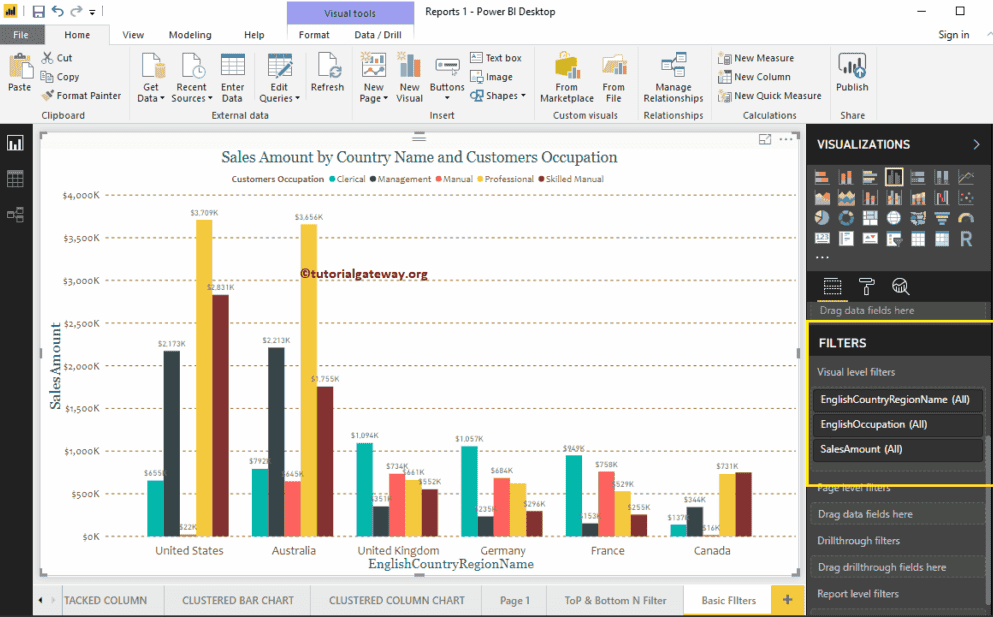
To demonstrate the Basic Filters, we will use the Clustered Column Chart we created in our earlier post. As you can see from the screenshot of Power BI below, we used the Country Name as the Axis field, Occupation as the Legend field, and Sales amount as the Value field.
Different Types of Filters in Power BI
Under the Filters section, you can see the list of available filters.
- Visual Level Filters: These include Filters on Dimension, Filters on Measures, Basic Filters, Advanced Filters, and Top N filters.
- Page-Level Filters: These Page Level Filters apply to all the visuals present on the current page.
- Drill through Filters: This Drill through Filters helps you drill through a particular region, or specific category, etc.
- Report Level Filters: These Report Level Filters apply to all the pages that are present in the current Report.
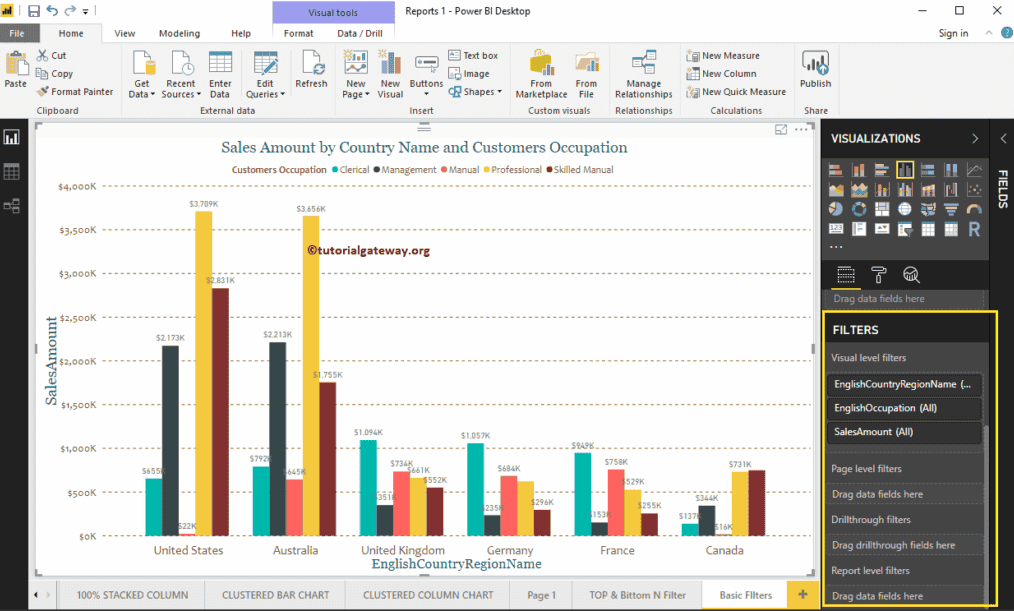
Let me expand the English Country Region Name (in Short Country) to see the filter types.
Power BI Filter Types
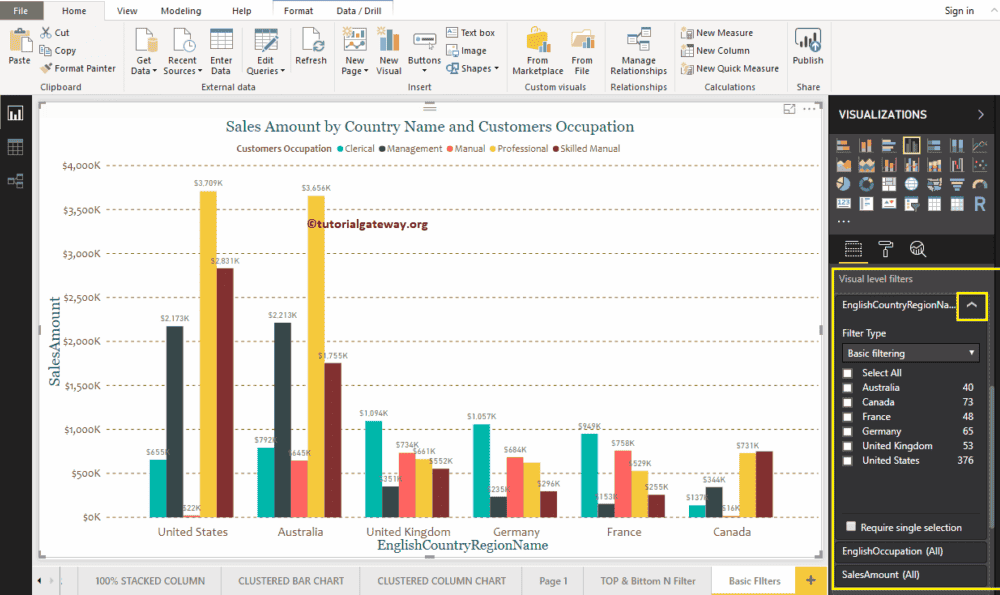
Use the drop-down list to see the filter types available for the dimension.
- Advanced Filtering: This option helps you to use more advanced options like starts with, ends with, contains, etc.
- Basic Filters: It is used to perform basic operations.
- Top N: Use this to find the top 10 records or the bottom 10 records.
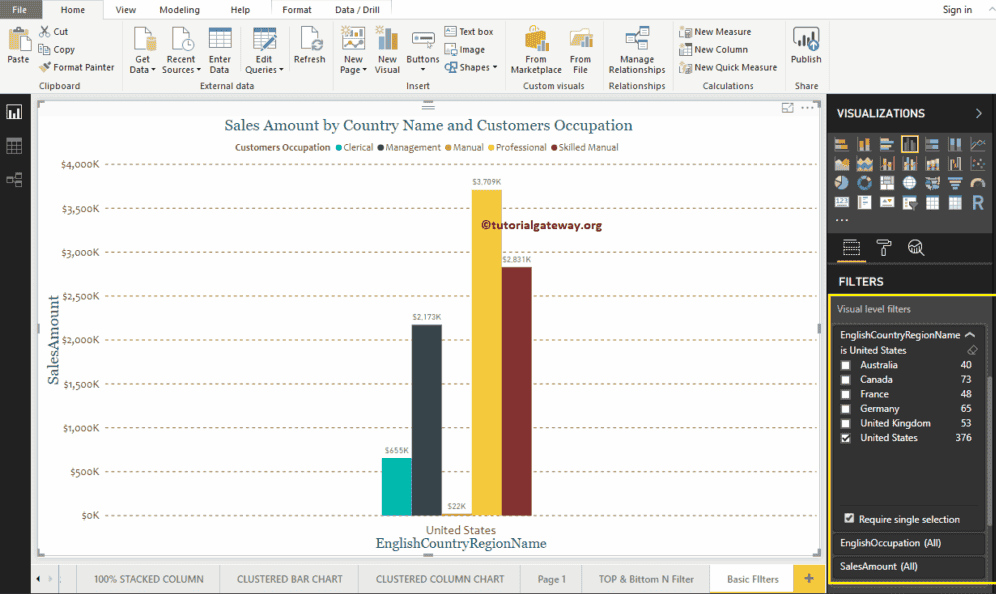
We want to discuss the basic filters in this example, so let me select the same. Selecting Basic Filters in Power BI displays the available rows for this column. You can use the checkboxes to select One, None (or All)
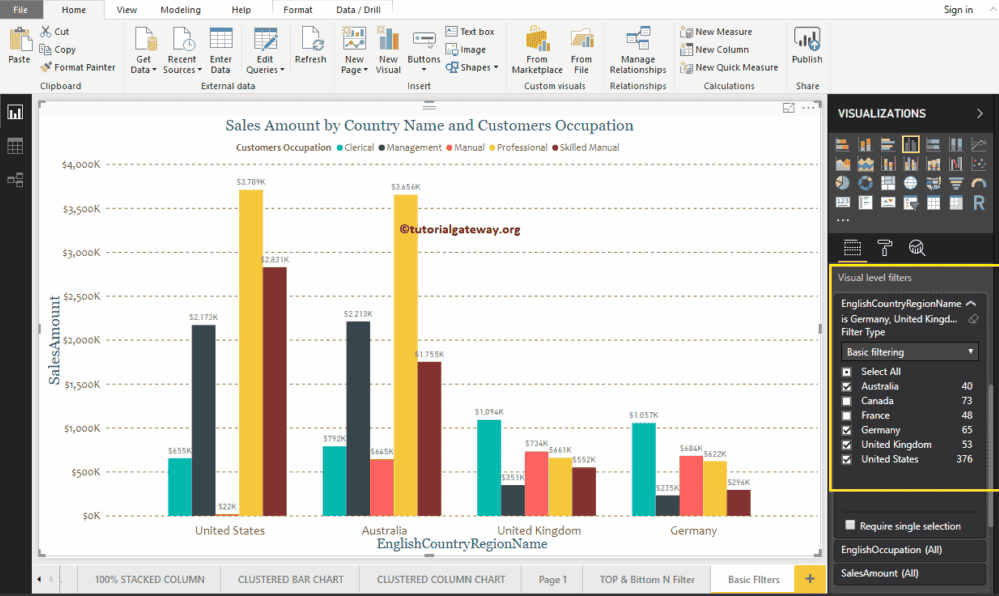
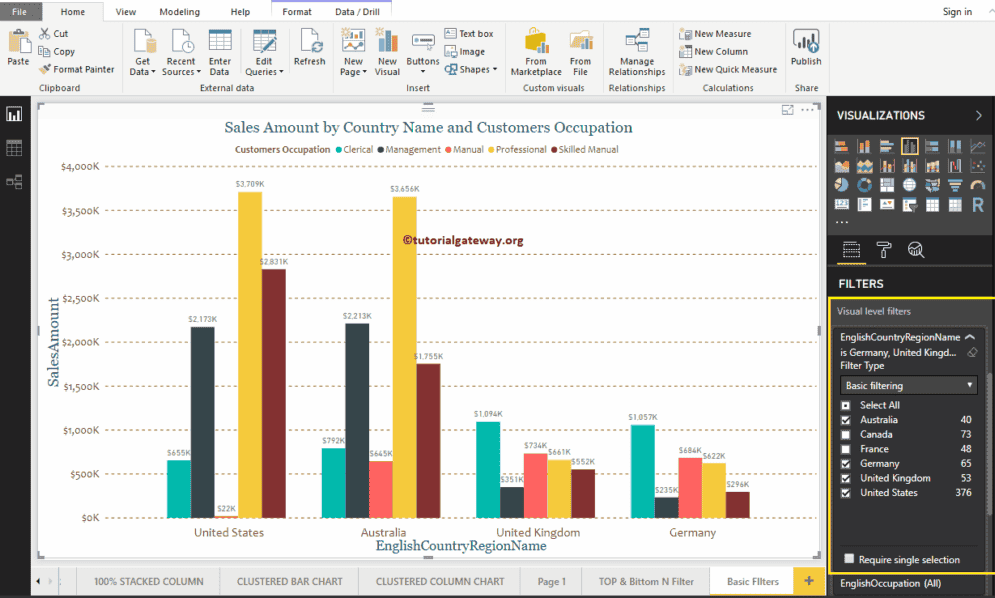
Let me select Australia, Germany, the United Kingdom, and the United States. The screenshot below shows that the clustered column chart displays the columns that belong to selected countries.
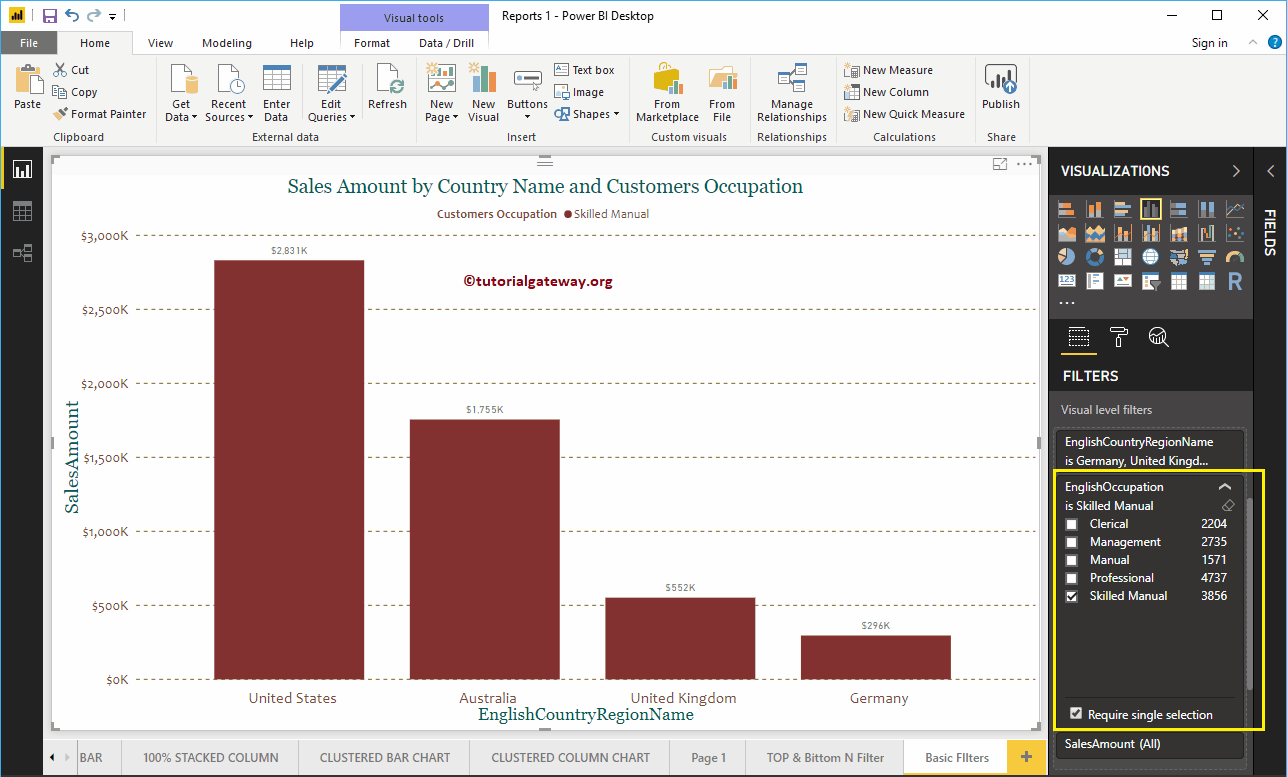
Required Single Selection: It restricts us from selecting one field at a time. Now you can choose only one country name at a time. As you can see, we selected the United States.
By unchecking the filter Required Single Selection property, you can select multiple fields.
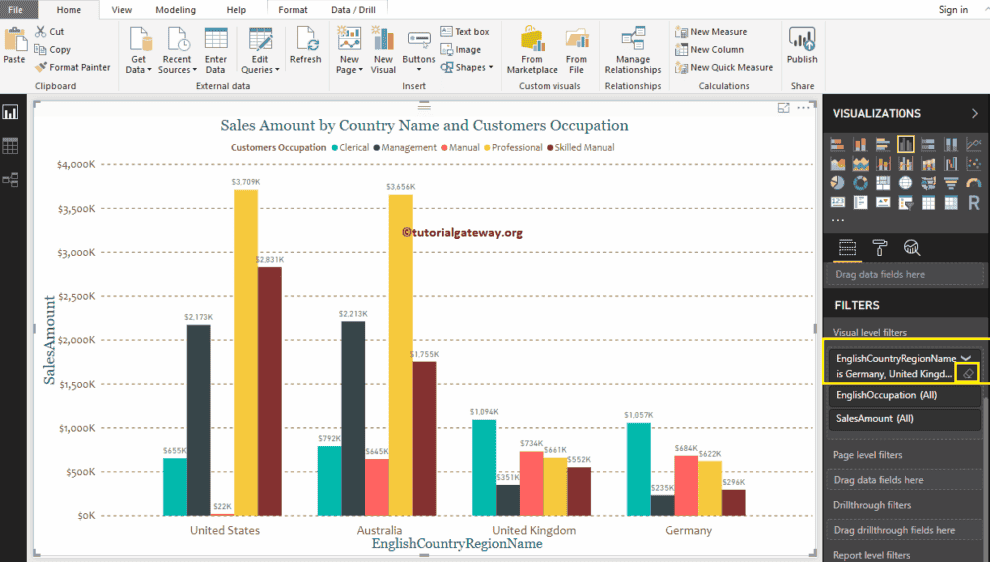
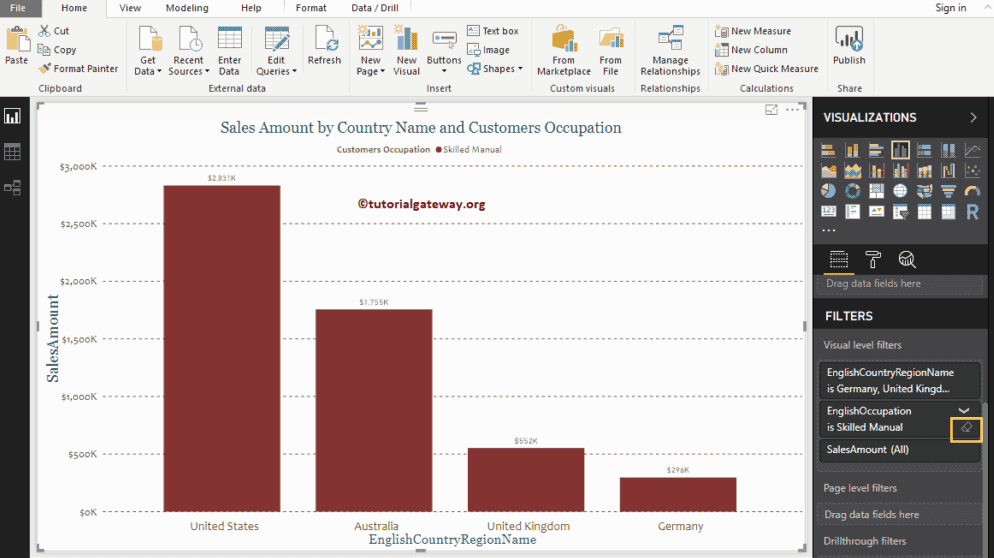
Clicking that little tiny clear filter button helps you remove the existing filters.
Power BI basic Filters on Multiple dimensions
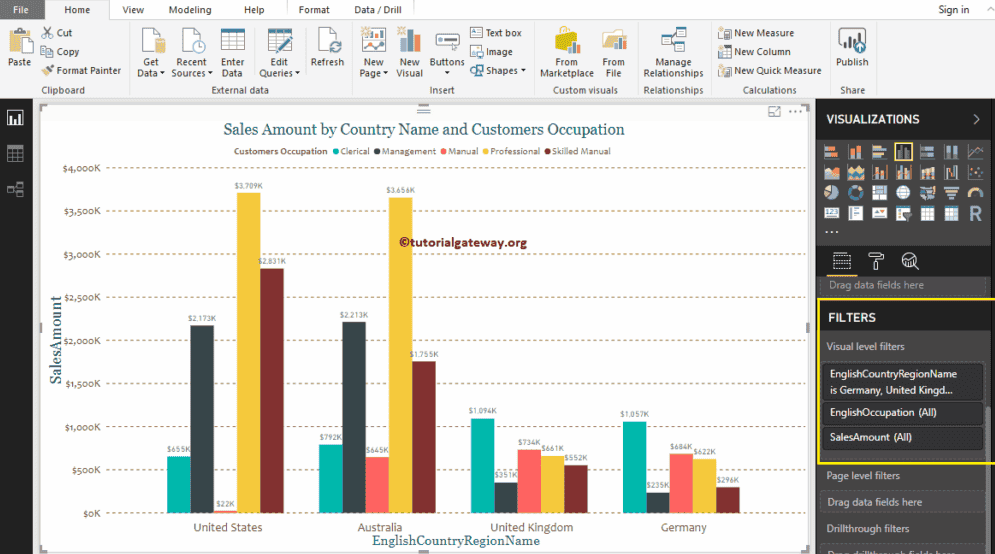
Let me expand the English Occupation column to apply filters on Occupation. Please select the Management, Professional, and Skilled Manual fields as the basic filtering values. As you can see from the screenshot below, it displays 4 countries that we selected in the Countries Filters and three occupations that we chose now.
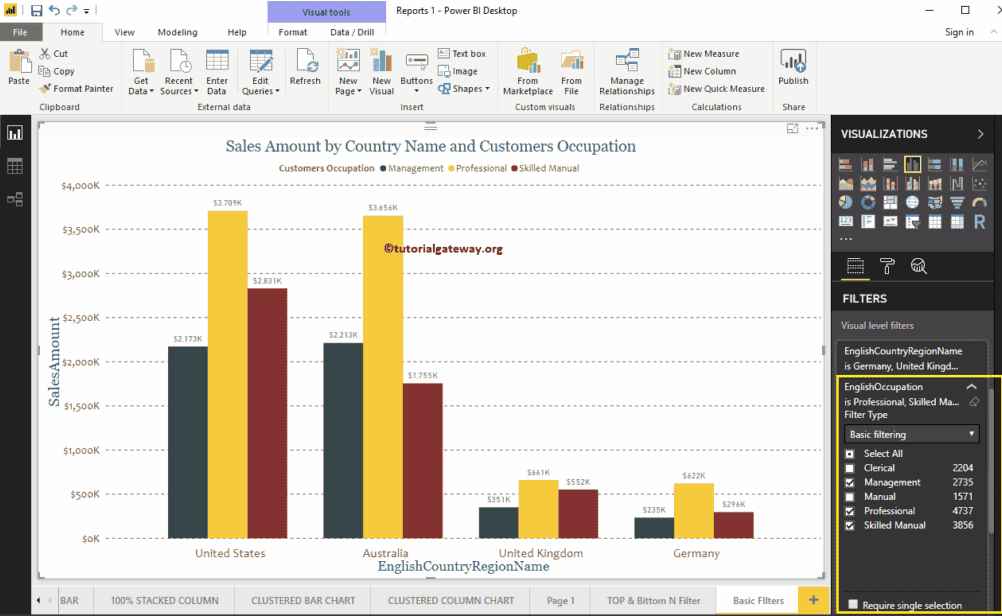
This time, we select a single field (Require Single Selection option), i.e., Skilled Manual.
Delete Power BI Filters
Click on the tiny little Clear filter button to delete existing filters. For the demo purpose, let me delete the filter on the Occupation field.
You can see that the Occupation field has no Filters
Let me remove the filters on the Country
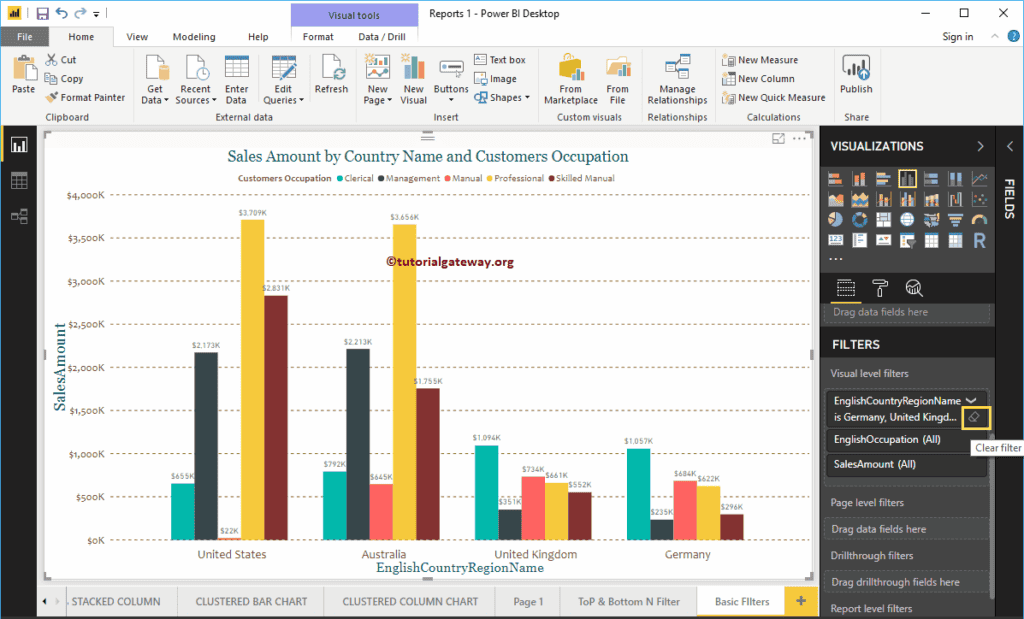
Now you can see there are no filters in this Clustered Column Chart.