This article shows how to create Power BI Filters on Measures with an example. The Measures Filters are useful for filtering the measures (metric values) in an existing report. For instance, we can use Filters on Measures to display the products with sales greater than the threshold, less than average, etc.
How to Use Power BI Filters on Measures
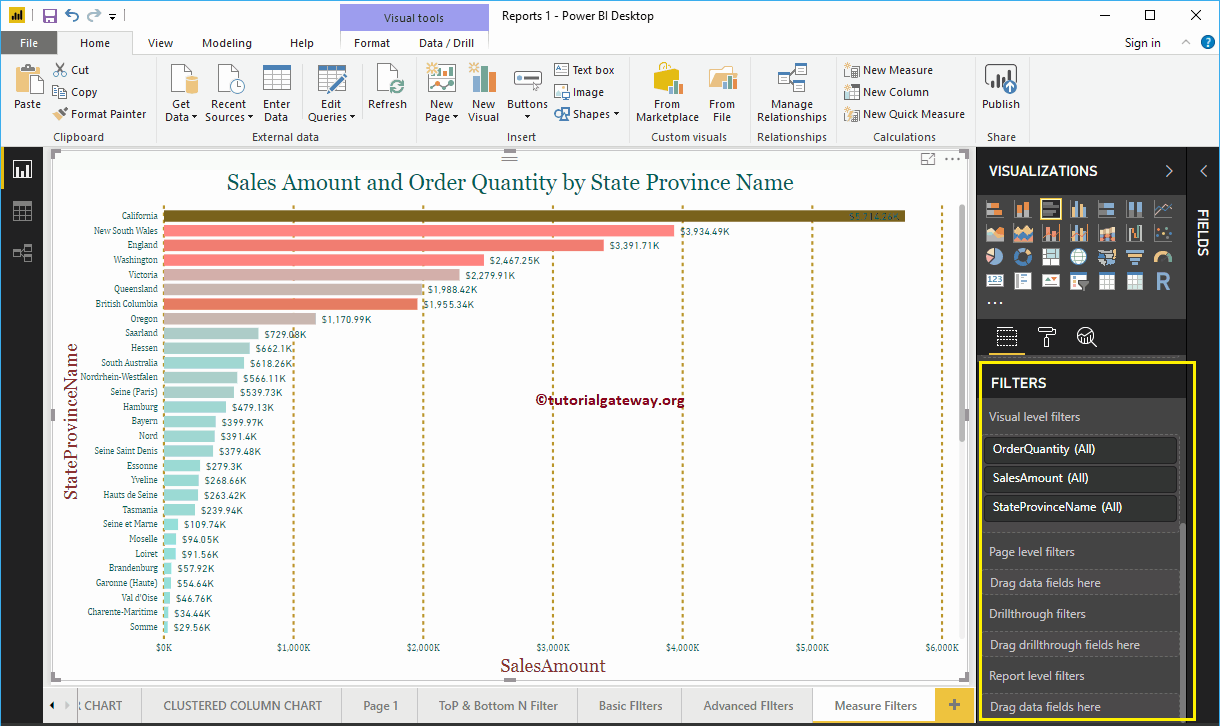
To demonstrate the Measure Filters, we use the Bar Chart we created in our earlier post. As shown in the Power BI screenshot below, we used the State Province Name as an Axis field.
We used the Sales amount as a Value field and Order Quantity as Color saturation. Under the Filters section, you can see the list of available Power BI Filters on Measures.
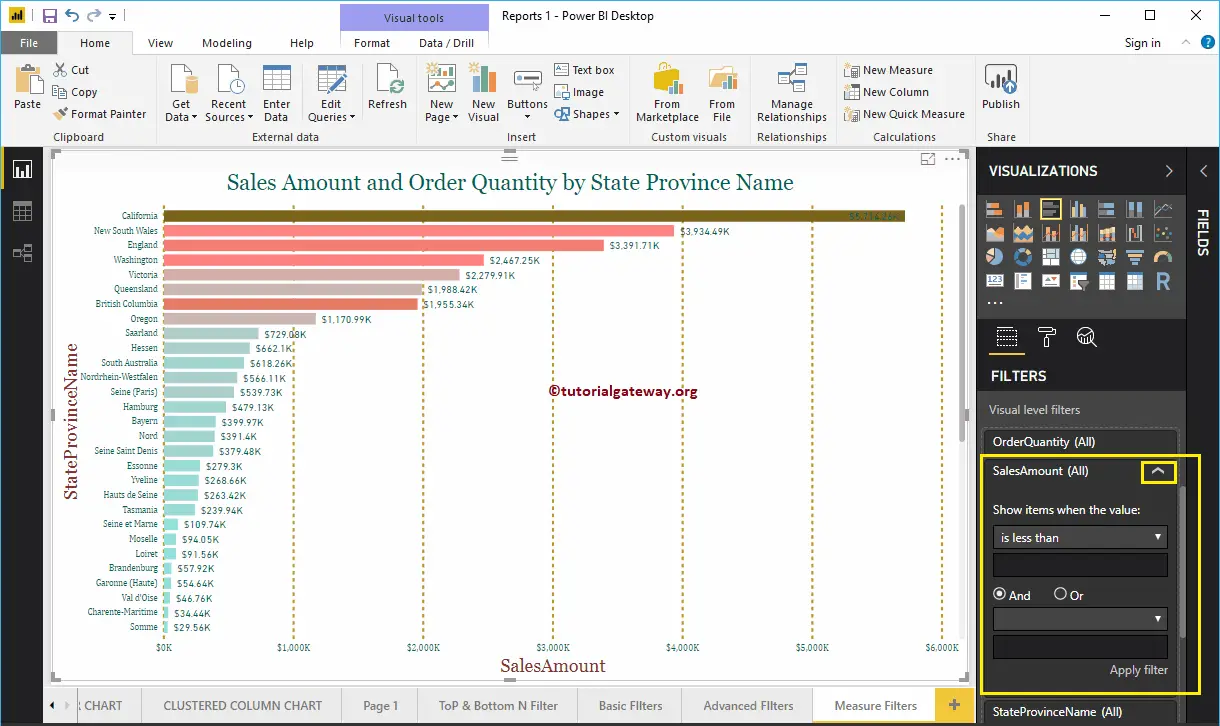
Let me expand the Sales Amount to see the filter options. The following is the list of options available for Measure filters.
- Show Items when the Value: Please select the operator you want to use.
- Empty Text box: Please specify the value.
- And Or: Same as AND and OR Operators SQL. Use this to concatenate multiple filters.
- Empty drop down list: Please select the second operator you want to use.
- Empty Text box: Please specify the value for the second filter.
Show Items Options
The following is the list of Power BI Filters on Measures options available under the Show items when the value section:
- is less than: When this option is selected, it checks each record against the Value. If it is less than the user-specified value, then the record will display.
- is less than or equal to: If it is less than or equal to the given value, the record is displayed.
- greater than: Displays the records whose sales amount is greater than the specified value
- is greater than or equal to: Displays the records whose sales amount is greater than or equal to a given value.
- is: If the record matches exactly with the value, then the record will display.
- not: If the record is not equal to the value, then the record is displayed.
- is blank: This option displays all the records with empty values.
- is not blank: It displays all the records with no blank values.
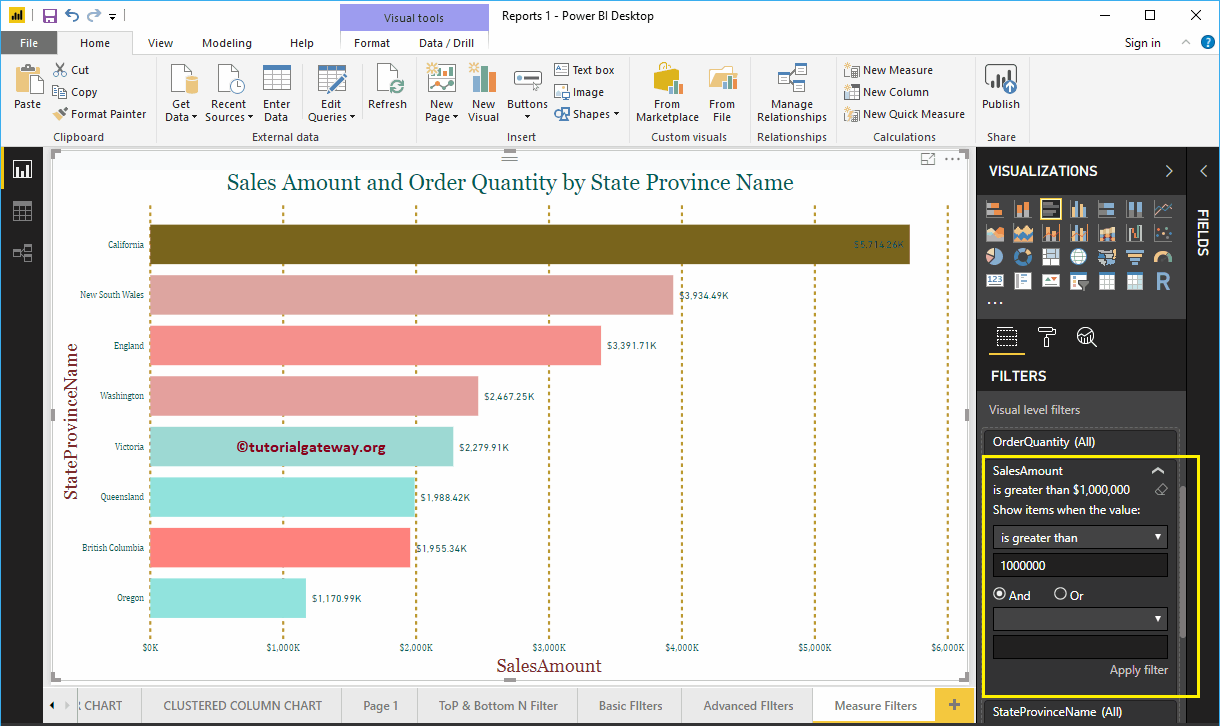
For these Measure Filters in Power BI demonstration purposes, we selected is greater than as the operator and 1000000 as the value. Next, click the Apply Filter option (hyperlink) to apply the changes.
The report below displays the states whose Sales Amount is greater than 1000000.
Let me change the operator to is less than and the value to 1000. From the image below, you can see that the report displays the states whose sales amount is less than 1000

This time, we are using the blank operator. So you can see that the report is blank because we don’t have any state that contains empty sales.

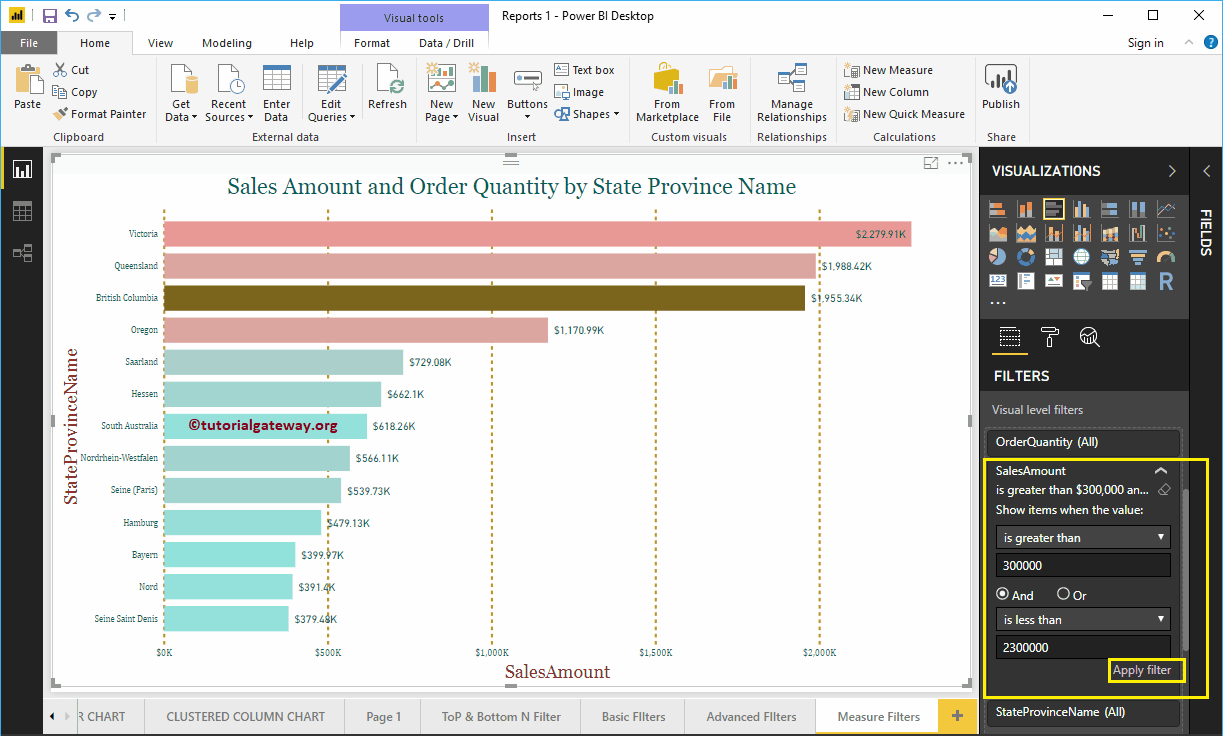
Let me use multiple Power BI filters on the Sales Amount Measure column. The First filter finds the states with sales greater than 300000, and the second filter finds the states whose sales are less than 2300000.
We used the AND operator to join those two filters.
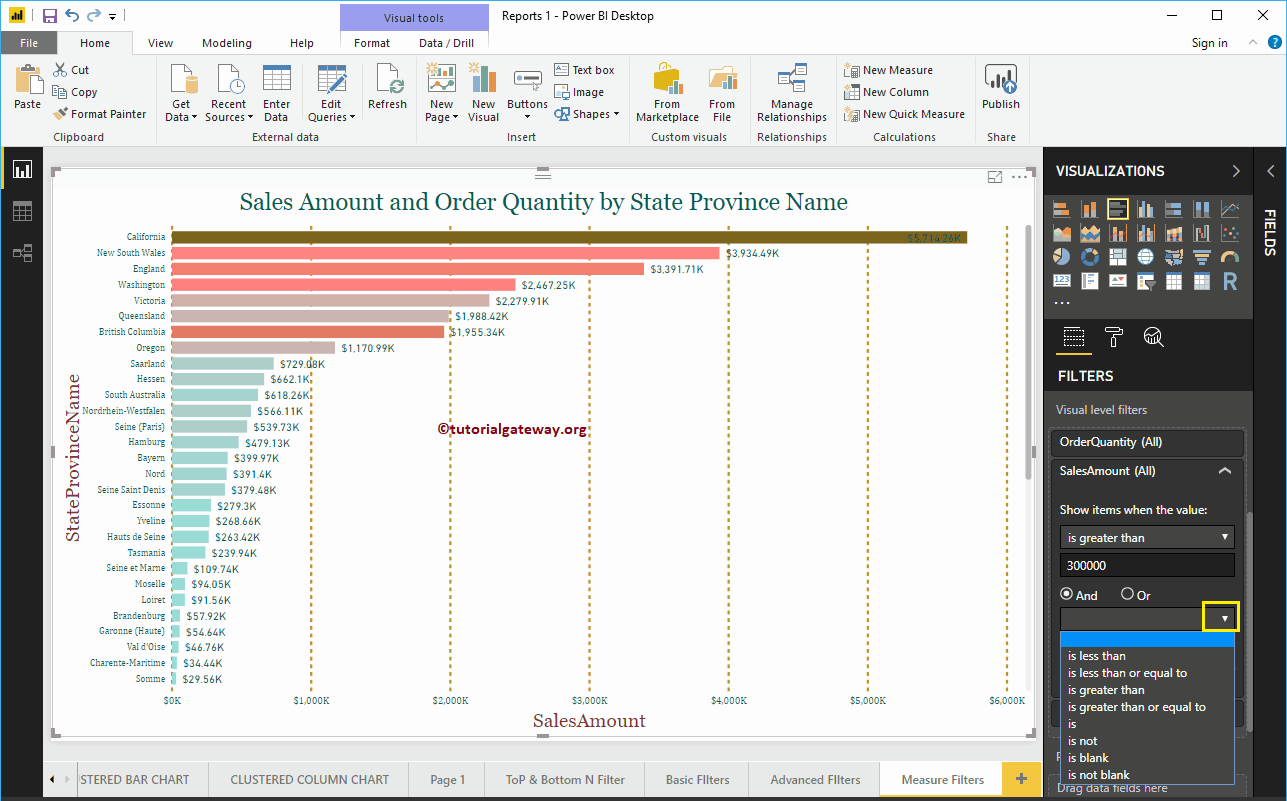
The screenshot below shows that the report displays the states whose sales amount is greater than 300000 and less than 2300000.
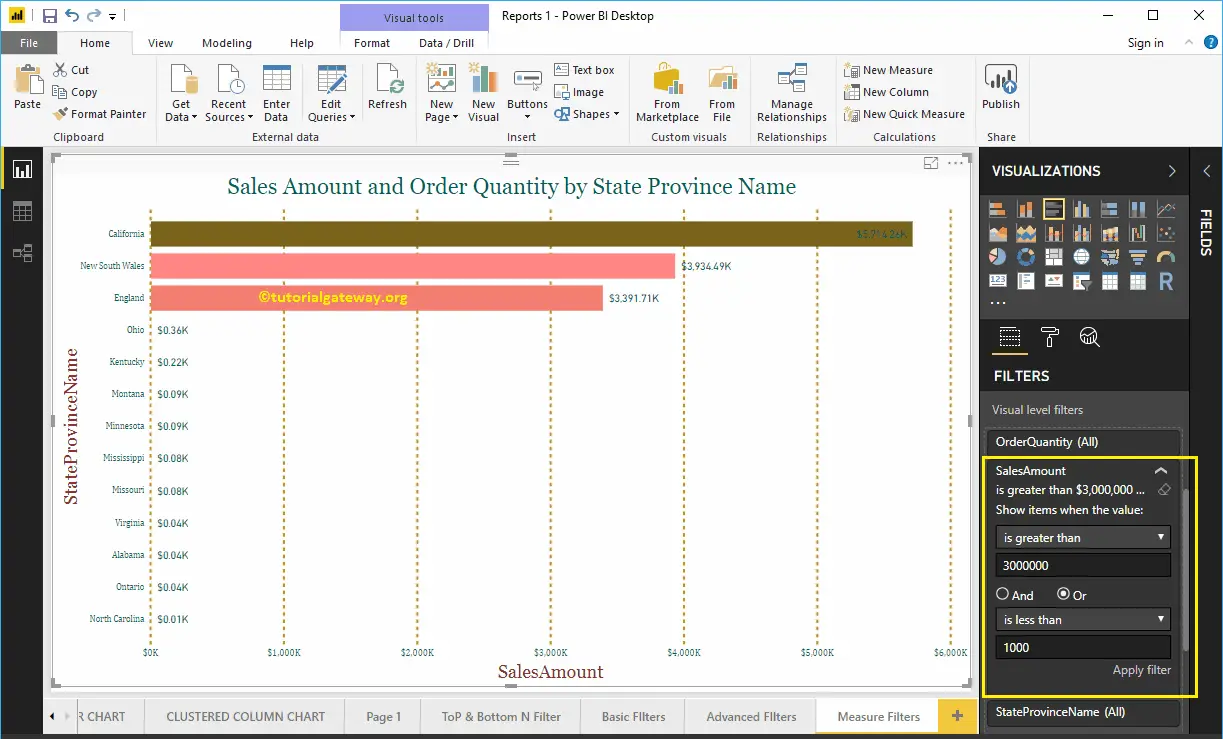
The report below displays the states whose sales amount is greater than 300000 or whose sales amount is less than 1000.
Comments are closed.