Power BI Drill through Filters are useful to drill through a particular field, or we can say apply filters on reports at a multi-level. Let me show you how to create Drill through Filters with an example.
To demonstrate the Power BI drill through filters report, we are going to use the Countries hierarchy. Please refer to the Create Hierarchy article to understand the steps involved in creating a hierarchy.
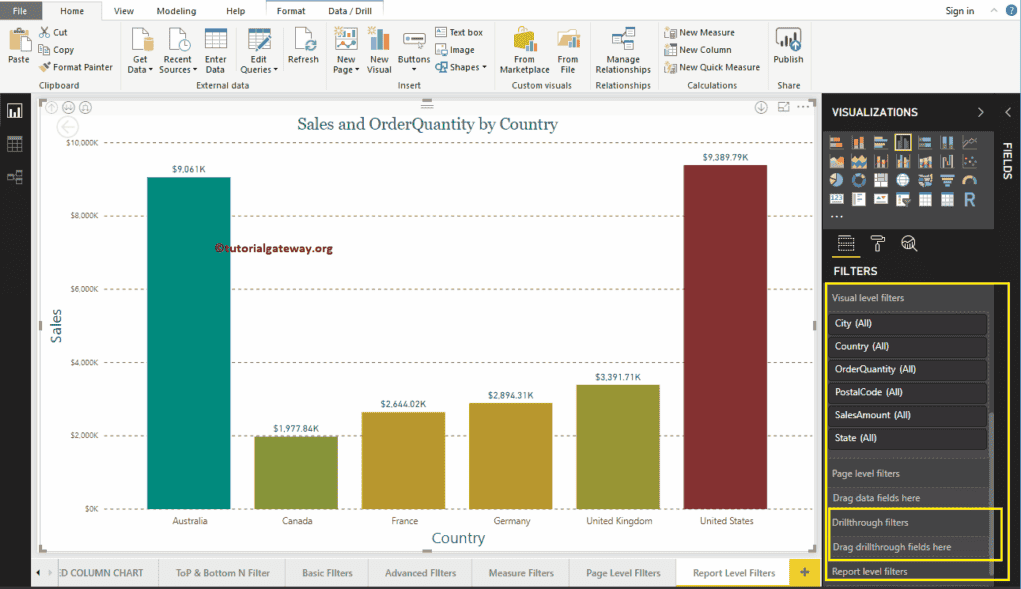
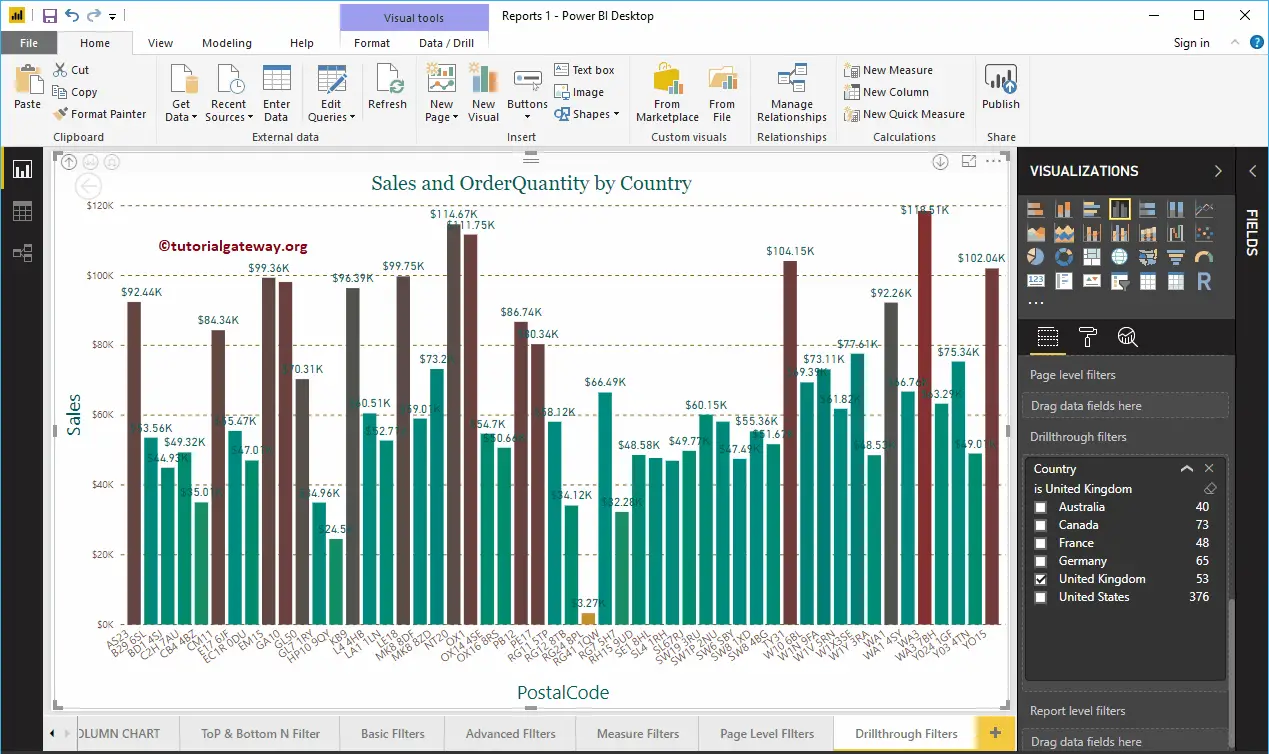
As you can see from the below screenshot, we created a Column Chart by adding the Country hierarchy in the Power BI Axis Fields. The Country hierarchy includes the country name, State, City, and Postal Code. Next, we added the Sales amount as the Value field and Order Quantity as the Color Saturation.
How to create Drill through Filters in Power BI
Under the Filters section, you can see the list of available filters. You have to use the Drill through the Filters section to create a filter at multi-level.
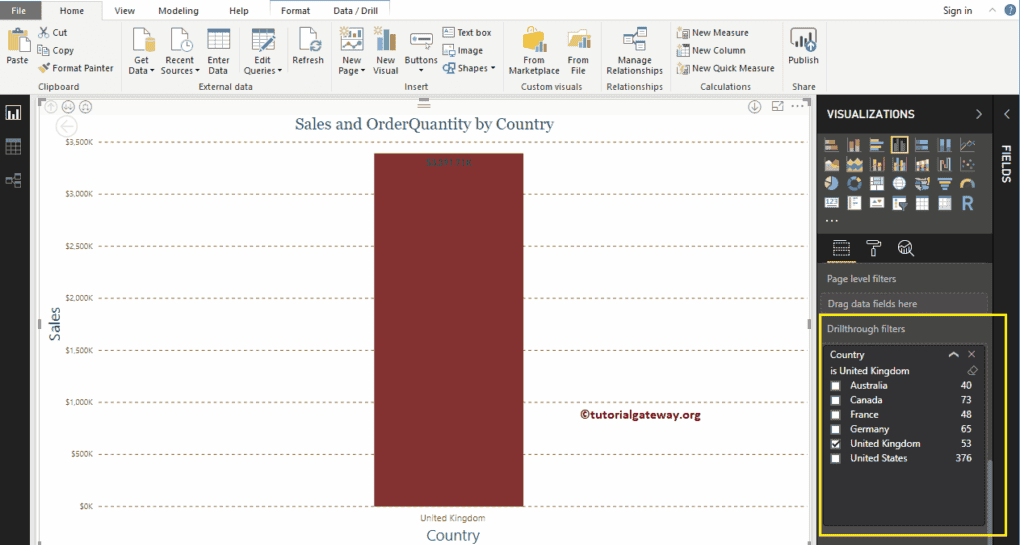
Let me drag and drop the Country from the fields section to the Drill through the Filters section. Expand the Country to see the filter types. For the Power BI Drill through Filters demo purpose, let me select the United Kingdom.
From the screenshot below, you can see that the Column chart displays Sales for the United Kingdom. By default, you can only select One field (Country) at a time.
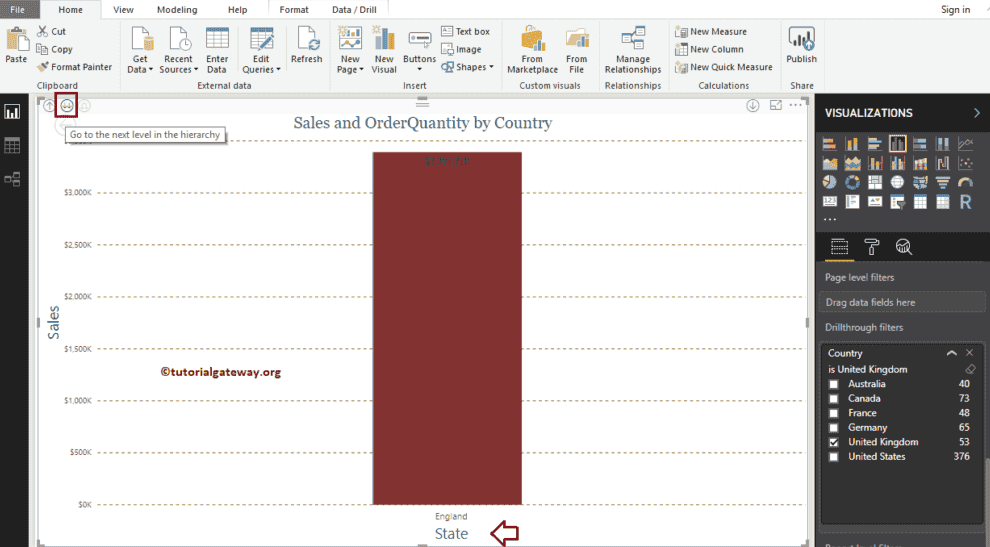
Let me drill down to the next level. I suggest you refer Drill Up and Down reports article to understand the Multi-level reports.
Now you can see the Sales by State (level 2). If you notice closely, it is displaying the sales for England because this is the only state available for the United Kingdom.
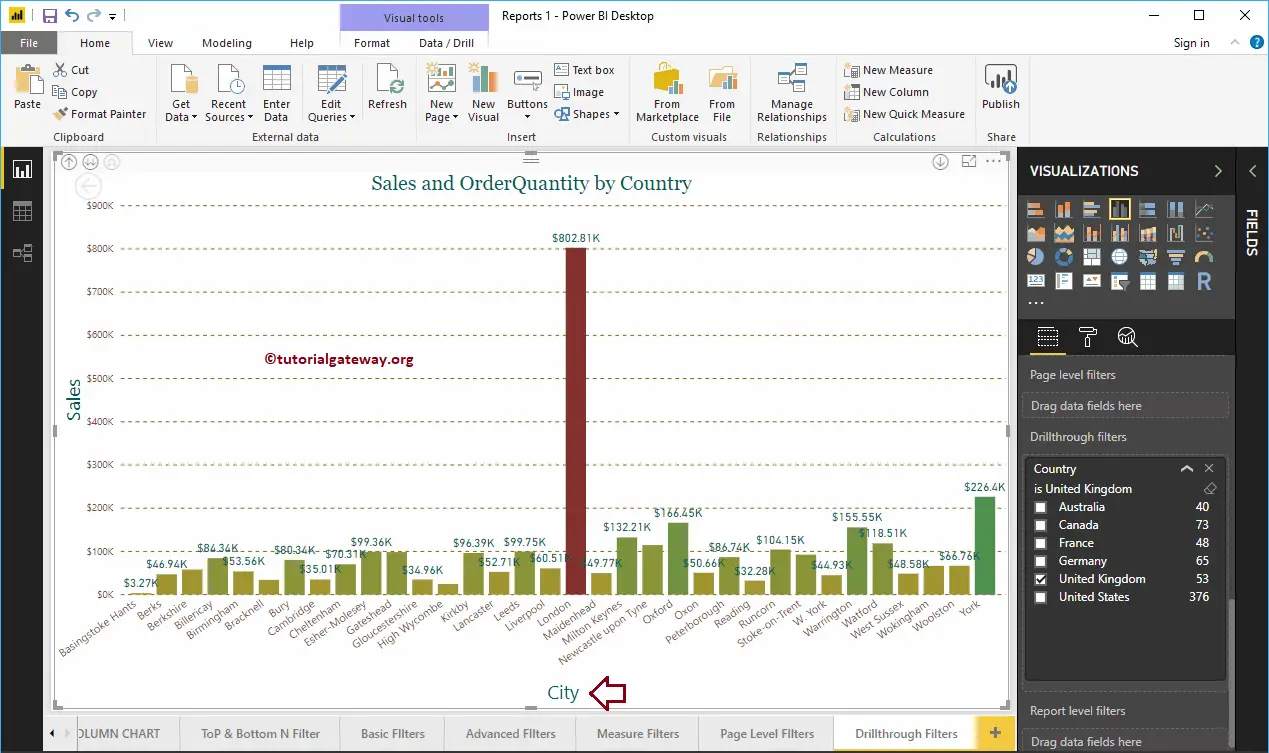
Let me go to another level of Drill through Filters. Now you can see the Sales by Cities present in the United Kingdom (level 3).
You can drill down further to see the Sales by Postal Codes present in the United Kingdom
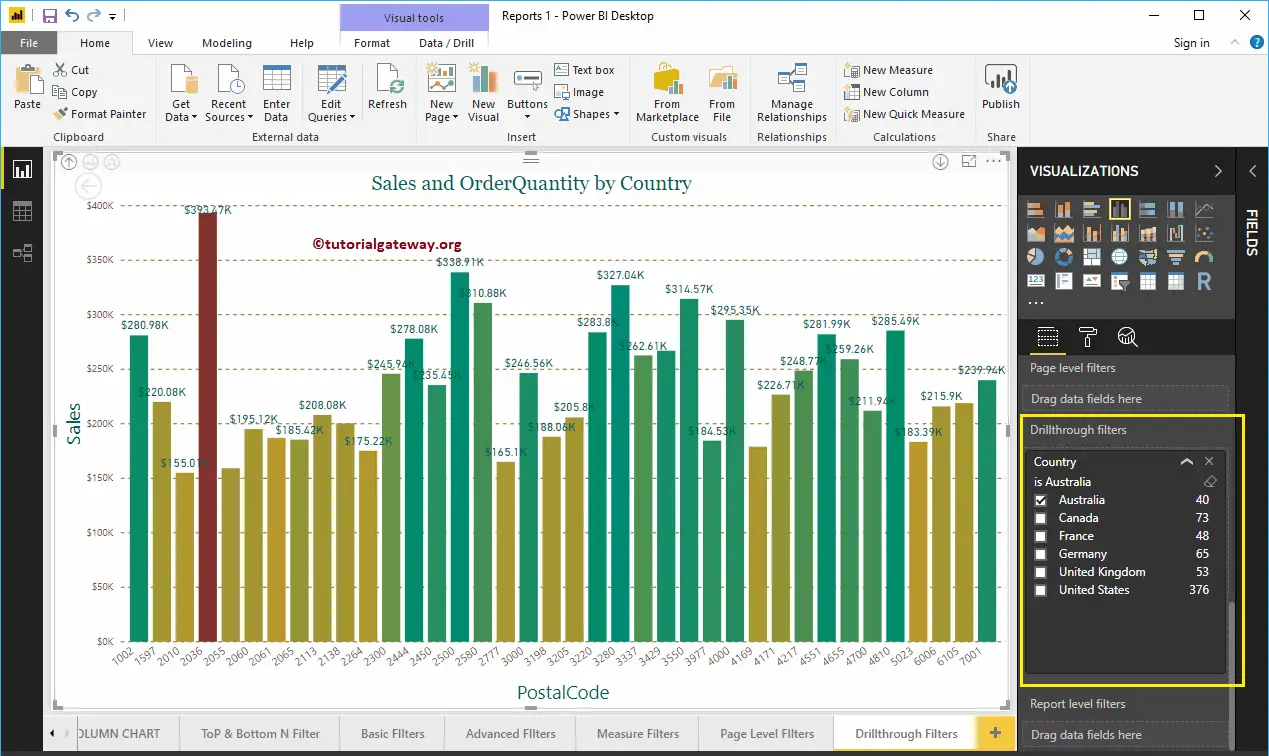
This time we were selected in Australia and went all the way down to the Postal Codes level. From the screenshot below, you can see the Sales by Postal Codes present in Australia.
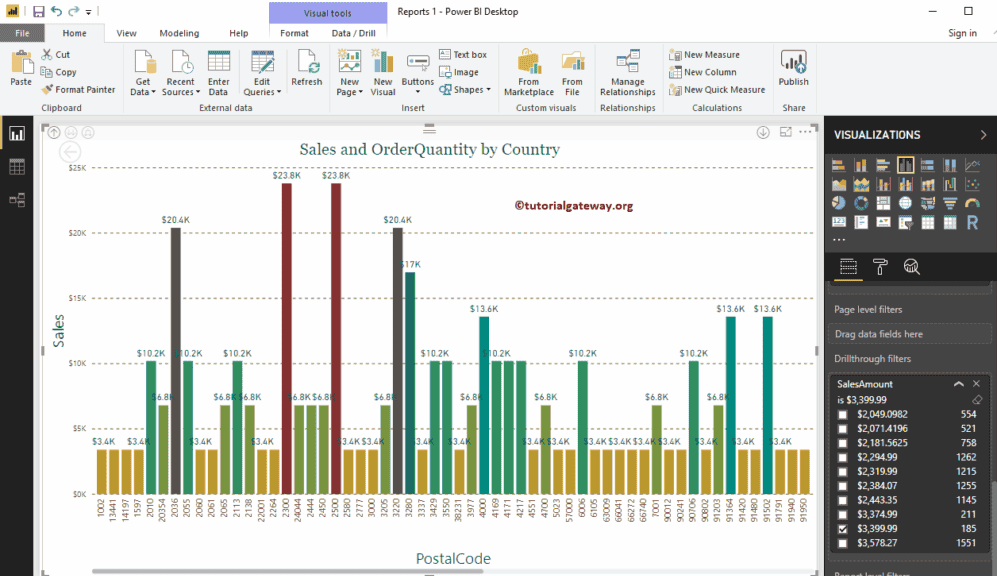
Let me remove the existing Power BI Drill through filter and drag and drop the Sales Amount from the fields section to the Drillthrough Filters. Next, expand the Sales Amount to see the filter options. Let me select the Sales Amount as 3399.99
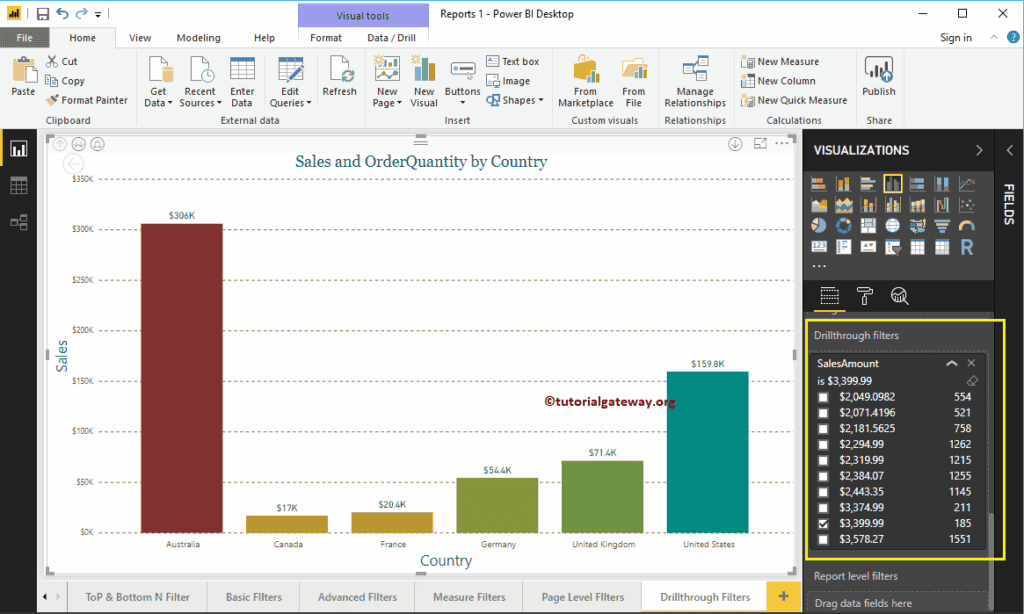
Now you can see the States whose Sales Amount is at least 3399
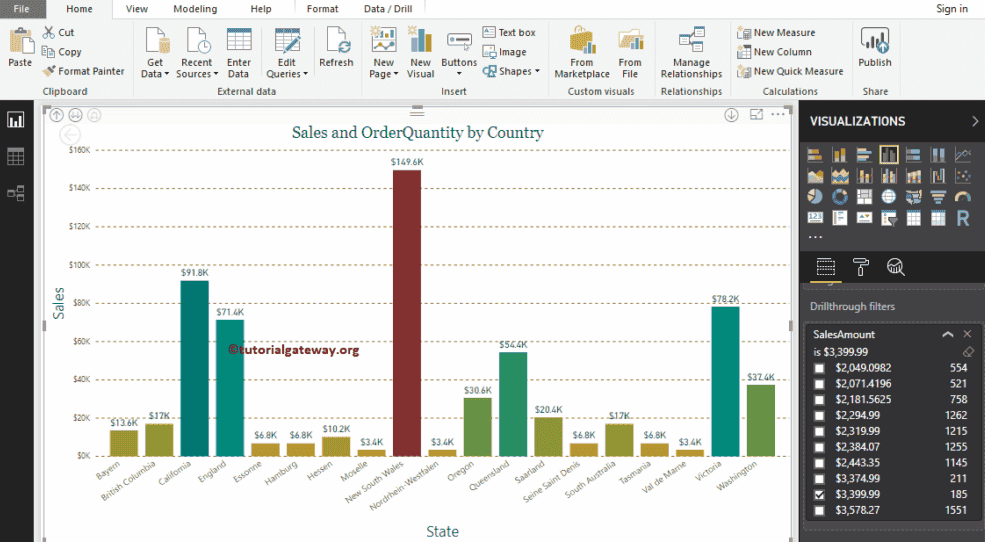
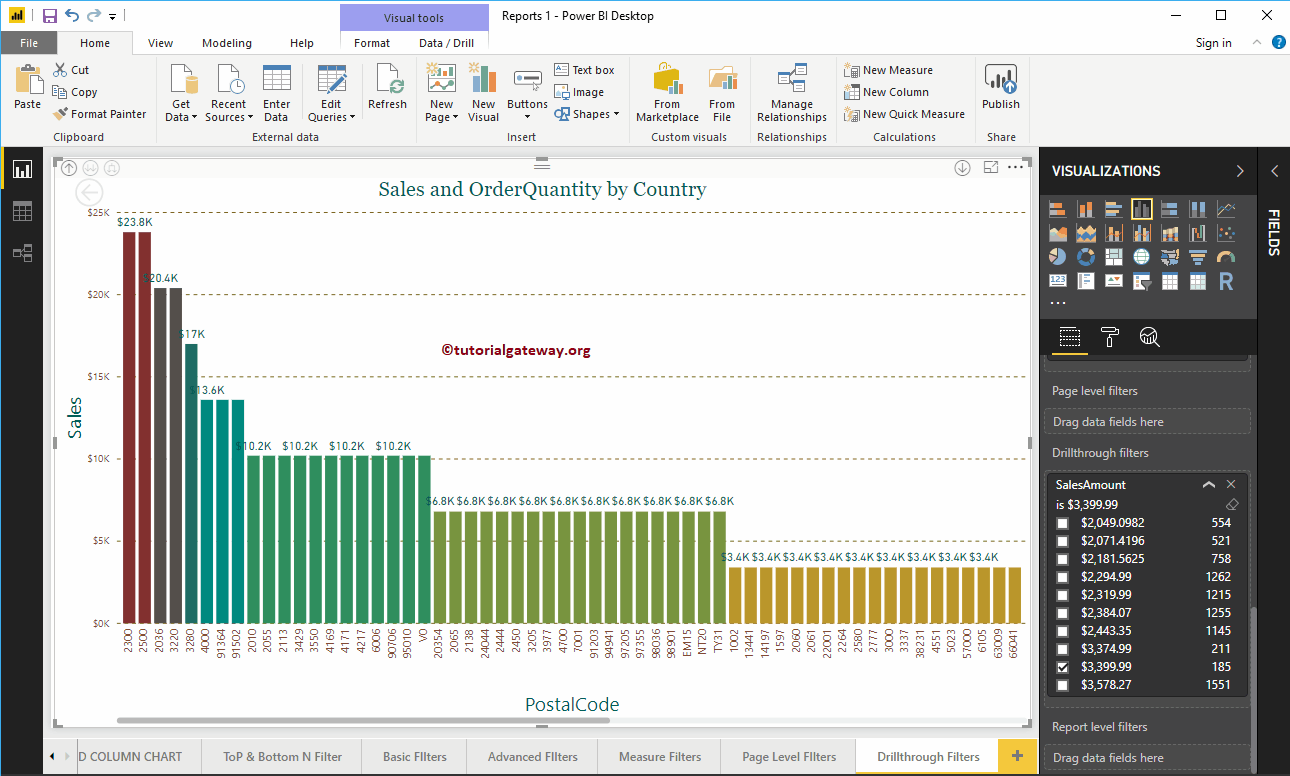
Now you can see the Postal Codes whose Sales Amount is at least 3399
Let me Sort them by Sales Amount
Comments are closed.