In Microsoft Power BI, you can create a calculated measure (or numeric aggregated calculation) to define custom calculations from existing columns. This article shows you how to create calculated measures with an example.
A calculated measure in Power BI is a simple formula or DAX expression to create a new custom value based on existing data or other measure values. You can use them to perform complex calculations and develop KPIs (key performance indicators. For example, if your data doesn’t have the profit column, you can use the calculated measure to generate sales and product costs.
For simple arithmetic operations, you can manage without any knowledge of DAX. However, you should completely know how DAX works, its formulas, and supporting functions (built-in) to unleash the calculated measure’s full potential. To demonstrate these calculated measures, we use the Data Source we created in the Connect to SQL Server article.
How to Create Calculated Measures in Power BI
This section will provide a step-by-step approach to creating calculated measures. Although we use a simple DAX arithmetic operator in this example to create a calculated measure, the process will be the same for complex calculations. In order to create it, please navigate to the “Modeling” tab and click on the New Measure option.
Clicking the Power BI New tab opens the DAX formula bar with the default measures name, as shown below. You can use built-in DAX functions and operators within the formula bar to write your custom calculations. So, start writing your DAX expression here.
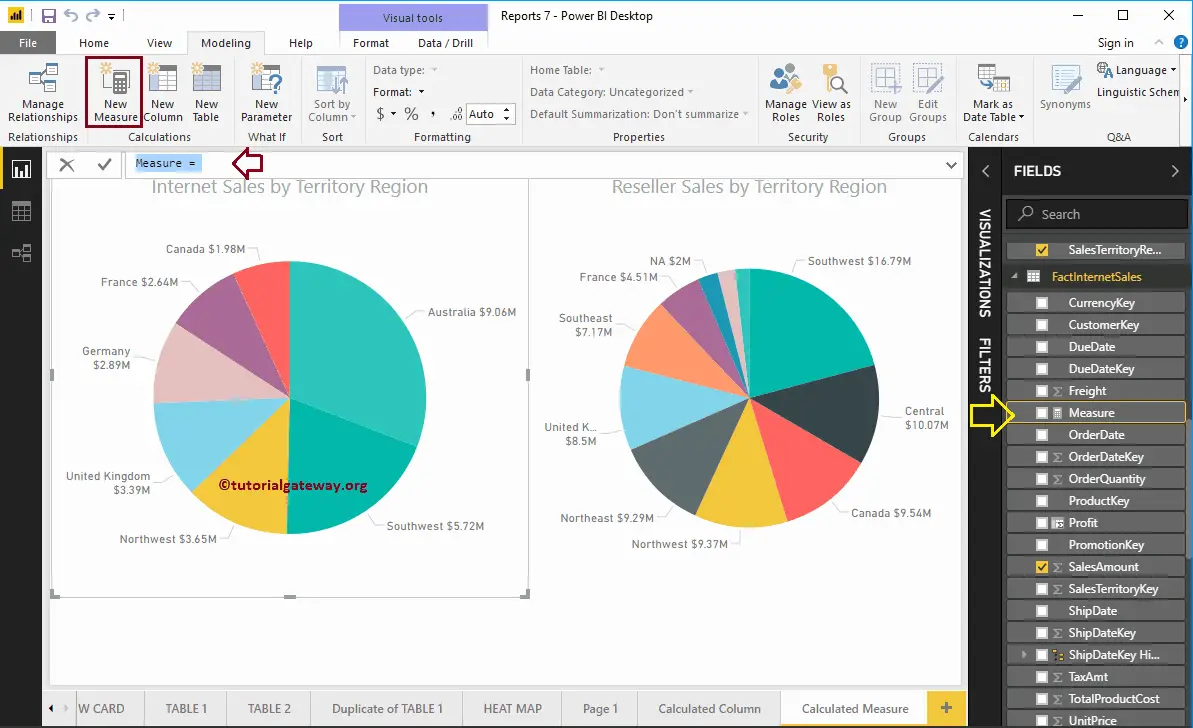
You can rename this as per your requirement. Let me rename this one as Total Sale. For the Power BI calculated measures demo purpose, we add the Internet Sales Amount, Reseller Sales Amount from Fact Internet Sales, and Fact Reseller Sales tables. Unlike calculated columns, you have to use the aggregated function to create them.
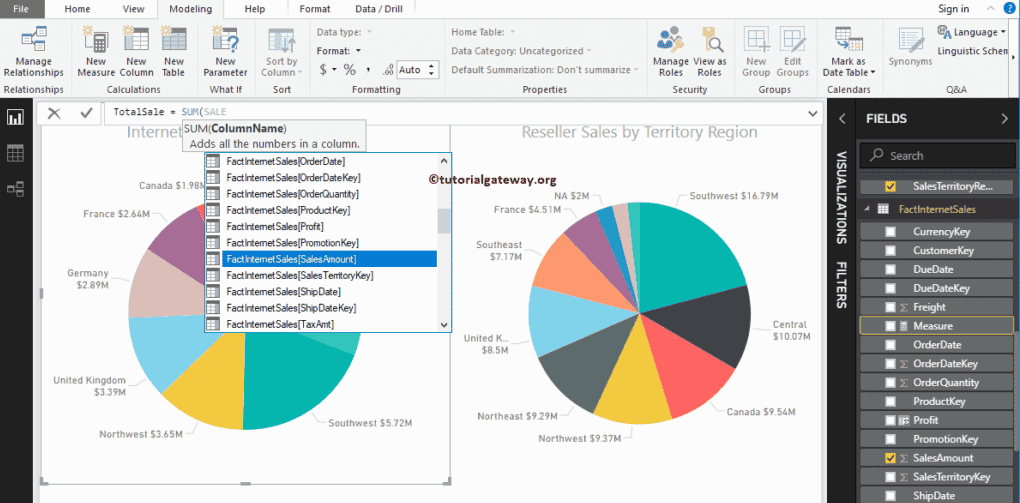
As you can see from the screenshot below, Power BI IntelliSense was showing the suggestions while I was typing.
After writing the DAX expression, clicking enter or any key, a new Measure called TotalSale will create and validate the expression.
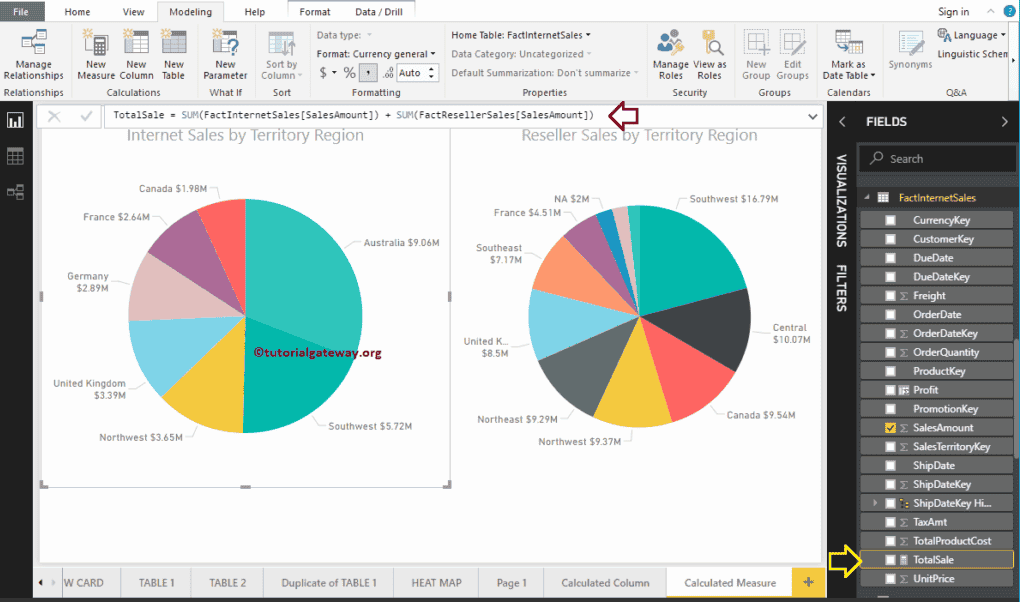
While using the calculated measure, if you find that the desired output is wrong or needs a complex expression, you can modify the existing one using the formula bar.
Using Calculated Measures in Charts
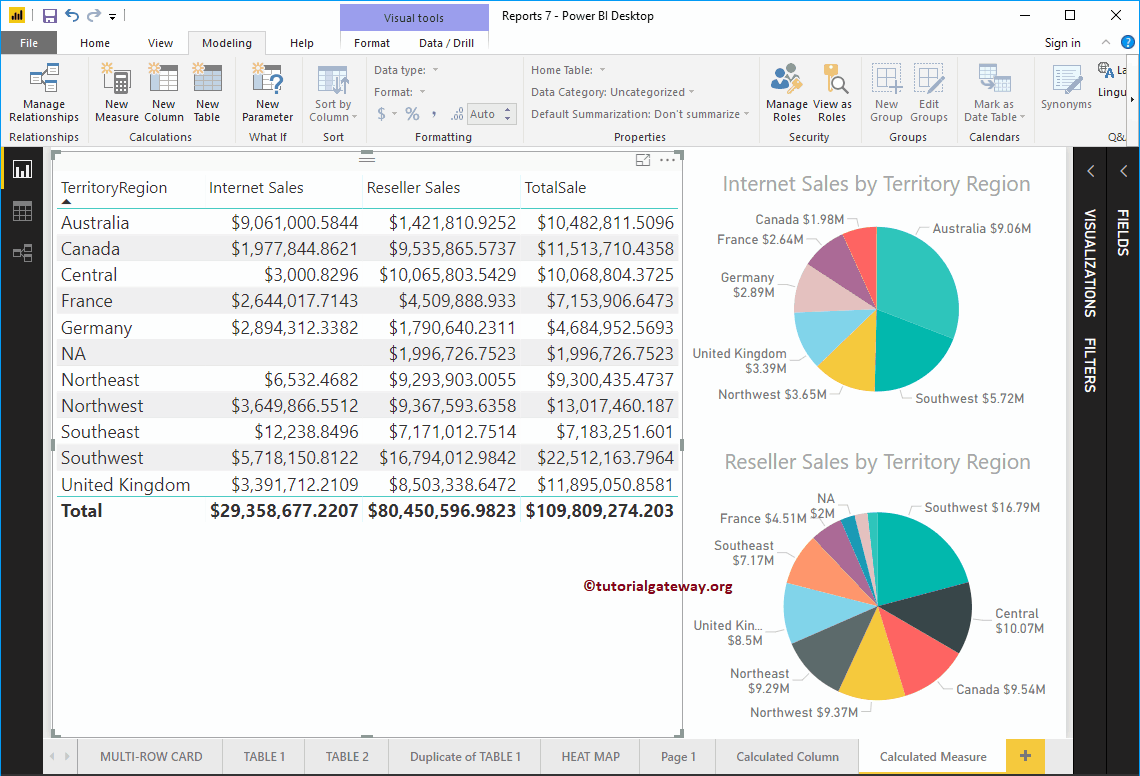
Once the calculation works successfully, the next step is visualizing the newly created Calculated Measure. It acts as any standard measure, so drag and drop it into Visualization fields. This section covers how to use the Calculated Measures in Tables and Charts.
Let me add the calculated Measure we created earlier to a Power BI Table. Please refer to the Table Report article to understand the steps involved in creating a table.
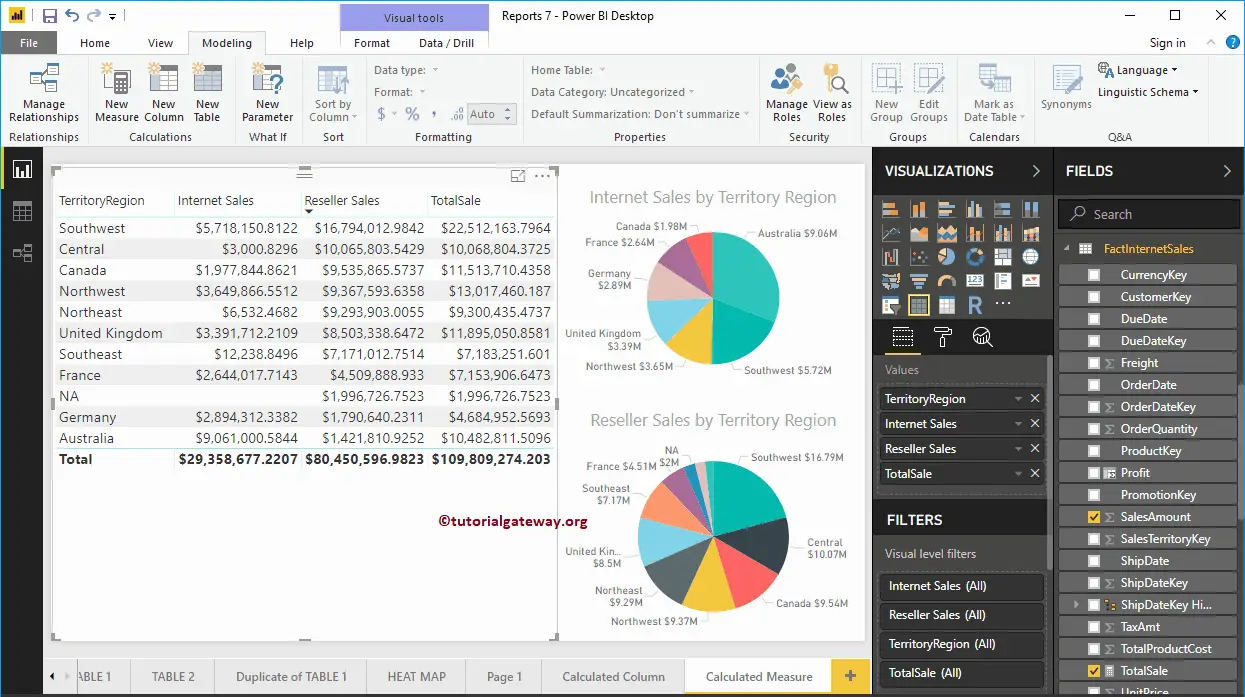
Let me minimize the Fields tab and Visualization so you can focus on table values.
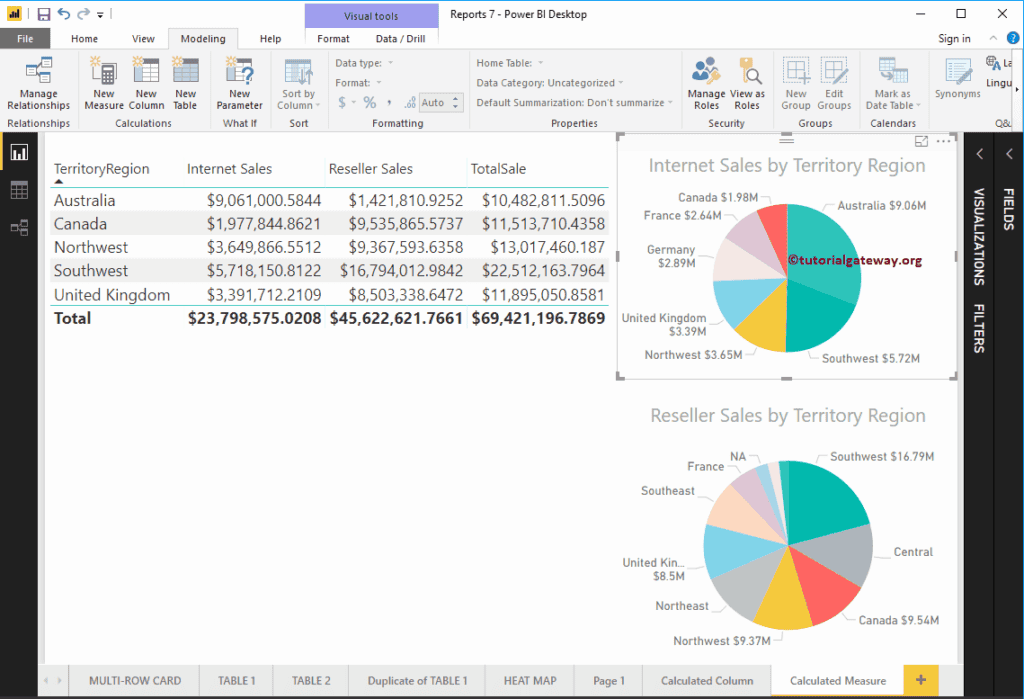
You can also apply filters on these too. From the screenshot below, you can see that we selected a few areas in our Pie Chart. The same has also been reflected in the table.
NOTE: Always use meaningful names that reflect their functionality or calculation. Avoid complex expressions and break down complex calculations into smaller measures.