In this article, we will introduce Power BI Q&A and provide an overview of its significance in data analysis, customizing questions, and advanced options. Q&A helps you ask business questions or analyze data using natural language. It means when you ask a question in a regular or everyday language, you can get visual insights into the data in the tables, charts, or graphs.
Power BI integrated the Q&A in My Workspace, enabling the users to interact directly with their data without writing DAX queries. The best part is you can ask any question, such as sales in the United States, total product cost vs. sales, average orders, etc. It encourages normal users to analyze or explore the data without writing code. So, higher-level administration people can rely on themselves to see the general sales, profit, orders, and region sales reports.
In this section, we show you the uses of Q&A with a practical example. Before digging into the Power BI Q&A, let me show you the existing dashboards in my workspace.
Power BI Q&A
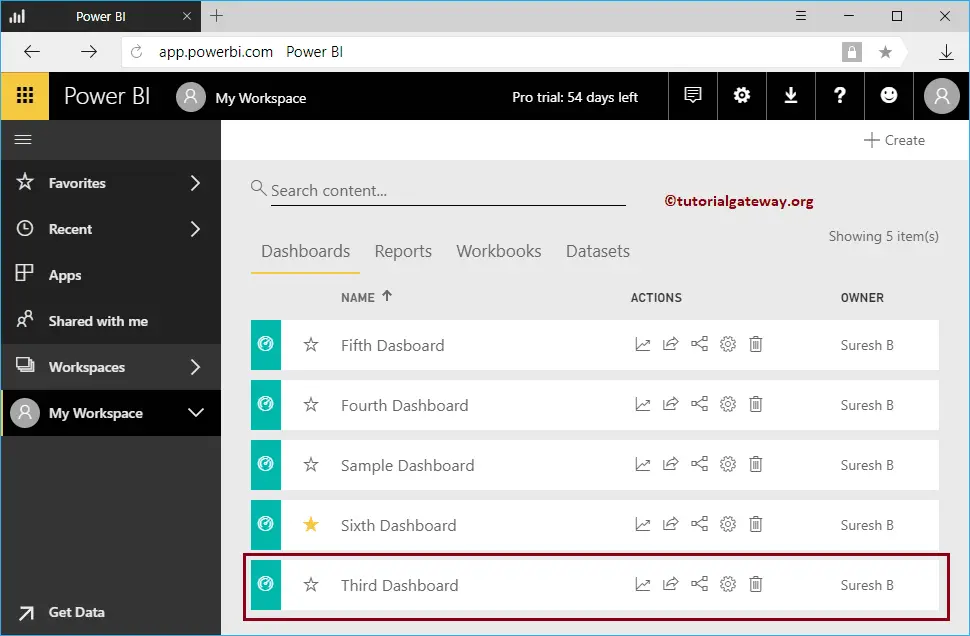
To view the Q&A, please click on the My Workspace and then go to the Dashboards tab. From the screenshot below, see that there are five dashboards.
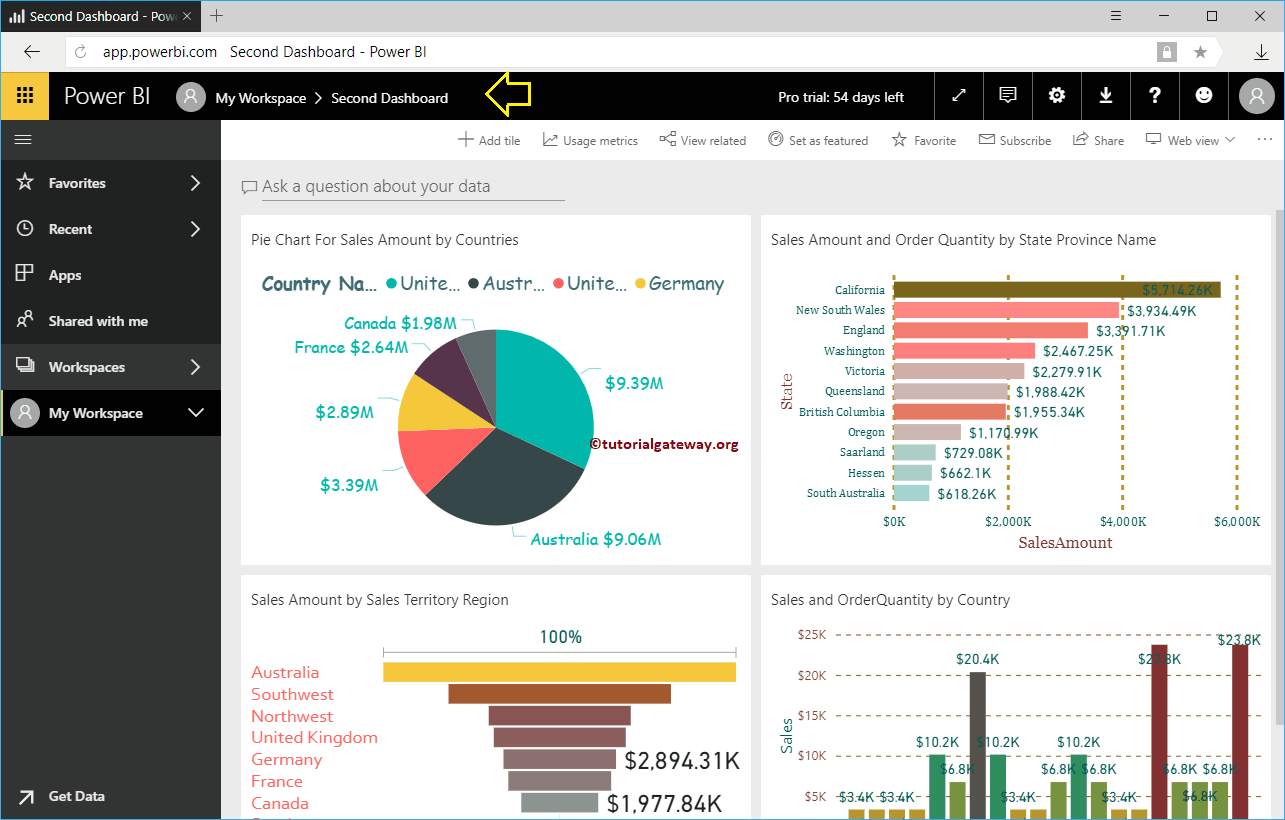
We use the third Dashboard to demonstrate Power BI Q&A in this example. Please click on it to see the reports on this dashboard.
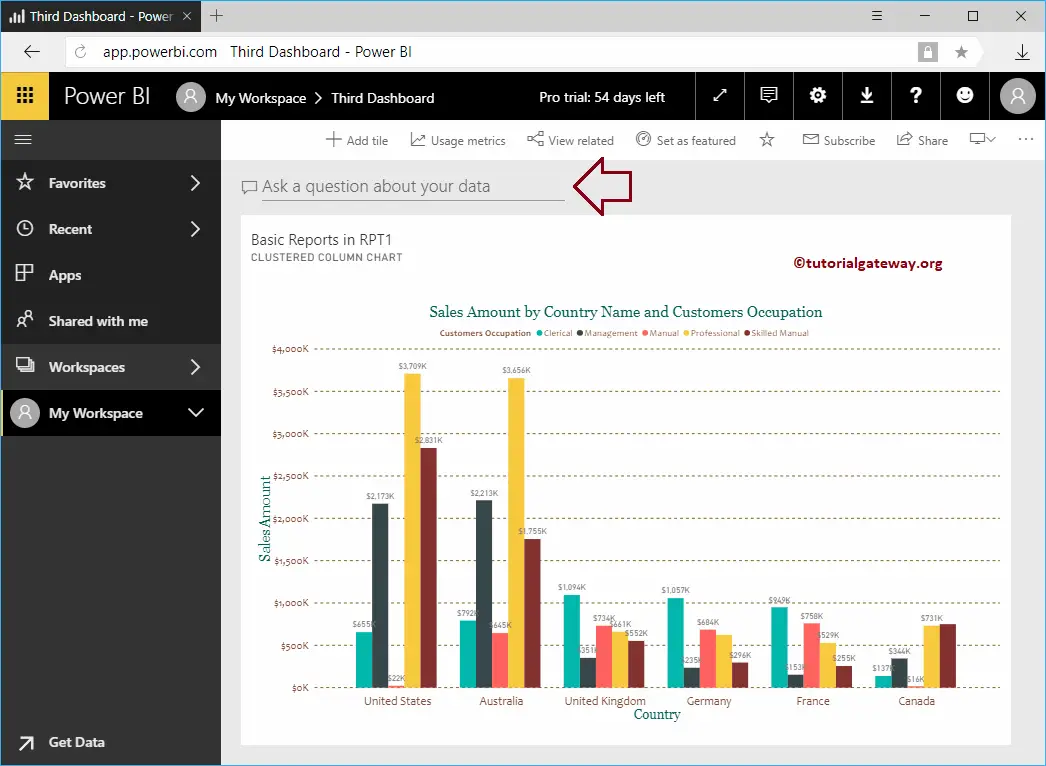
From the screenshot below, you can see the text Ask a question about your data. It is where we can write business-related questions in natural or standard language.
Power BI Q&A Chart Example
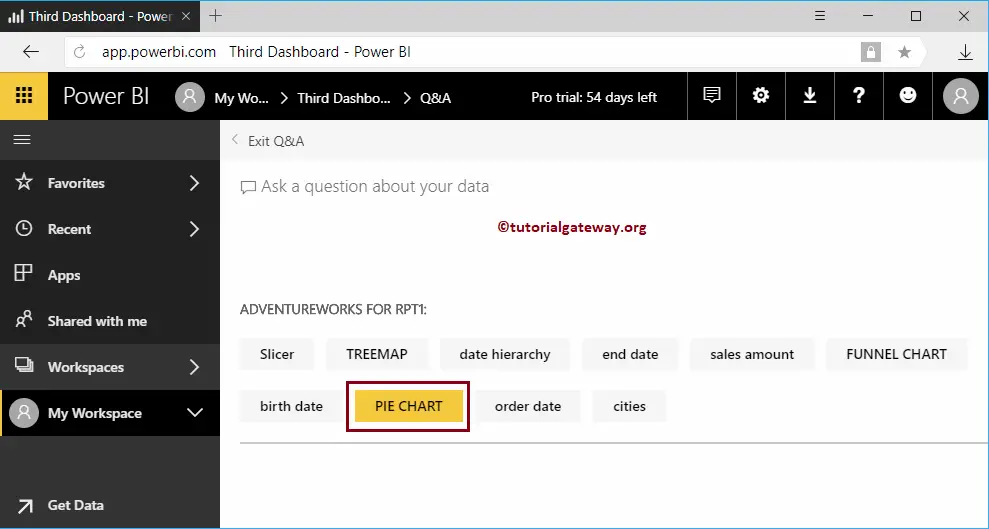
Once you click on that area, the following window is shown
- Exit: Use this button to exit from this window. It will redirect you to the previous dashboard.
- Ask a question about your data: You can ask any business or data-related question.
- Suggestions (Section under Adventure Works for RPT1): These suggestions are displayed based on the data, or you can Predefine them
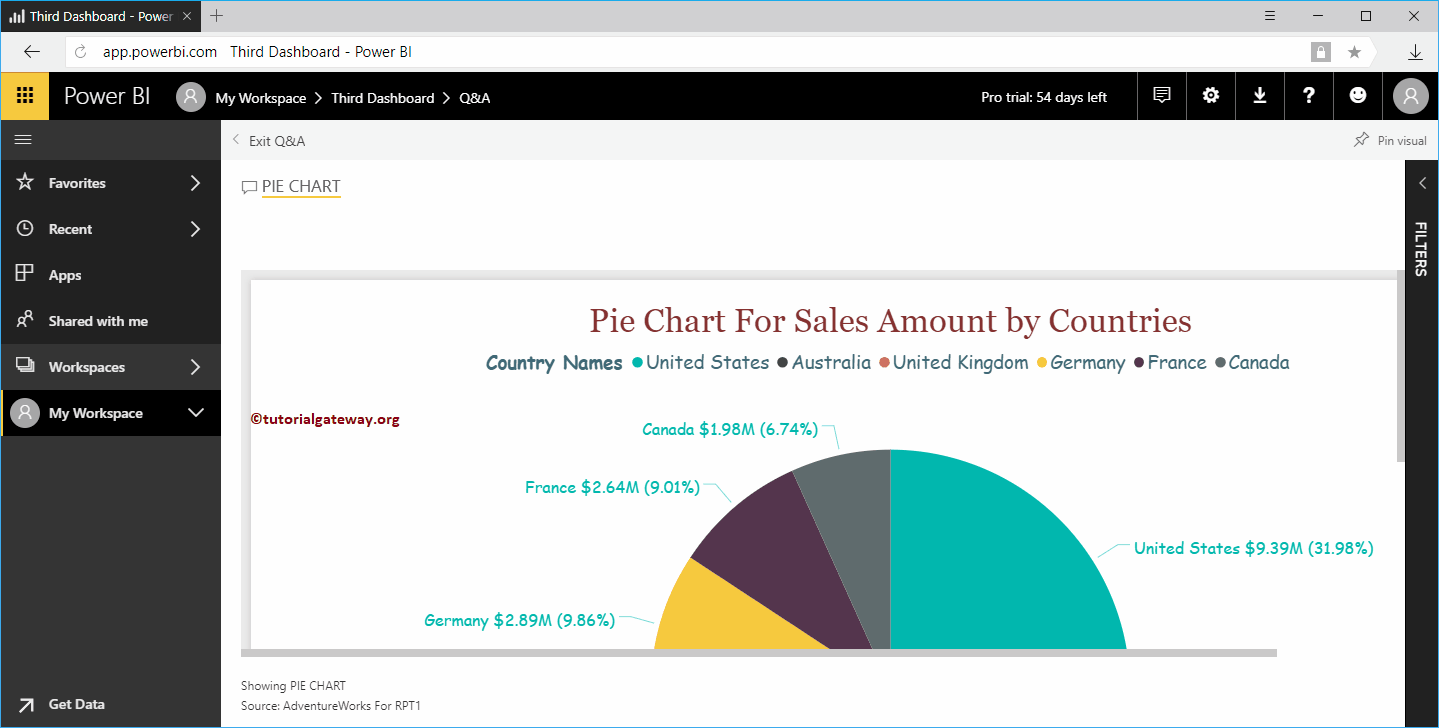
Remember, we designed many pages from this dataset. That’s why it is mostly showing those reports. In your case, it might be different. Power BI Q&A may show more words like cities, product sales, etc. Let me select the Pie Chart.
From the below screenshot, you can see the Pie Chart that was already present in my report.
Power BI Q&A Example 2
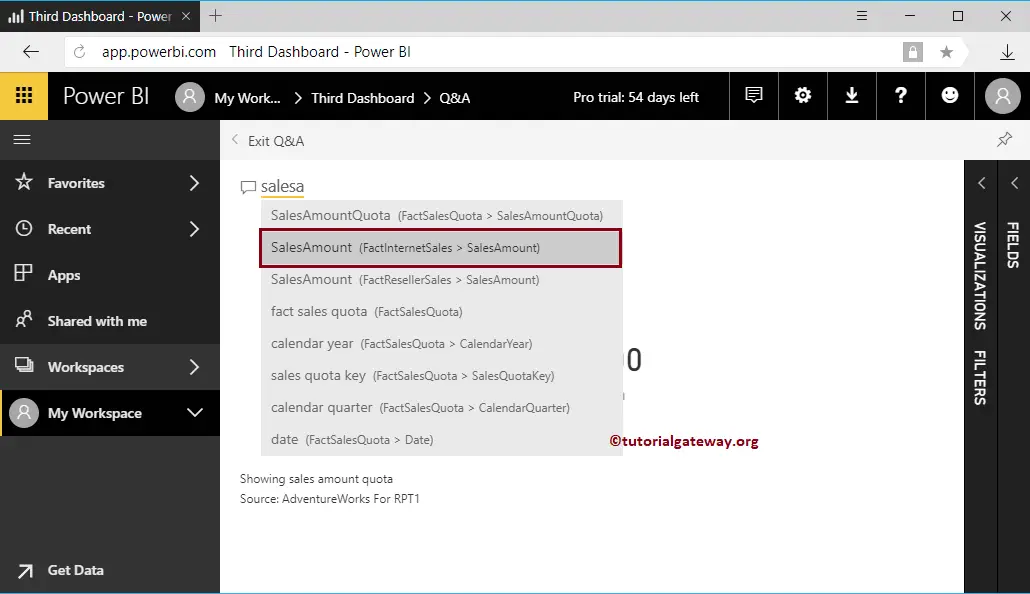
Other than the predefined scenarios, you can ask your own business questions. Remember, IntelliSense is fast enough to provide suggestions and also shows the visuals that are best suited for the question.
As you can observe, when I typed s, it displayed all the possibilities matching S and drew a table with the martial Status S. Let me select the Sales Amount from Fact Internet Sales.
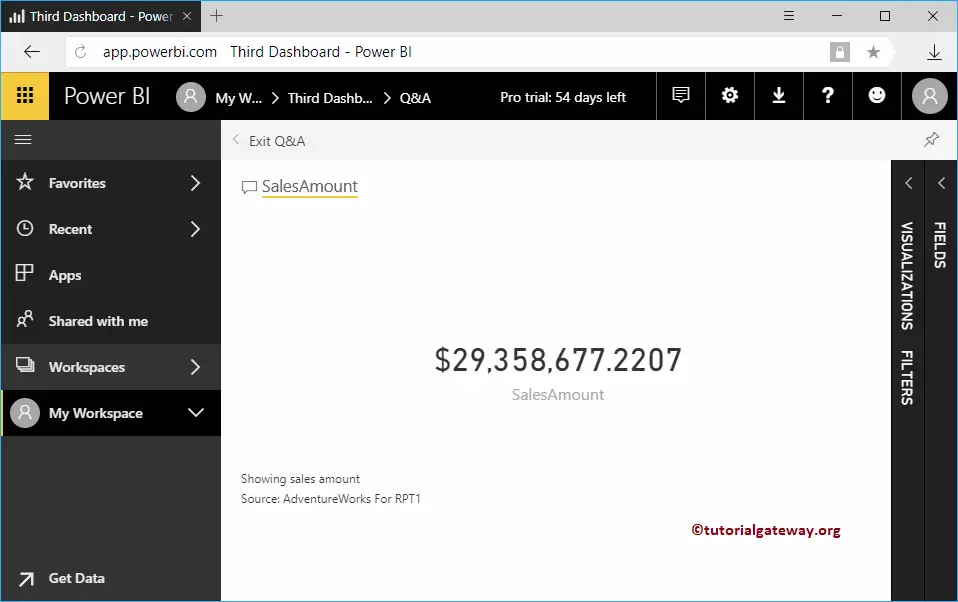
When I selected the Sales Amount, it displayed the Total Sales Amount Card.
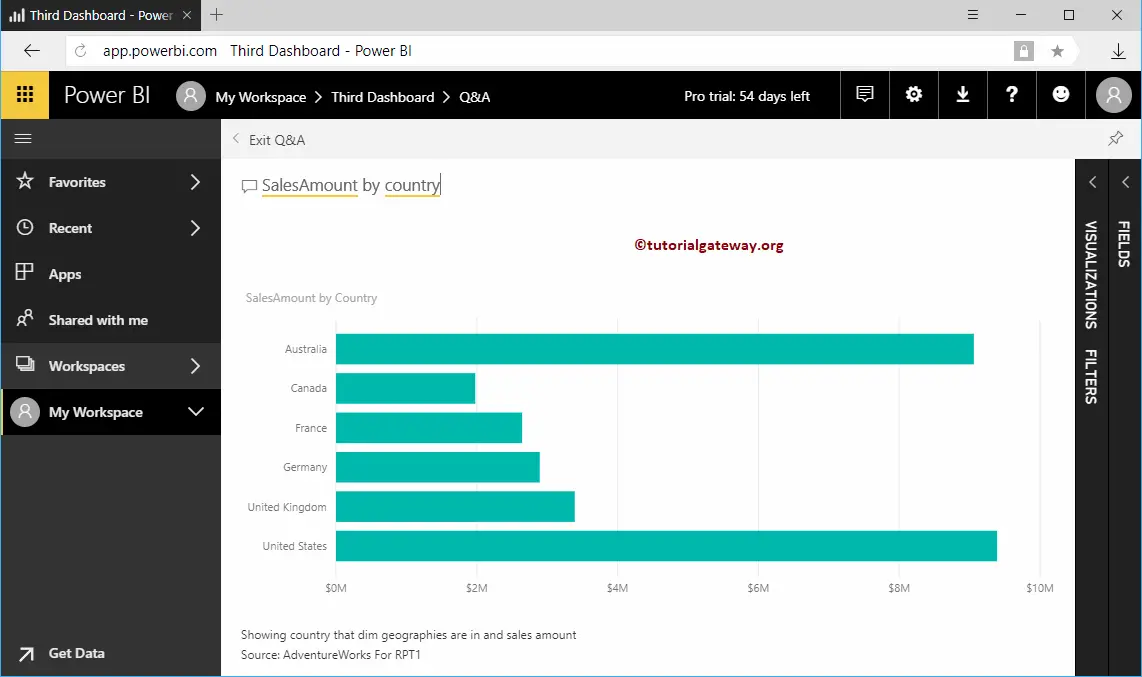
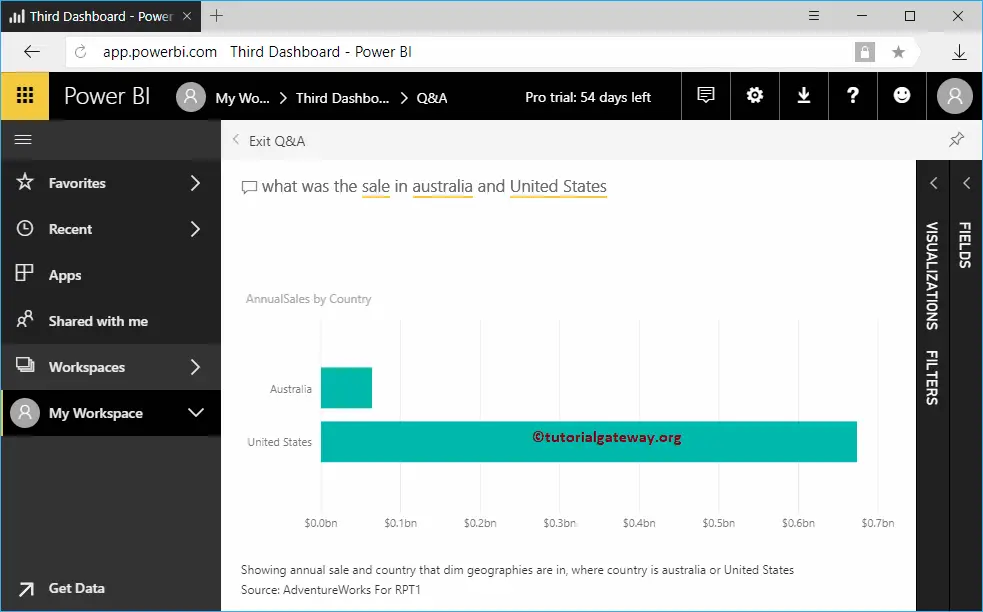
Let me ask for sales by country.
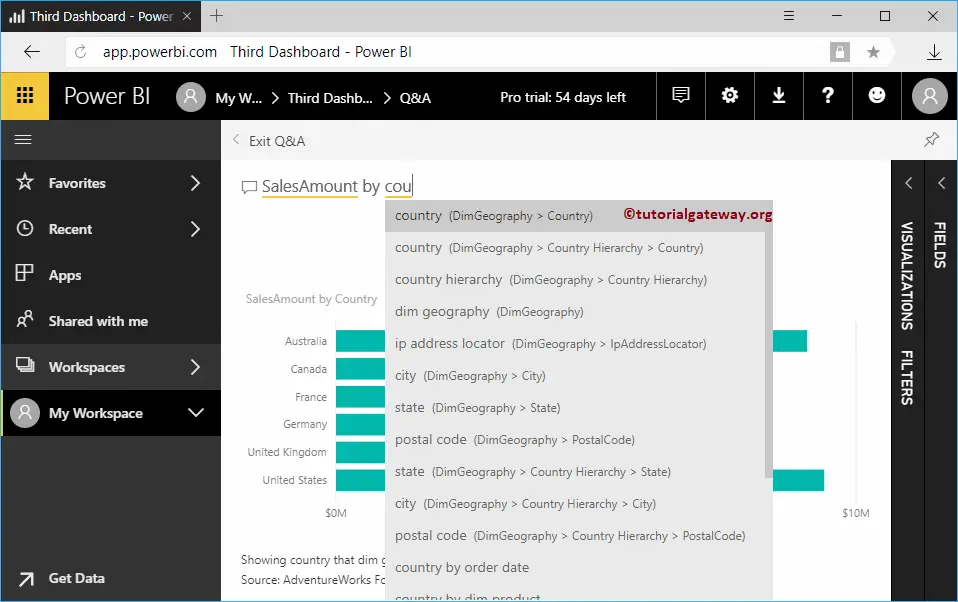
You can see the Bar Chart displaying the Sales by Country. Please use the Pin button on the top right corner to Pin this visual to the Dashboard. You can use the Visualization, Filters, and Fields tabs to customize this visual as required.
Natural Language Question Example
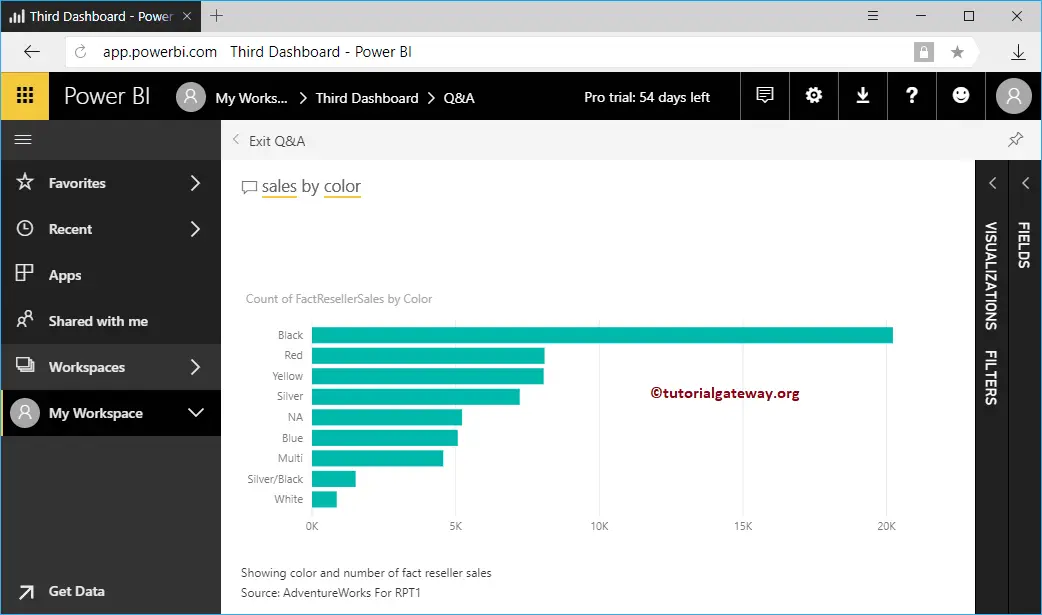
This time sales by color
Question and Answer Example 3
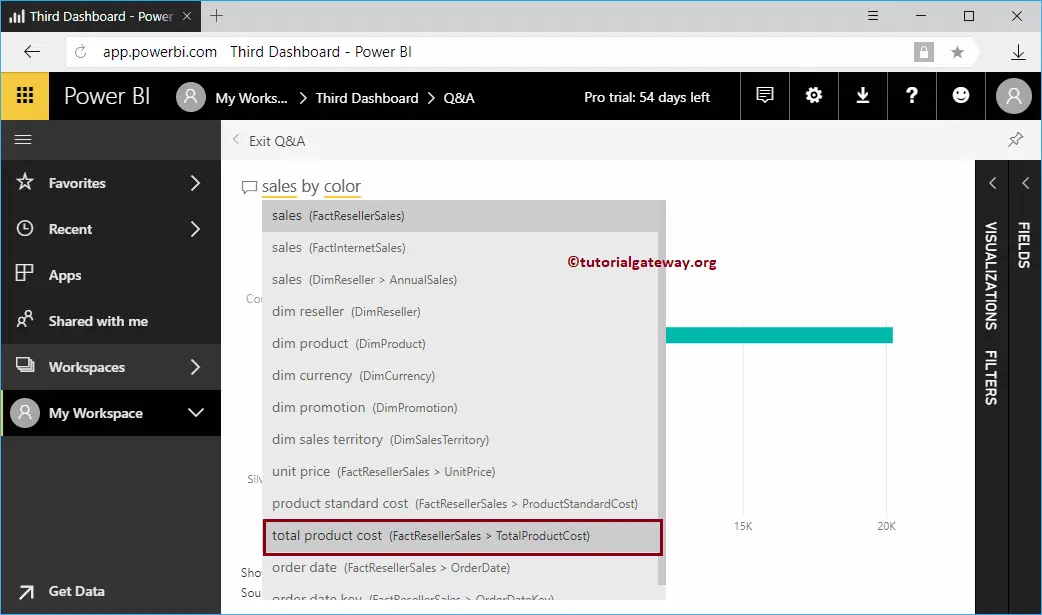
In Power BI Q&A, by clicking the term underlined with yellow color, you can replace it with another field. Let me select Sales and replace it with Total Product Cost.
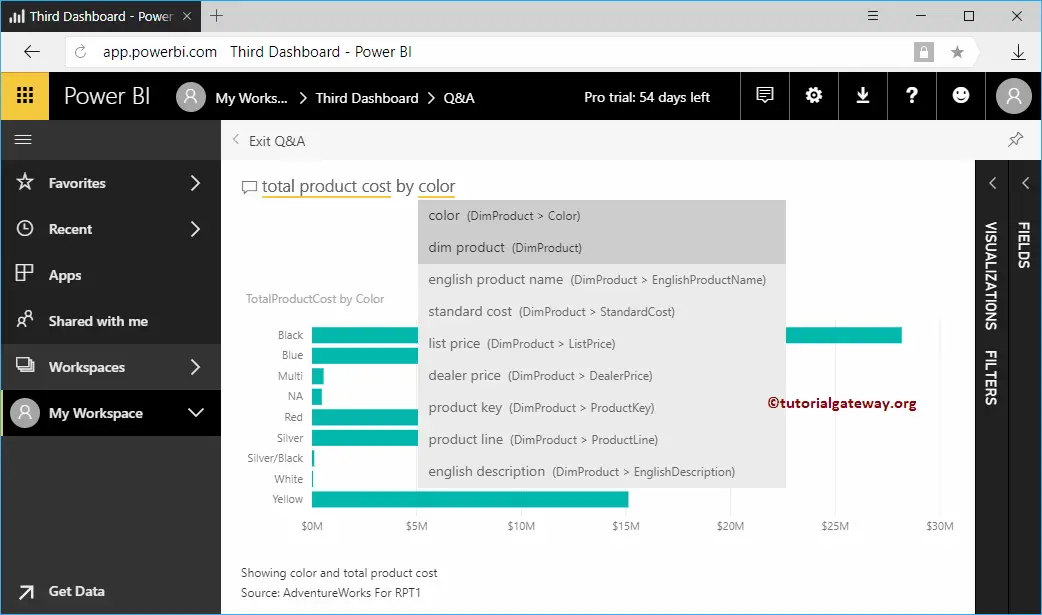
Now you can see the Bar chart displaying the Total product Cost by Color.

You can also try to replace the Color term.
Q&A Bar Graph Example
This time we use a regular question. I mean, a standard question, and it displays the result.
How to Customize Power BI Q&A Suggestions?
By default, Q&A suggests some questions about your data. However, you can customize them as per your requirements. I mean, you can place your own set of questions based on your requirements. Let me show you how to Customize Q&A Suggestions with a practical example.
We use the third Dashboard for this Customizing Q&A Suggestions demonstration. Within the Left Navigation pane, Go to the Third dashboard under the My Workspace and click the … button. Next, select the settings from the context menu.
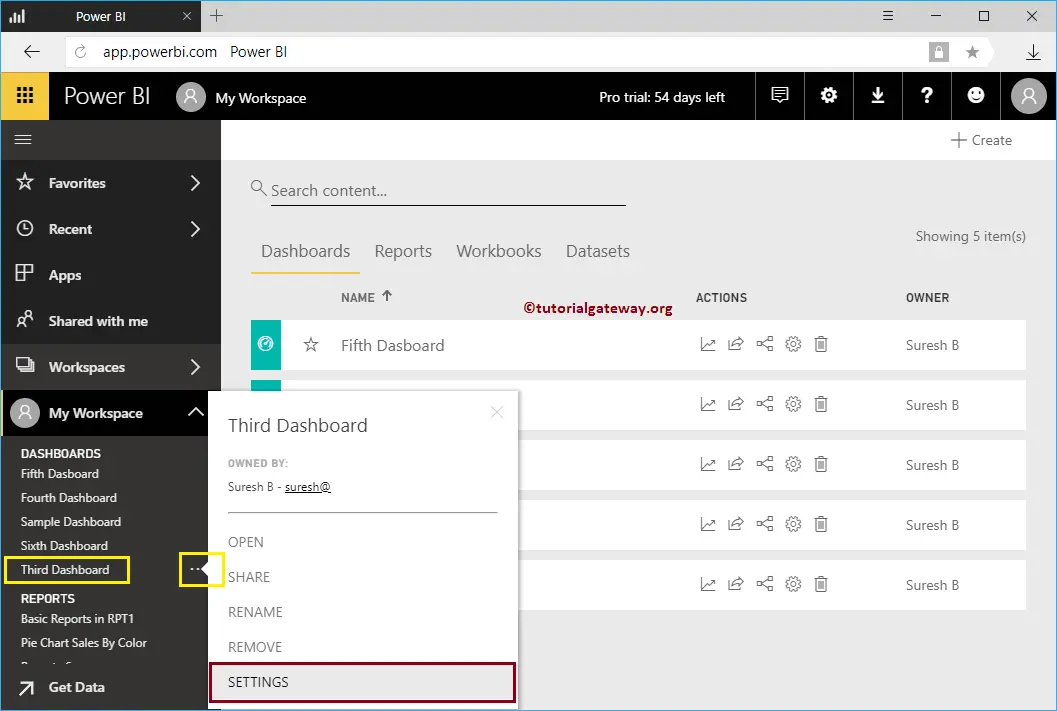
Selecting the settings option opens the following window.
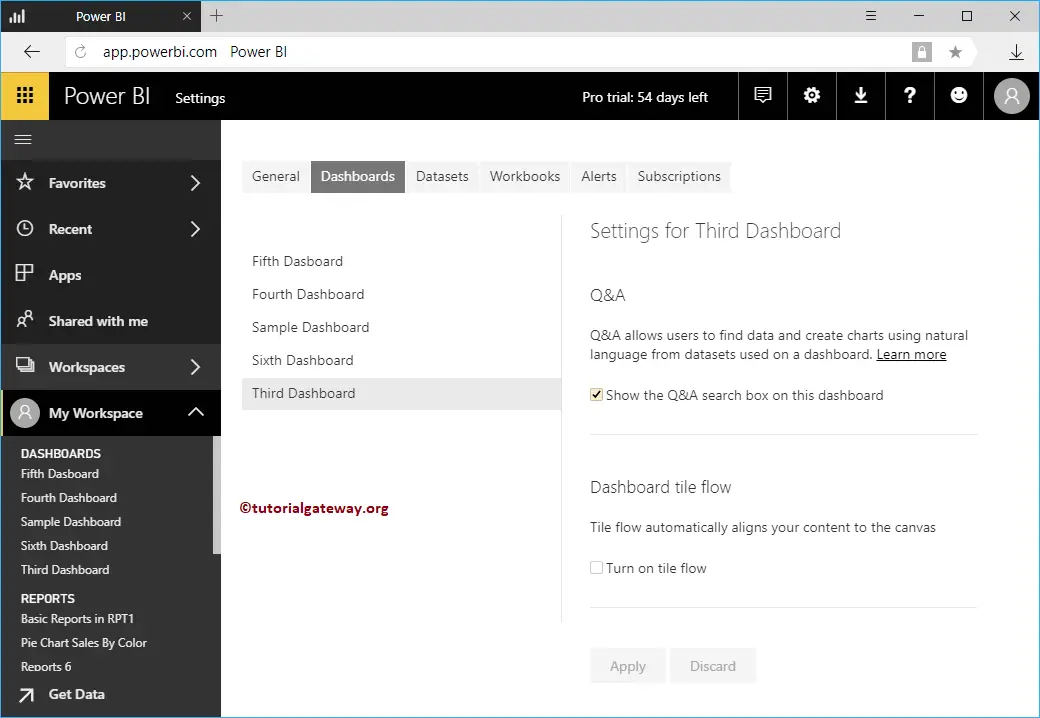
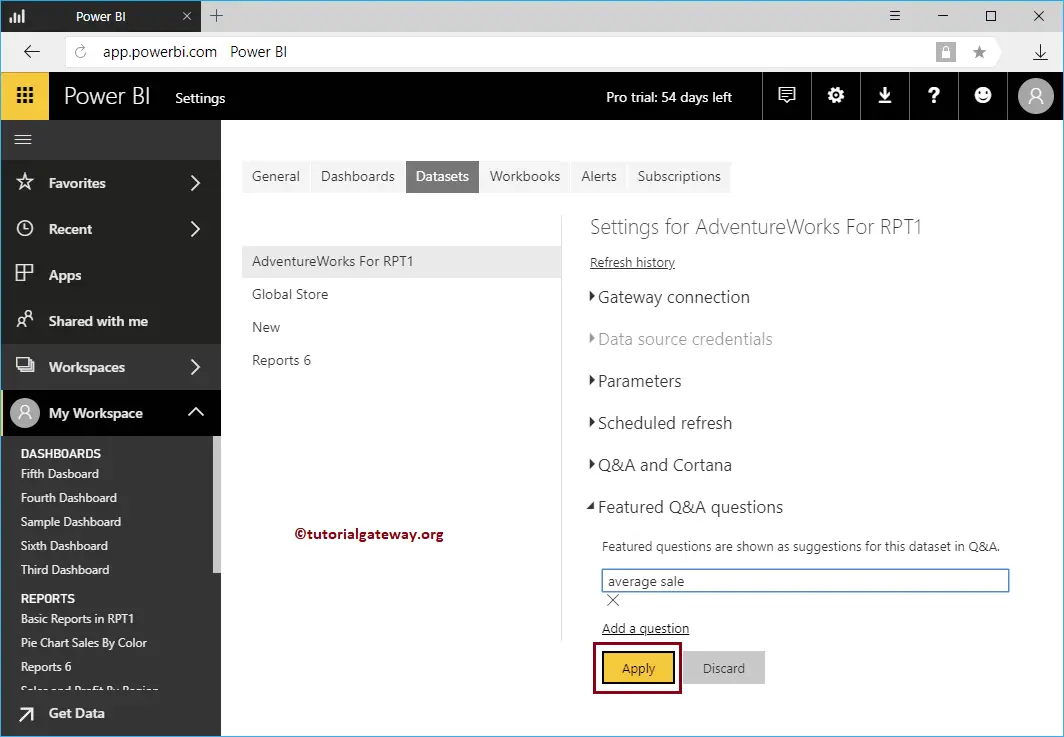
Go to the Datasets tab, and select the dataset that you want. Next, expand the Featured Q&A Questions section.
Add questions under this section is used to add your custom questions to this dataset.
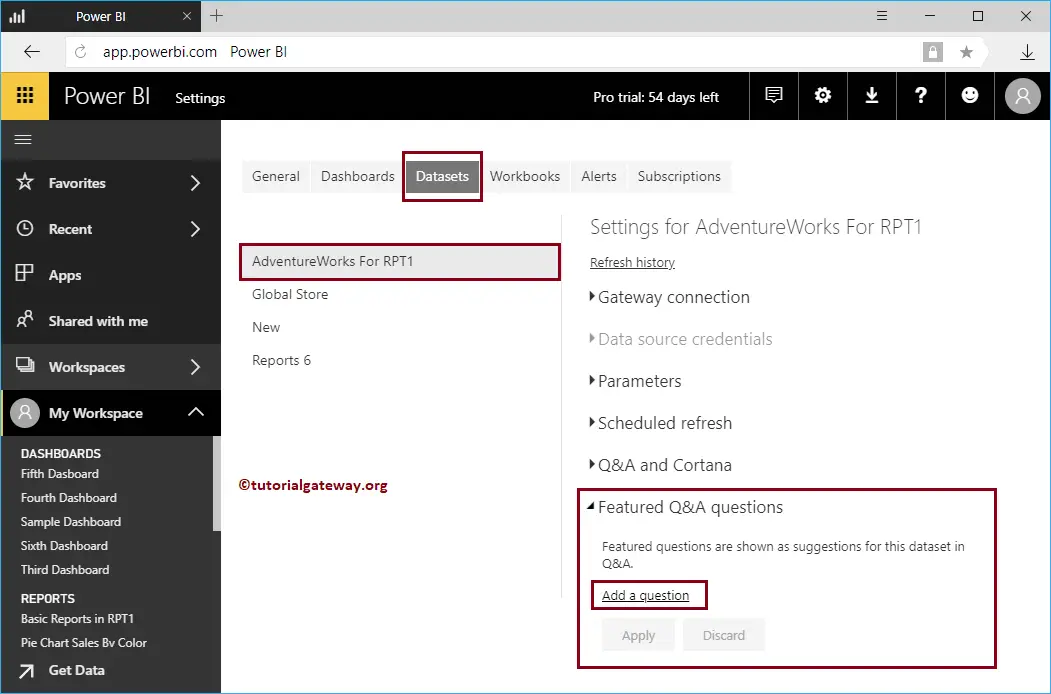
Once you click that Add a Question link provides a text box to write your own question. We added one question for the Customize Power BI Q&A Suggestions demo purpose. Once you are complete, click the Apply button.
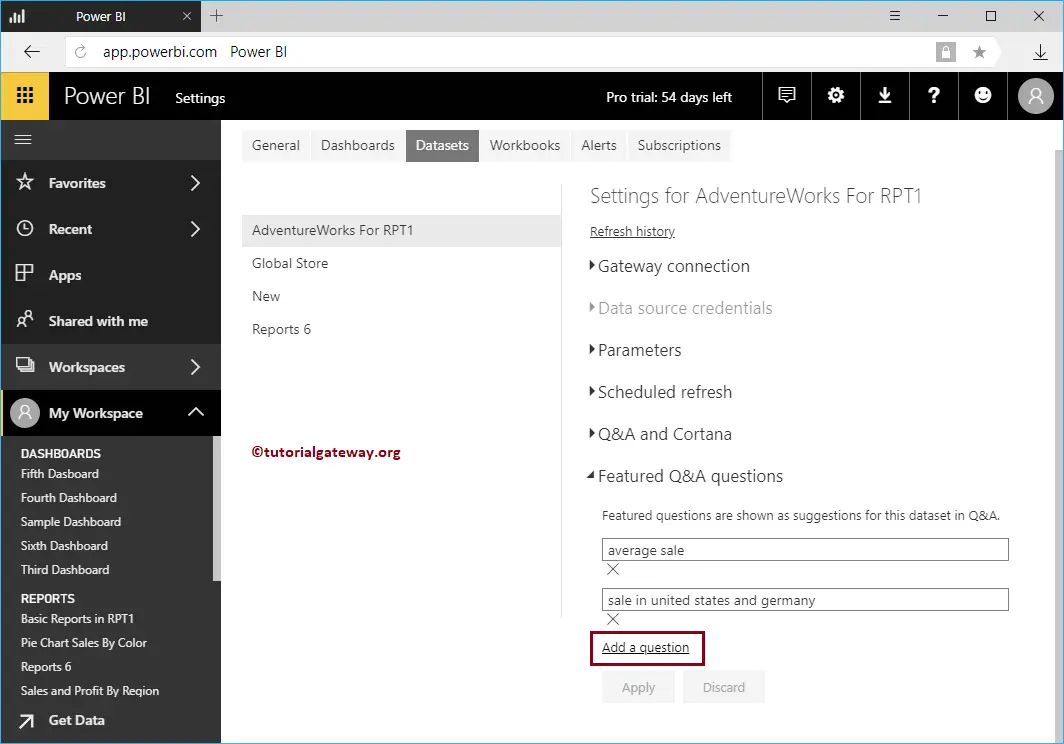
Let me add another question too.
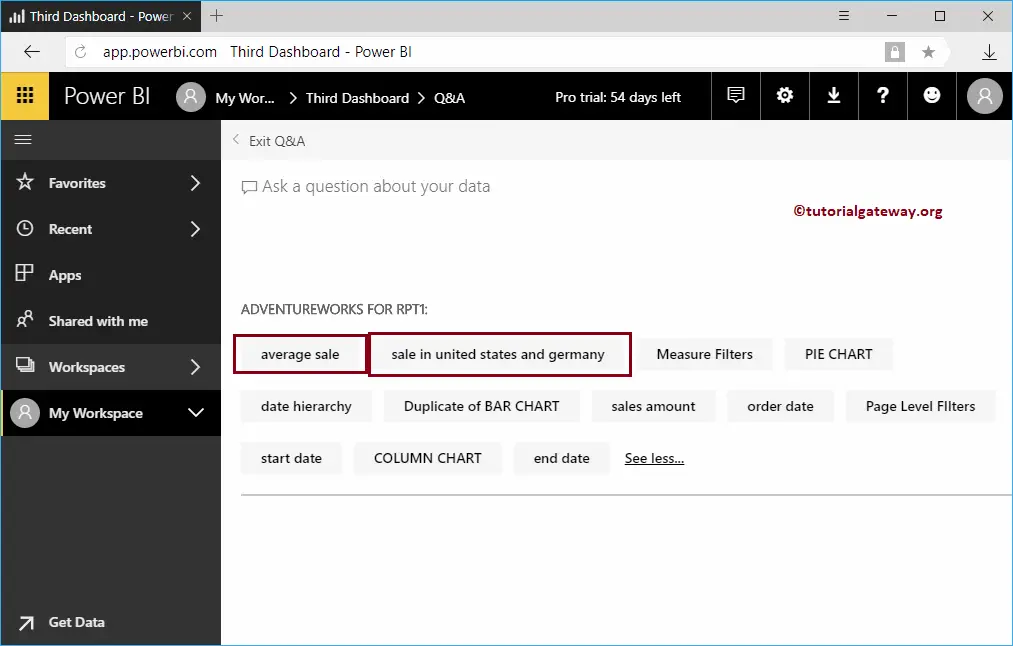
Now, when you open the Third dashboard, it shows the list of Q&A suggestions generated by the desktop. As you can see from the screenshot below, it displays the two questions we added earlier along with autosuggestions. Let me select the average sale.
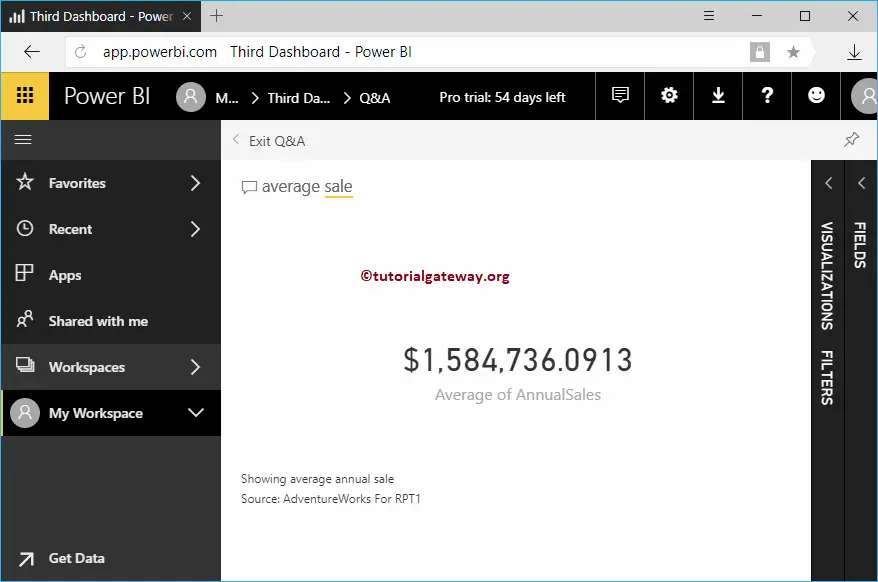
You can see it is displaying a Card with an Average annual sale
Power BI Q&A Advanced
You can use the complete report as the Q&A suggestion. You can display a complete report with filters under the Q&A suggestions list. Let me show you how to use these Q&A Advanced options with a practical example and for this demonstration, we are using the Second Dashboard.
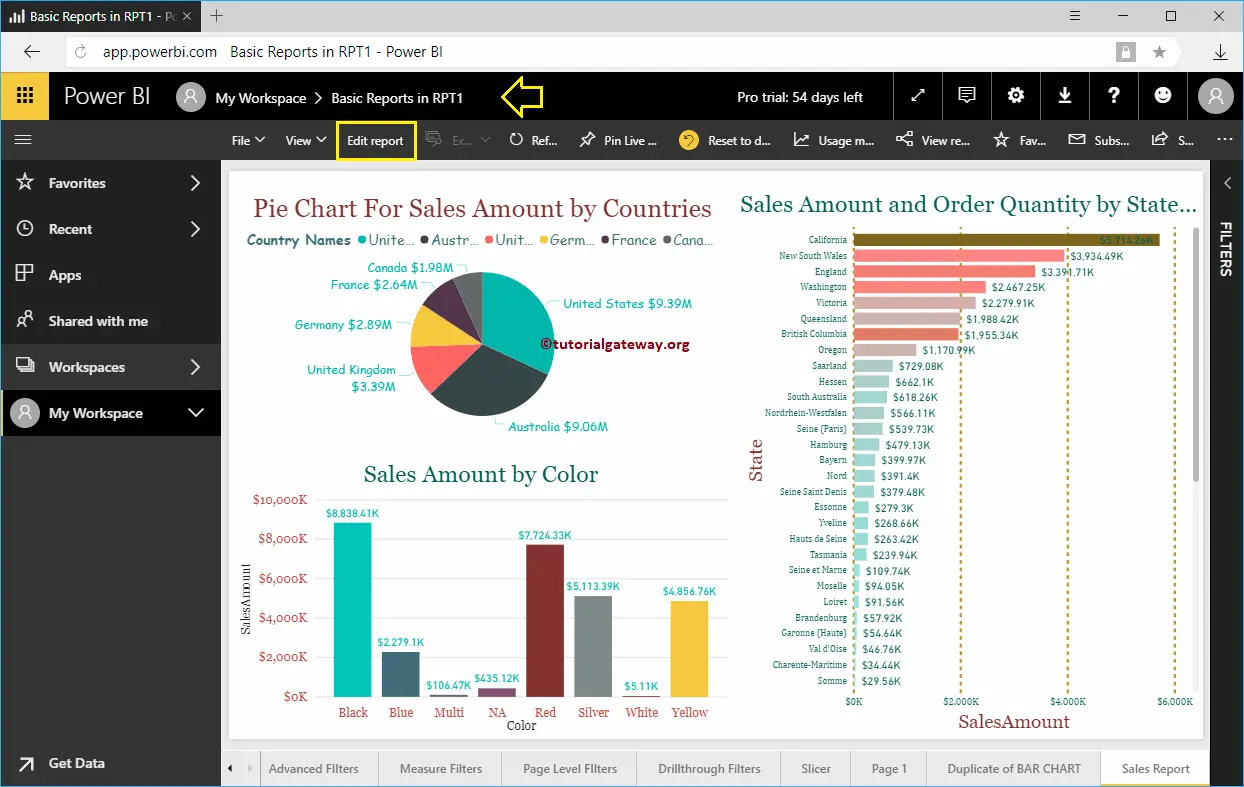
In this example, we use the Sales Report in Basic Reports in RPT1. I suggest you refer to Page Level Filters to understand this report and Publish a report from Desktop to understand the Dataset.
Please go to My Workspace -> Reports tab and click on the Basic Reports in RPT1. Clicking this opens the following window. Let me click the Edit Report button.
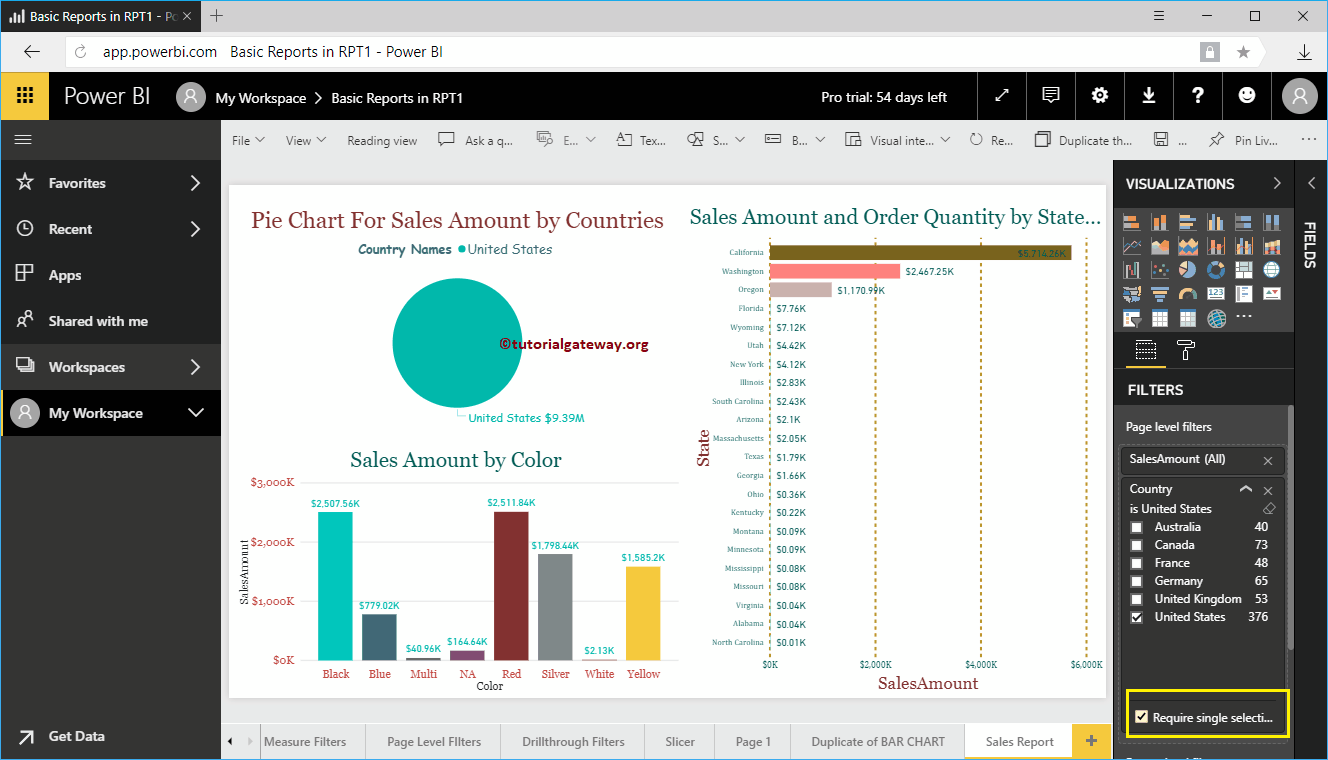
We added Country to the Page Level Filter. Next, we selected Require Single Selection and then selected the United States as the Default value.
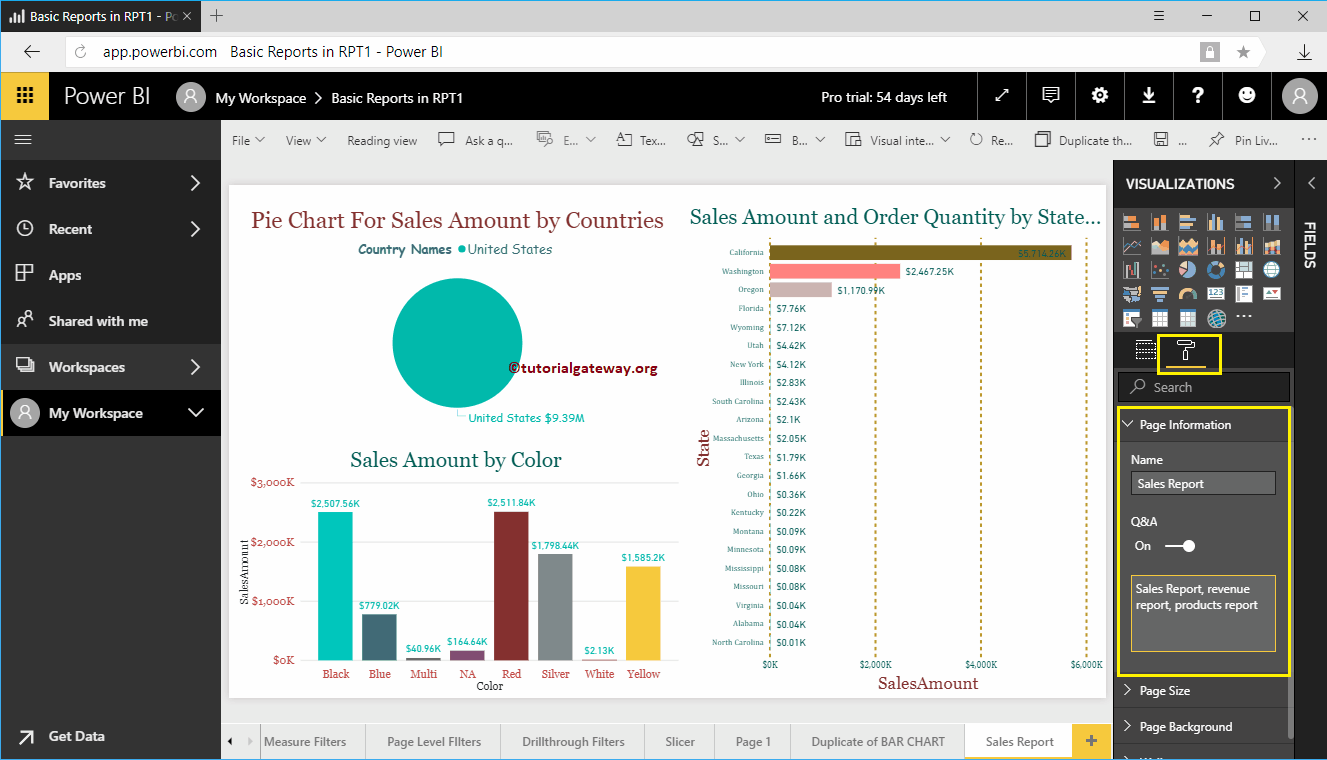
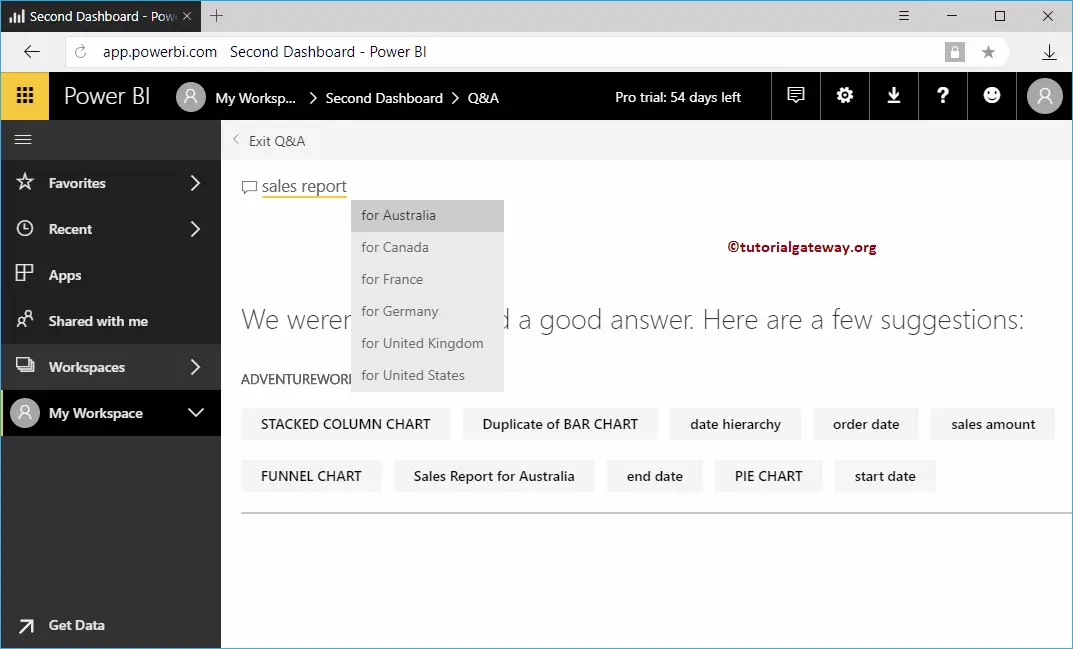
Next, go to the Page Settings tab, and add your questions to the page information. As you can see, we added three terms. It means when I type Sales report, revenue report, or products report (any of these three terms), it will call this report.
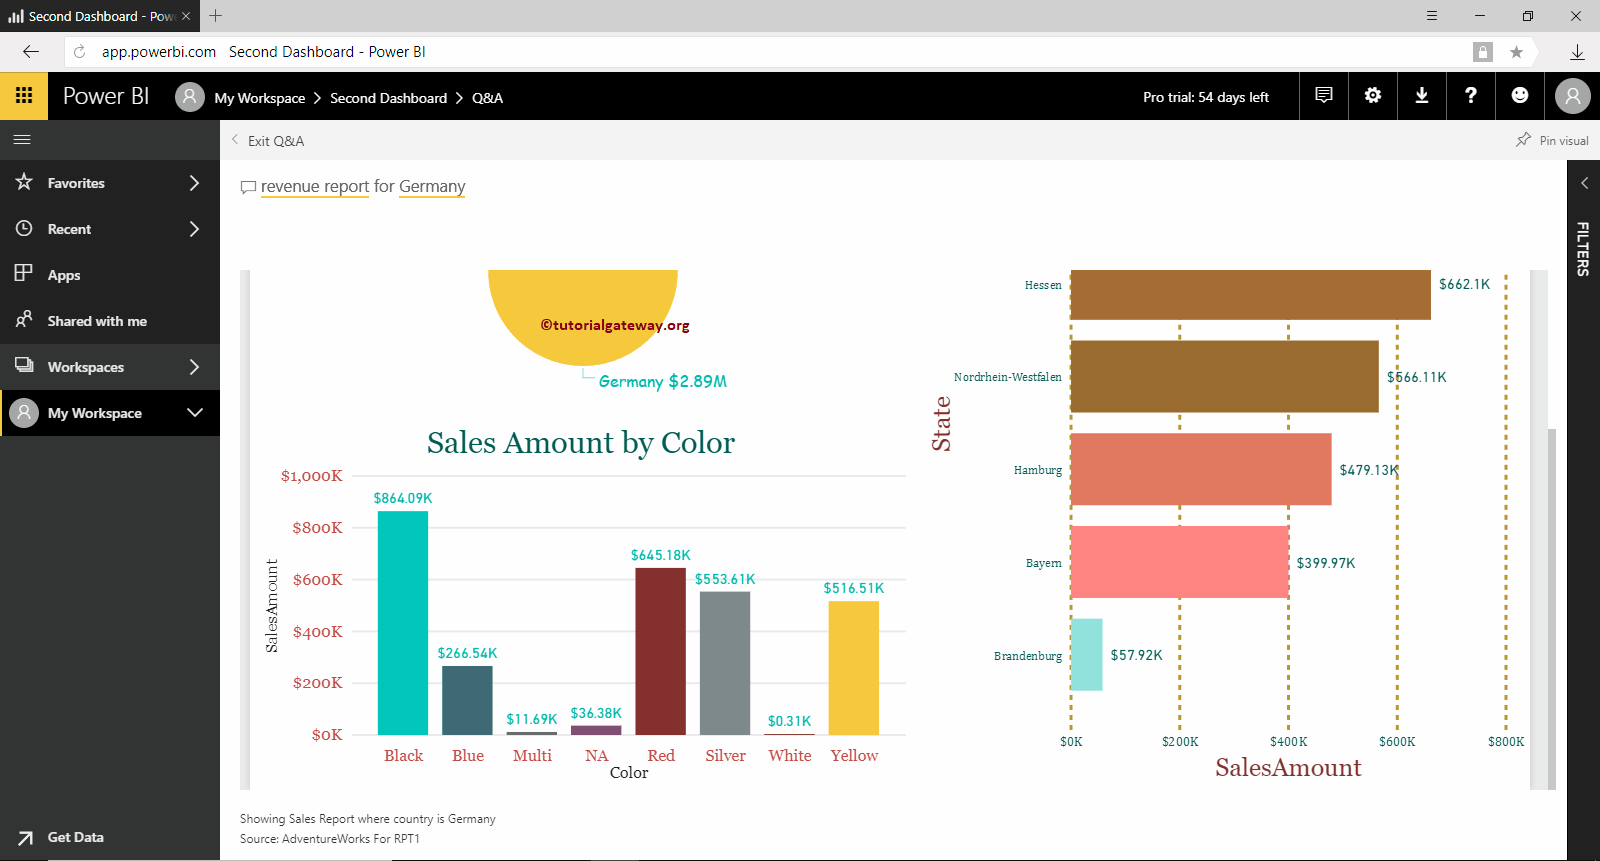
Let me go to the Second dashboard Q&A window. When I type the sales report, it asks for the country name. Let me select Australia.
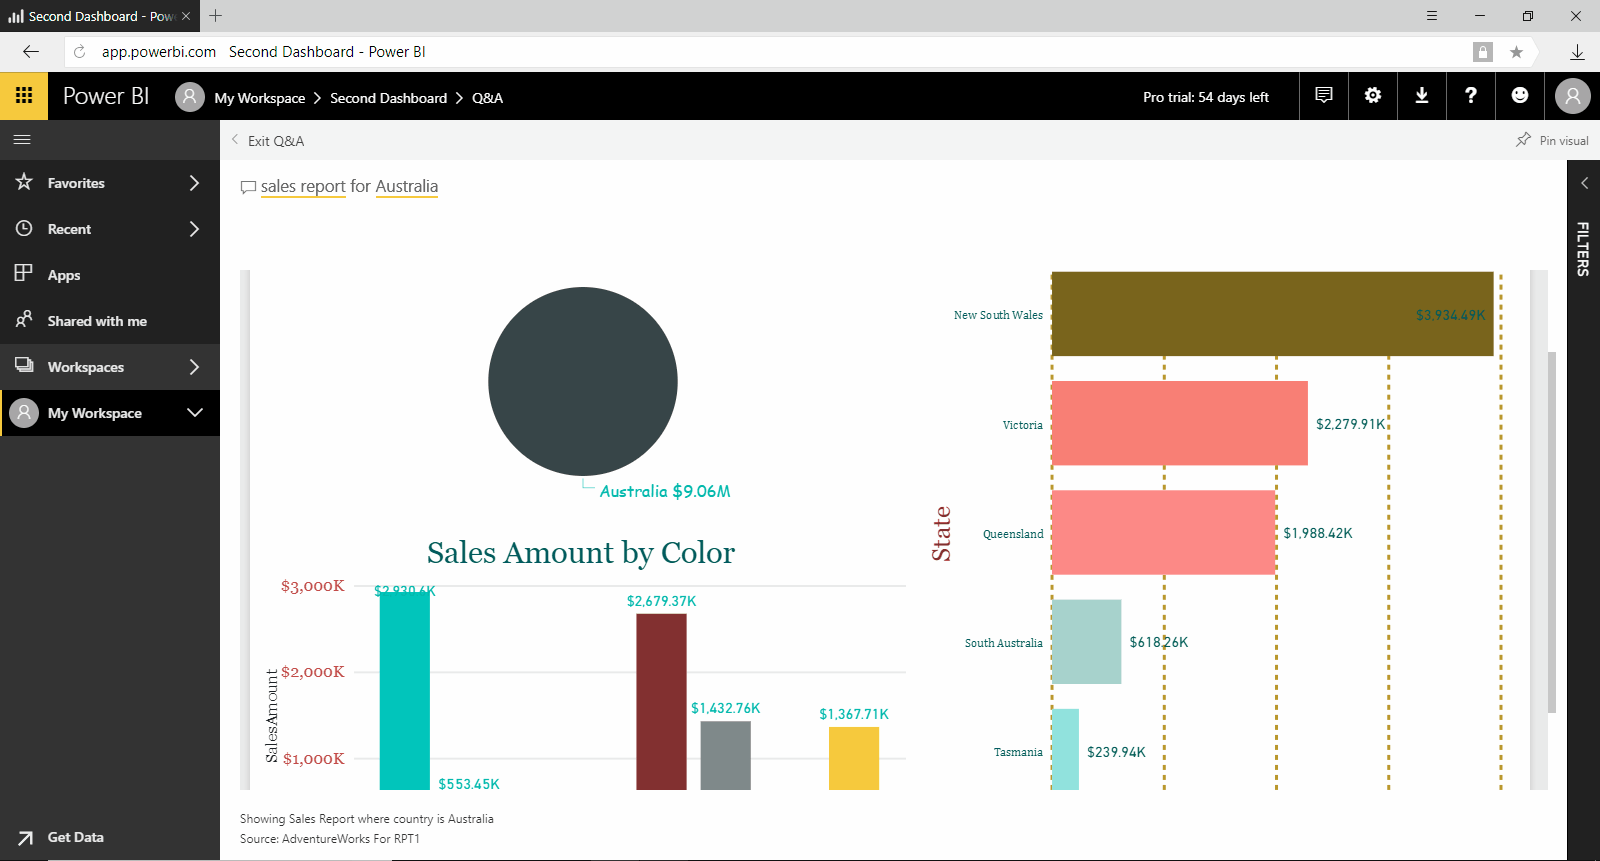
You can see that it displays the complete report filtered by Australia.
Let me try Germany.