Tutorial Gateway

  • C
  • C#
  • Java
  • Python
  • SQL
  • MySQL
  • Js
  • BI Tools
    • Informatica
    • Talend
    • Tableau
    • Power BI
    • SSIS
    • SSRS
    • SSAS
    • MDX
    • R Tutorial
    • Alteryx
    • QlikView
  • More
    • C Programs
    • C++ Programs
    • Python Programs
    • Java Programs

Power BI Page Level Filters

by suresh

How to create Page Level Filters in Power BI with an example?. The Power BI Page level Filters are useful to filter the charts (or visuals) present on the page. For example, if your page contains four charts, then you can use this page level filter to filters those four reports at a time.

How to create Power BI Page Level Filters

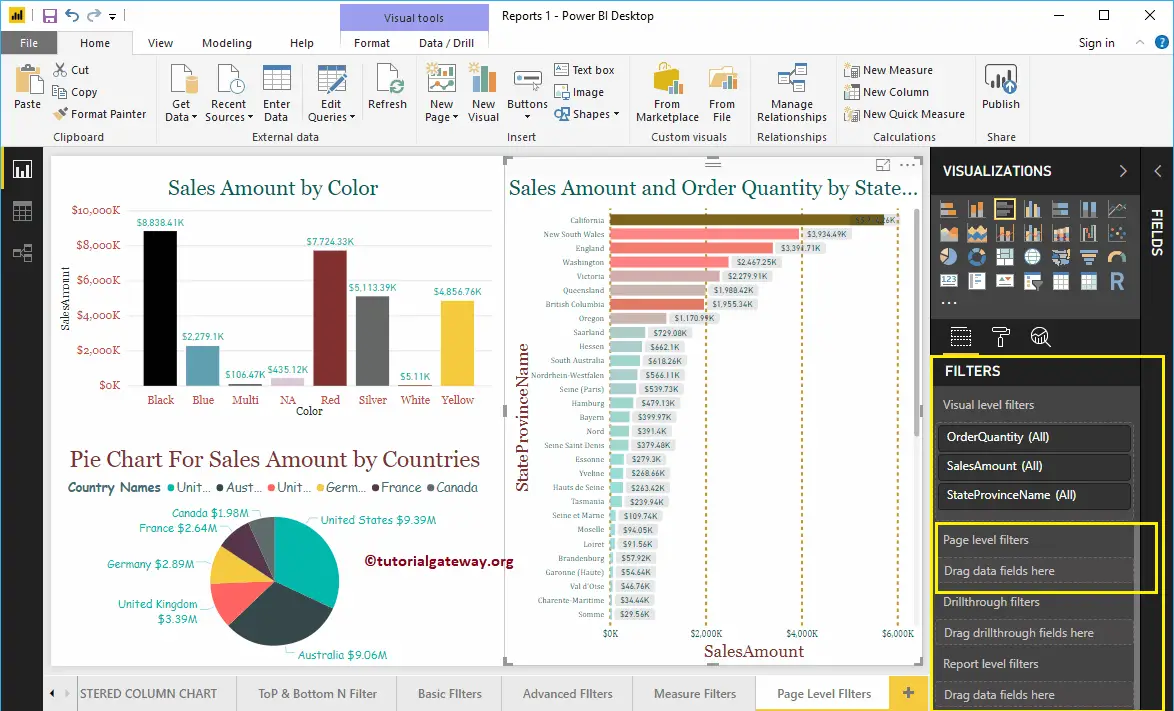
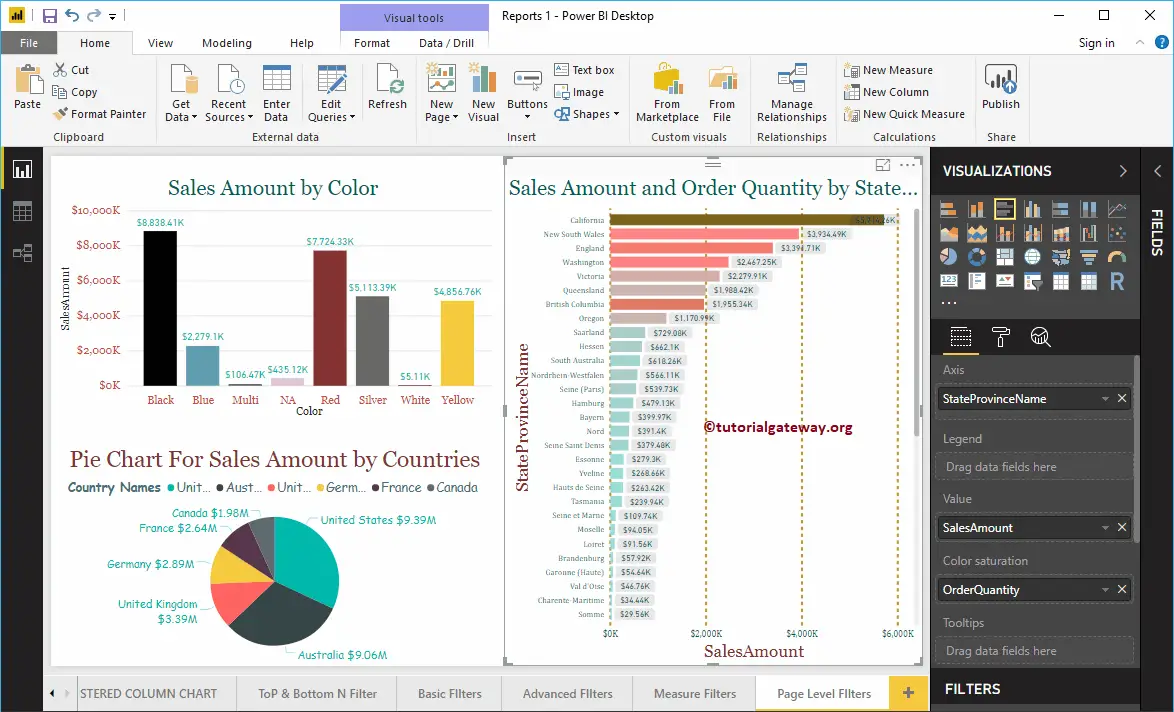
To demonstrate the Page Level Filters in Power BI, we are going to use the Column Chart, Pie Chart, and Bar Charts that we created in our earlier Power BI post.
Power BI Page Level Filters 1

Under the Filters section, you can see the list of available page level filters in Power BI. You have to use the Page Level Filters section to create a filter at the page level.

Power BI Page Level Filters 2

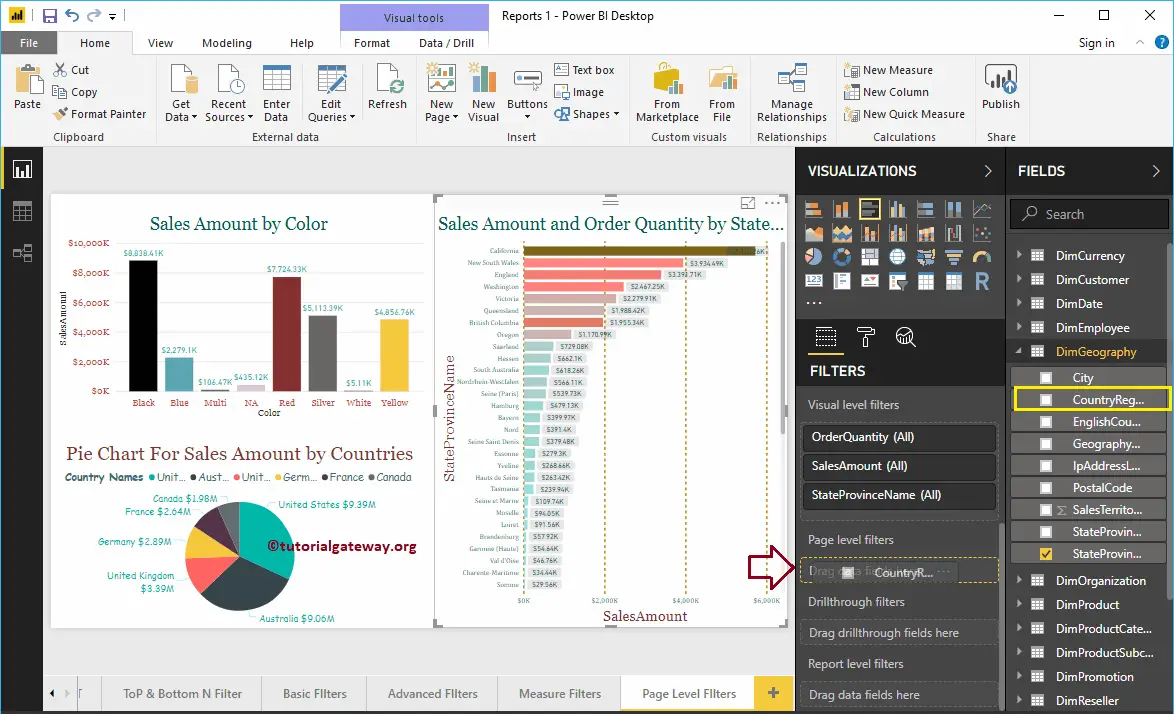
Let me drag and drop the English Country Region Name from the fields section to the Page level Filters.
Power BI Page Level Filters 3

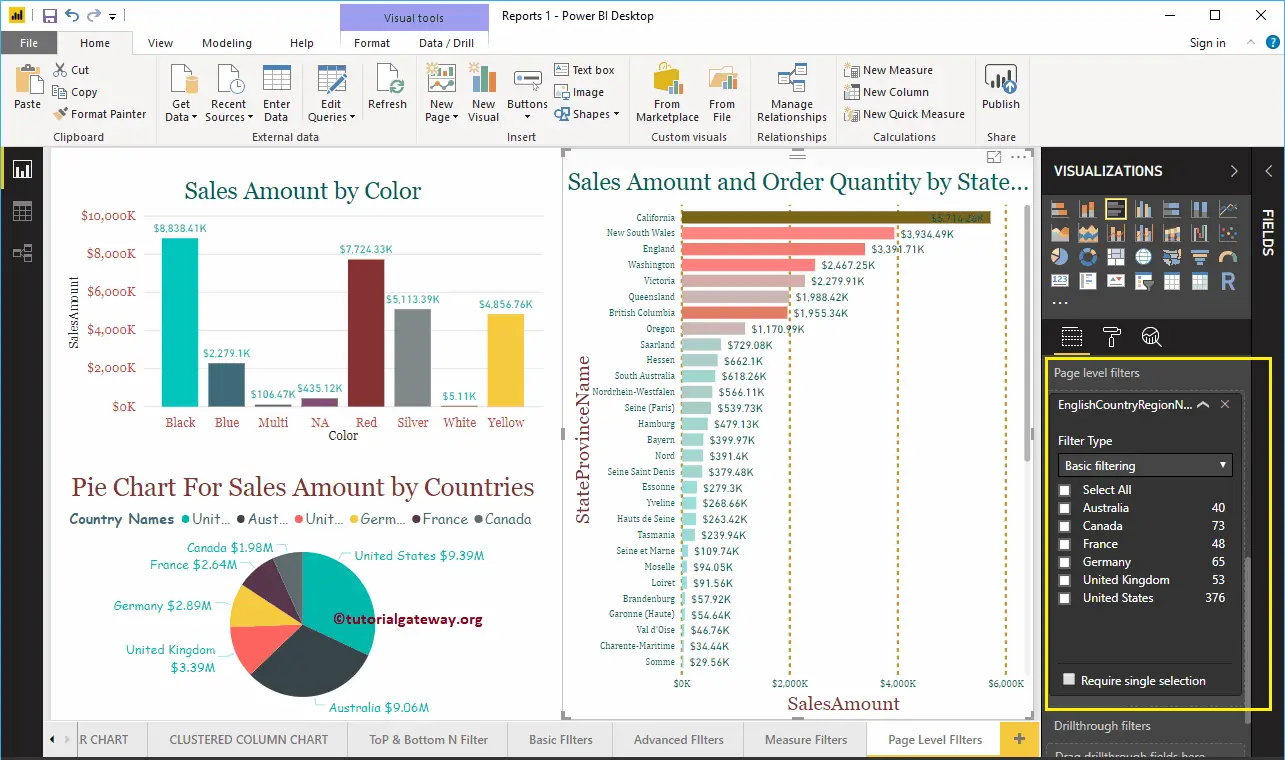
Expand the English Country Region Name to see the filter types. By default, the Basic Filters option selected as the Filter type.
Power BI Page Level Filters 4

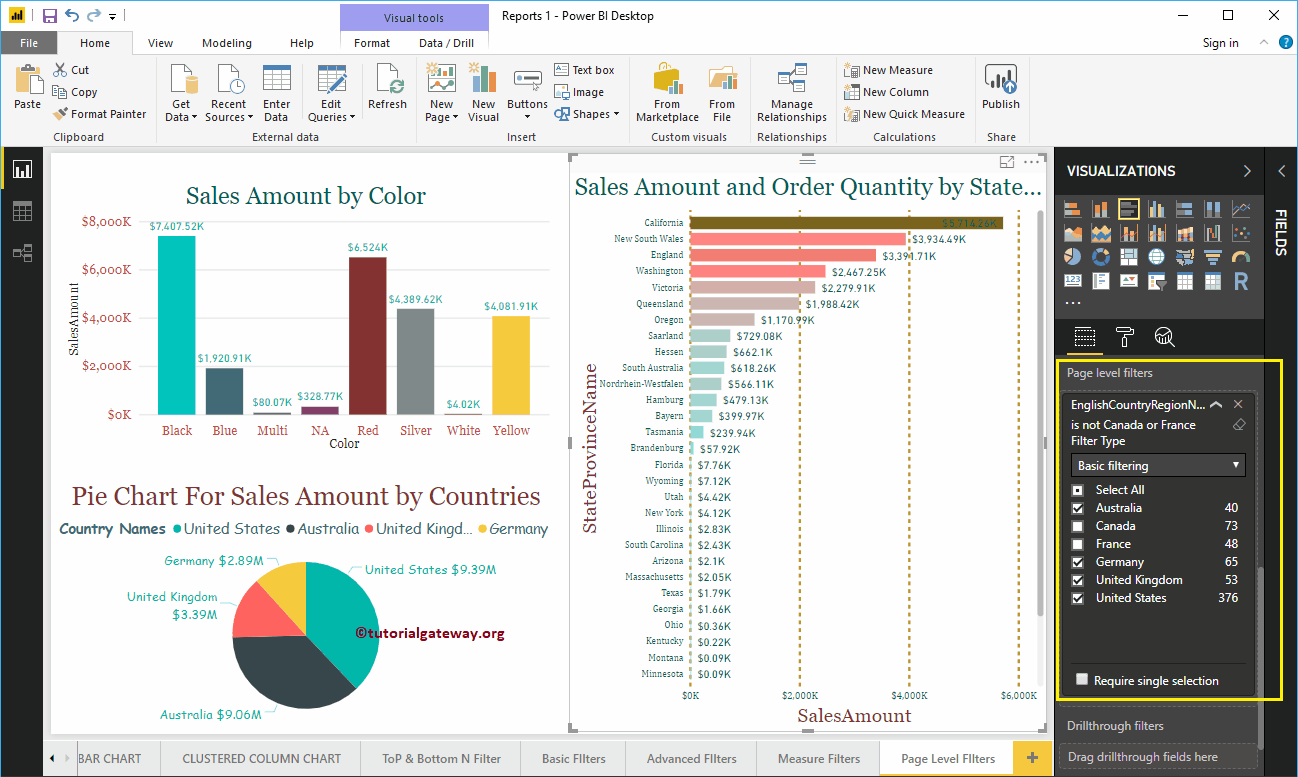
For the demo purpose, let me select Australia, Germany, the United Kingdom, and the United States. From the screenshot below, you can see that the Column chart is displaying Sales for the selected countries. The pie chart is displaying the selected countries. And, Bar chart is displaying the States that belong to these countries.
Power BI Page Level Filters 5

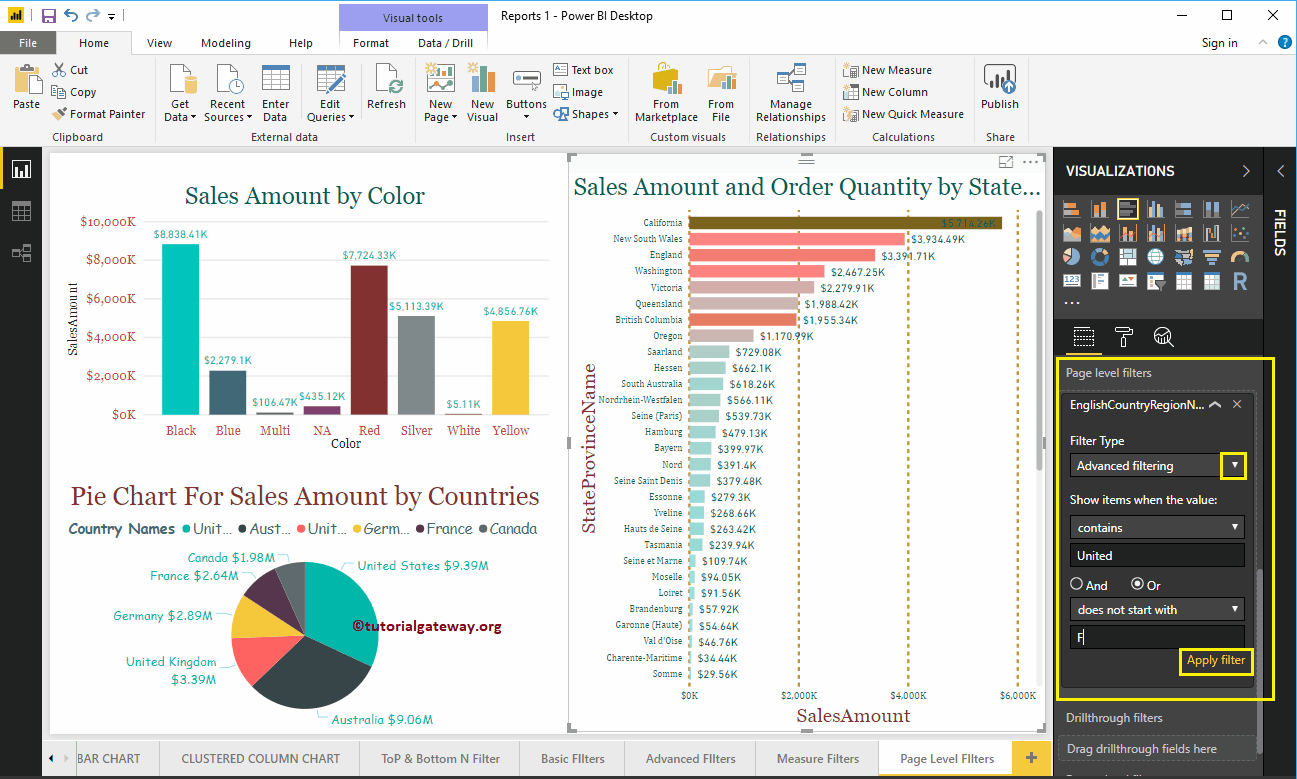
Use the drop-down to change the filtering type to Advanced filtering.

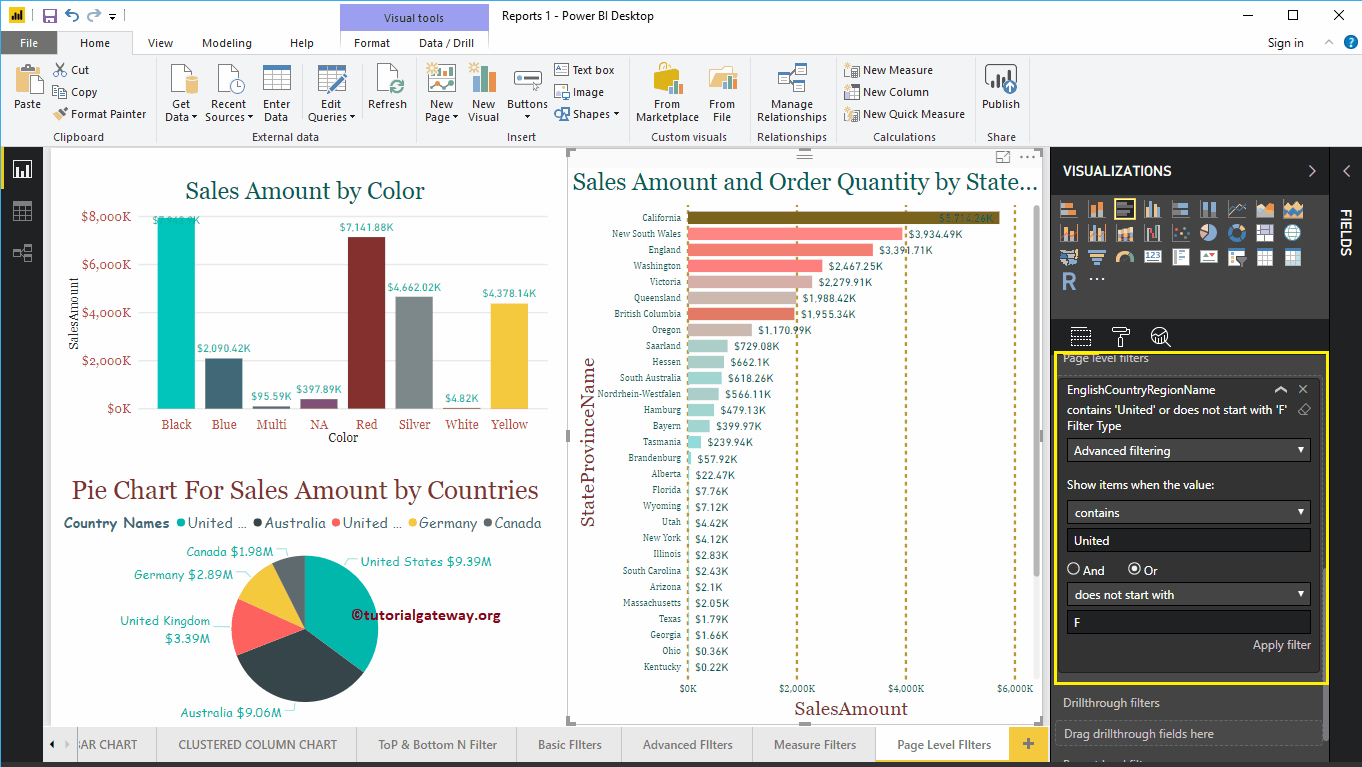
Here, we are applying multiple filters on the Country column. The first filter checks whether the Country contains a united keyword or not. Or, the Second condition checks the countries that do not start with F.
Power BI Page Level Filters 6

The below page is showing the Countries that contain the United keyword, and the countries do not start with F.
Power BI Page Level Filters 7

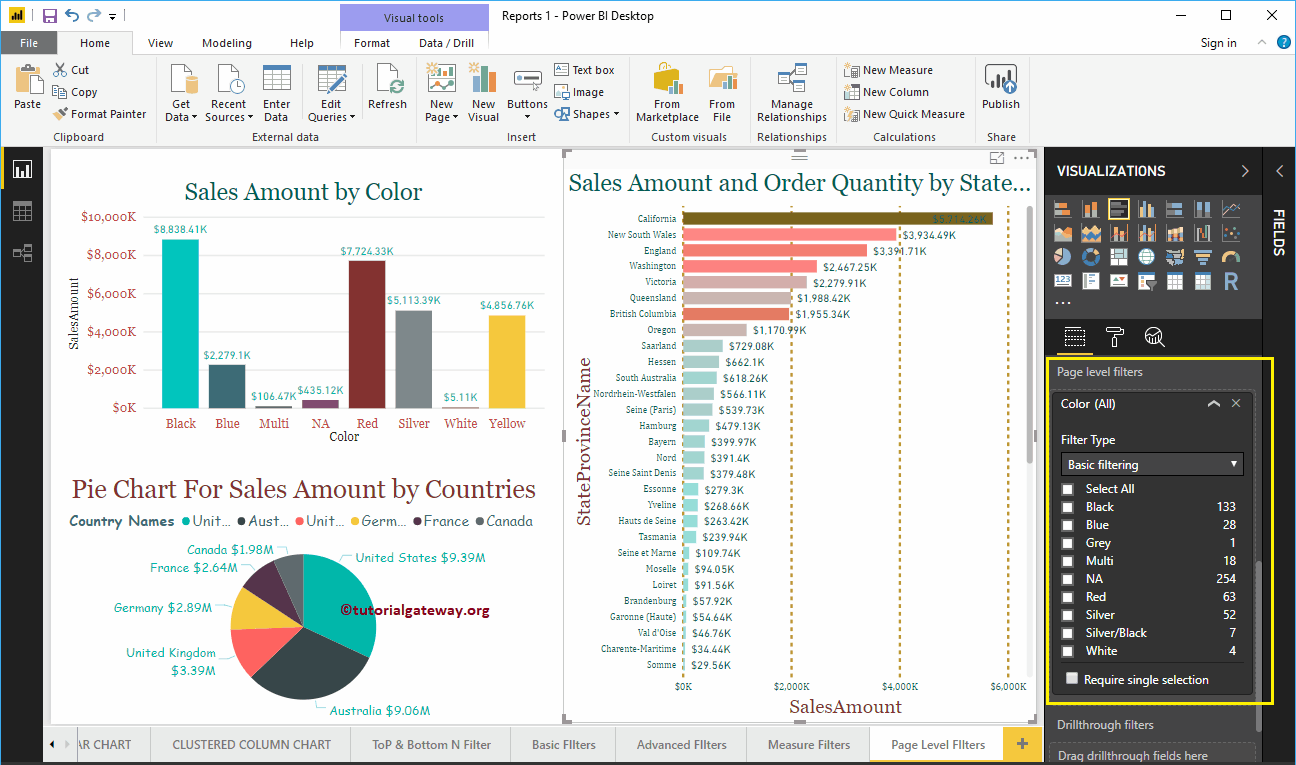
Let me remove the existing page level filters in Power BI, and drag and drop the Product Color from fields section to the Page level Filters.
Power BI Page Level Filters 8

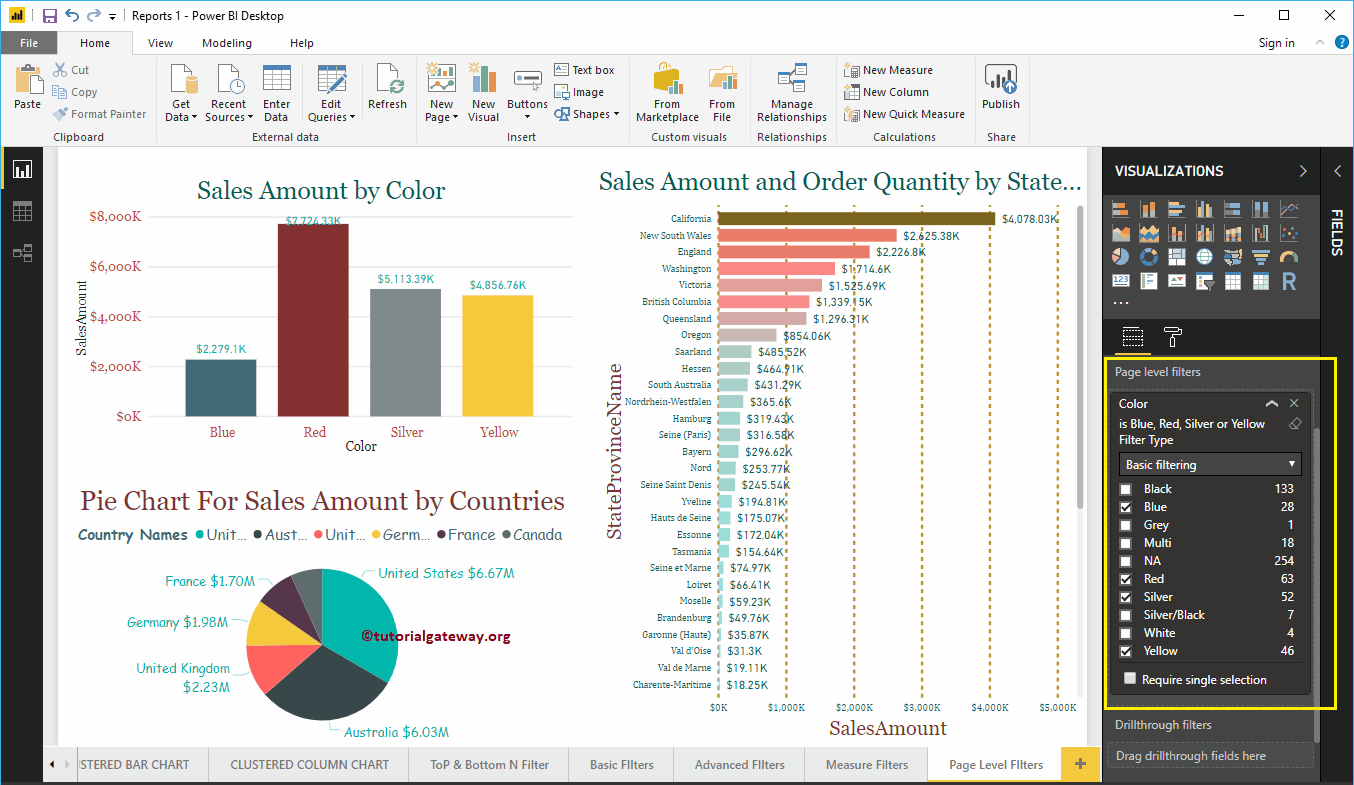
Please select Blue, Red, Silver, and Yellow colors as the basic Filtering fields.

From the screenshot below, you can see that the Column chart is displaying the Sales Amount for the selected colors. The Pie chart is displaying the sales amount for the selected product colors, and Bar chart is displaying the sales amount for selected colors.
Power BI Page Level Filters 9

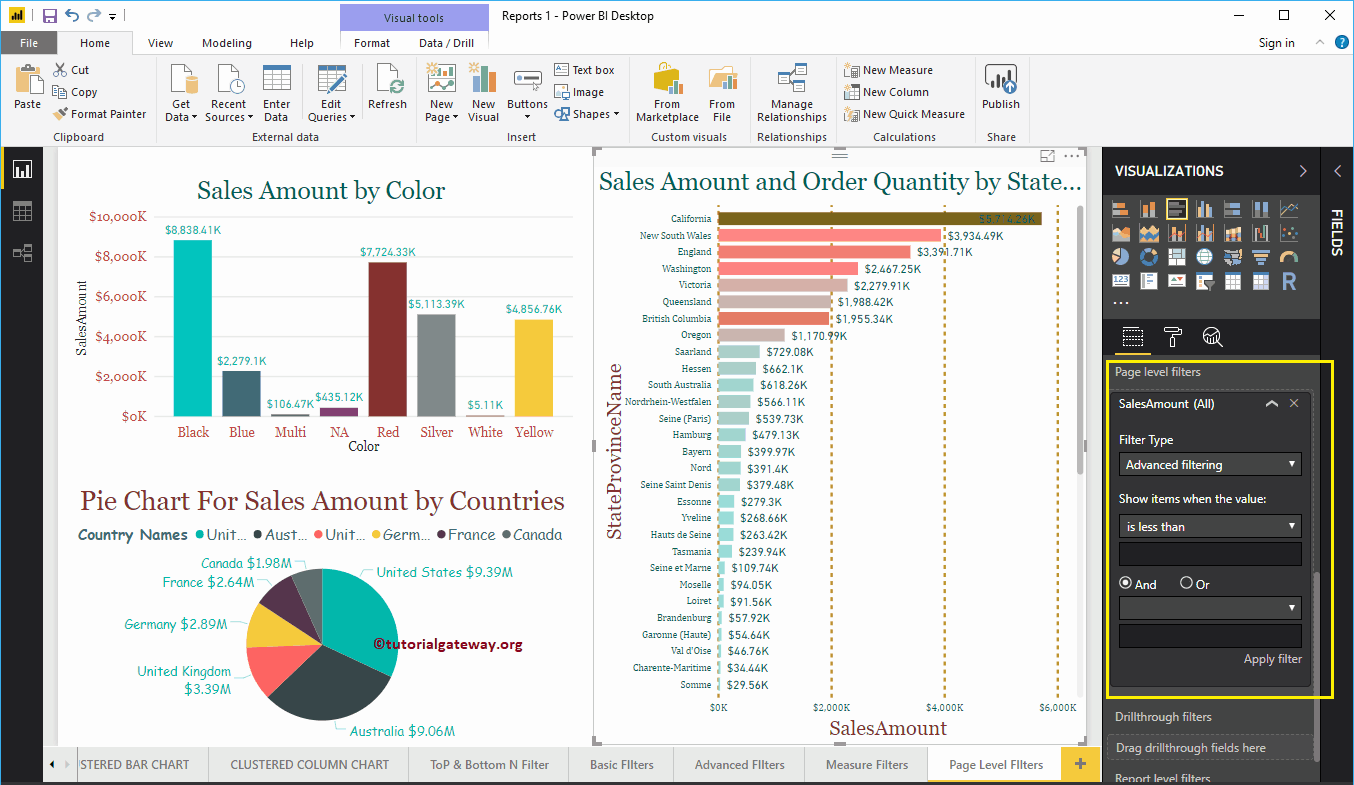
Let me remove the existing page level filters, and drag and drop the Sales Amount from Fields section to the Page level Filters. Next, expand the Sales Amount to see the filter options. Please refer to Filters on Measures article to understand these options.
Power BI Page Level Filters 10

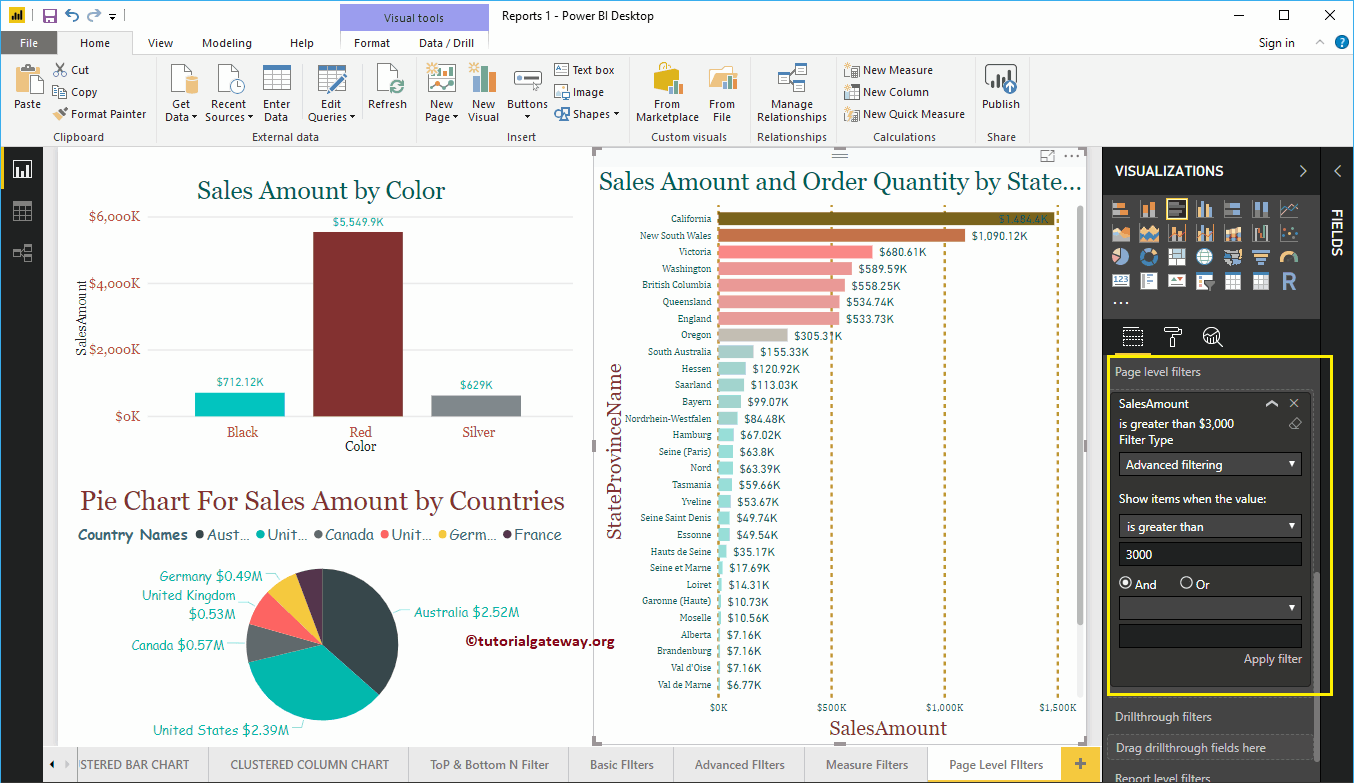
For this Power BI Page Level Filters demonstration purpose, we selected is greater than as the operator, and 3000 the value. All the reports on the below page are displaying the countries or states whose Sales Amount is greater than 3000.
Power BI Page Level Filters 11

Placed Under: Power BI

  • Install Power BI Desktop
  • Connect Power BI to SQL Server
  • Add Rename and Duplicate Pages
  • Connect to Multiple Excel Sheets
  • Get Excel Data to Power BI
  • Get Text File Data to Power BI
  • Load Data from Multiple Sources
  • Remove Power BI Table Columns
  • Create Power BI Bins
  • Power BI Joins
  • Change Column Data Types
  • Combine Multiple Tables
  • Power BI Clusters
  • How to Enter Data into Power BI
  • How to Format Dates in Power BI
  • Create Power BI Groups
  • Create Power BI Query Groups
  • Create Power BI Hierarchy
  • Power BI Pivot Table
  • Power BI Unpivot Table
  • Rename Power BI Table Names
  • Rename power bi column names
  • Split Columns in Power BI
  • Remove reorder power bi column
  • Power BI Area Chart
  • Format Power BI Area Chart
  • Power BI Bar Chart
  • Format Power BI Bar Chart
  • Power BI Clustered Bar Chart
  • Clustered Column Chart
  • Create a Power BI Card
  • Format Power BI Card
  • Create Power BI Multi-Row Card
  • Format Power BI Multi-Row Card
  • Power BI Column Chart
  • Format Power BI Column Chart
  • Power BI Donut Chart
  • Format Power BI Donut Chart
  • Power BI Funnel Chart
  • Format Power BI Funnel Chart
  • Power BI Heat Map
  • Power BI Line Chart
  • Format Power BI Line Chart
  • Line & Clustered Column Chart
  • Format Line & Clustered Column
  • Line & Stacked Column Chart
  • Format Line & Stacked Column
  • Power BI Matrix
  • Format Power BI Matrix
  • Power BI Table
  • Format Power BI Table
  • Add Data Bars to Power BI Table
  • Add alternate Table Row Colors
  • Power BI Pie Chart
  • Format Power BI Pie Chart
  • Power BI Ribbon Chart
  • Format Power BI Ribbon Chart
  • Power BI Treemap
  • Format Power BI TreeMap
  • Power BI Scatter Chart
  • Format Power BI Scatter Chart
  • Power BI Stacked Area Chart
  • Power BI Stacked Bar Chart
  • Format Stacked Bar Chart
  • Power BI Stacked Column Chart
  • Format Stacked Column Chart
  • Power BI Waterfall Chart
  • Format Power BI Waterfall Chart
  • Power BI 100% Stacked Bar Chart
  • 100% Stacked Column Chart
  • Create a Power BI Map
  • Format Power BI Map
  • Power BI Filled Map
  • Format Power BI Filled Map
  • Power BI Basic Filters
  • Power BI Slicer
  • Power BI Top 10 Filters
  • Power BI Drill through Filters
  • Power BI Filters on Measures
  • Power BI Advanced Filters
  • Power BI Report Level Filters
  • Power BI Page Level Filters
  • Power BI Calculated Columns
  • Add Conditional Column
  • Create Power BI Custom Column
  • Power BI Calculated Measures
  • Power BI Calculated Tables
  • Power BI DAX String Functions
  • Power BI DAX Math Functions
  • DAX Trigonometric Functions
  • Power BI DAX Date Functions
  • Power BI DAX Logical Functions
  • Power BI DAX Agg. Functions
  • Power BI Dashboard Introduction
  • Power BI Dashboard Settings
  • Power BI Dashboard Actions
  • Delete Power BI Dashboard
  • Subscribe Power BI Dashboard
  • Add Web Content to Dashboard
  • Add Image to Dashboard
  • Add video to power bi dashboard
  • Add Title to Power BI Dashboard
  • Pin Workbooks to Dashboard
  • Register to Power BI Service
  • Connect to Power BI Service
  • Create Power BI Workspace
  • Share Power BI Workspace
  • Create a Report in Workspace
  • Rename a Report in Workspace
  • Rename a Dataset in Workspace
  • Quick insights in Power BI
  • Get insights in Power BI
  • Publish power bi desktop report
  • Upload Power BI Workbooks
  • Upload Excel Files to Dashboard
  • Edit Power BI App
  • View Published Power BI App
  • Publish Power BI App
  • Share Power BI Dashboard
  • Share Power BI Workspace
  • Share Power BI Report
  • Power BI Q&A
  • Power BI Q&A Advanced
  • Customize Q&A Suggestions
  • C Tutorial
  • C# Tutorial
  • Java Tutorial
  • JavaScript Tutorial
  • Python Tutorial
  • MySQL Tutorial
  • SQL Server Tutorial
  • R Tutorial
  • Power BI Tutorial
  • Tableau Tutorial
  • SSIS Tutorial
  • SSRS Tutorial
  • Informatica Tutorial
  • Talend Tutorial
  • C Programs
  • C++ Programs
  • Java Programs
  • Python Programs
  • MDX Tutorial
  • SSAS Tutorial
  • QlikView Tutorial

Copyright © 2021 | Tutorial Gateway· All Rights Reserved by Suresh

Home | About Us | Contact Us | Privacy Policy