Power BI Calculated columns help improve data models by adding a new column derived from the existing columns in a table. Calculated columns will be computed and stored in the data model during the data loading process. Microsoft allows you to create custom or calculated columns from existing ones. This article shows you how to create calculated columns with examples.
In Power BI, we can use the Calculated columns to create a custom column within a table from one more column using the DAX operators and formulas. These are helpful if we need the desired columns in our dataset or a new column to visualize particular data. For example, we can find the actual sales by removing the tax from total sales.
One of the main advantages of calculated columns is their reusability. Once created, we can use this calculated column in multiple charts. If updates or changes happen to the calculated column, it will automatically reflect all its used places.
How to Create Calculated Columns in Power BI
To demonstrate these calculated columns, we will use the SQL Data Source that we created in the Connect to SQL Server article. So, refer to the same.
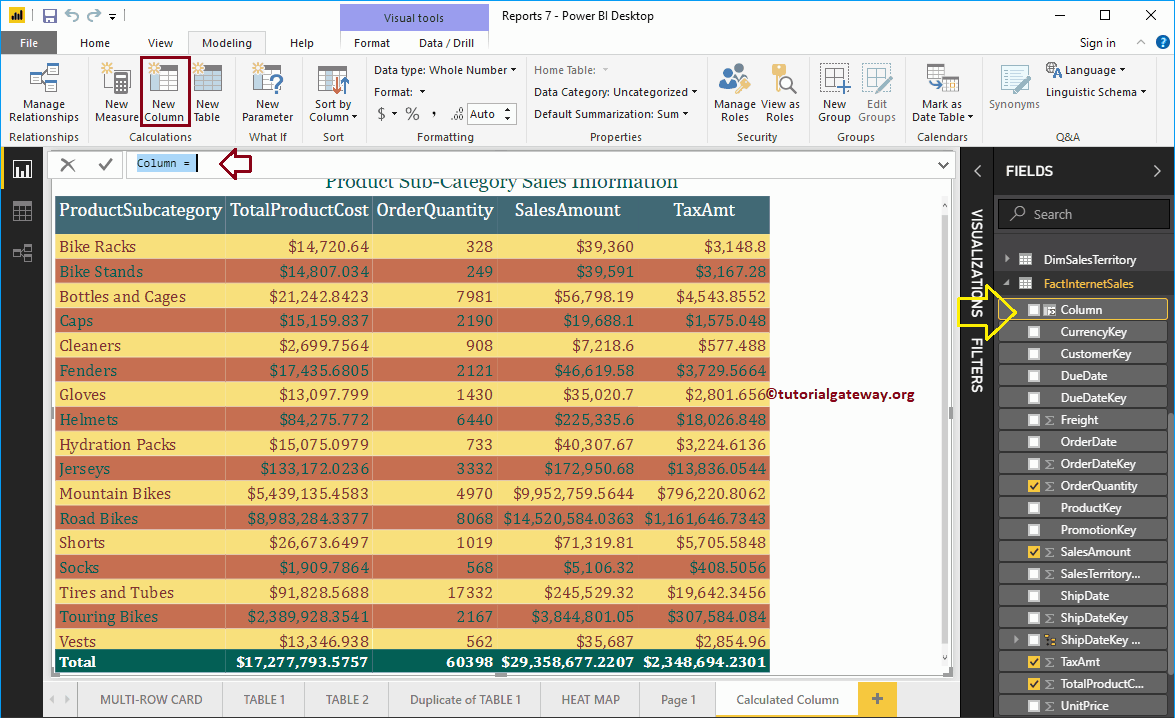
This section explains the step-by-step process of creating Calculated Columns in Power BI and how to use them in data visualization. First, you must select the table where you want to create the calculated column. Next, please click on the New Column option under the Modeling tab.
Clicking the New Column option opens the Power BI DAX formula bar, as shown below. It also creates a new column under the selected table with the default name. Use the Formula bar to write the expression for this new column with the help of DAX operators and functions.
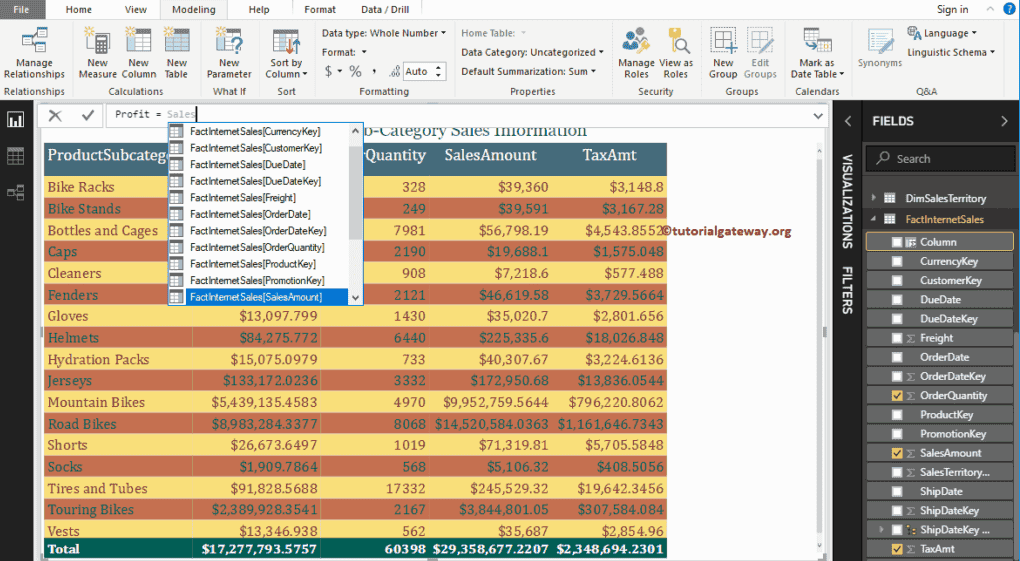
You can rename the default name as per your requirement. Let me rename the column as Profit. For this Power BI Calculated Columns demo purpose, we select Sales Amount and Total Product Cost from the Fact Internet Sales table. As you can see from the screenshot below, Power BI IntelliSense is showing the suggestions while I am typing.
Remember, use calculated columns only when they are required. As they perform calculations on a row-based, it impacts the overall performance. If you need a calculation for a single use, try applying DAX on the existing column instead of creating a new one.
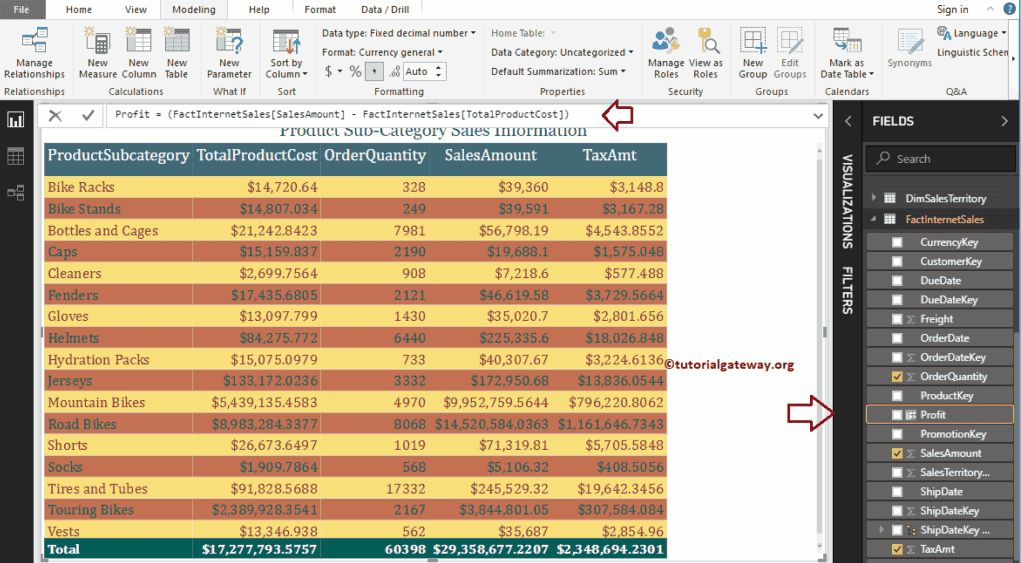
From the screenshot below, you can see that we are calculating the Profit by removing the Total Product Cost from the Sales Amount. Next, a new column called profit is created by clicking enter.
Visualizing the Calculated Columns
Once we have created the Power BI calculated column, the next step is to use it in tables, charts, or any data visual. For this, you have to drag and drop the calculated columns onto the relevant fields of the visualization.
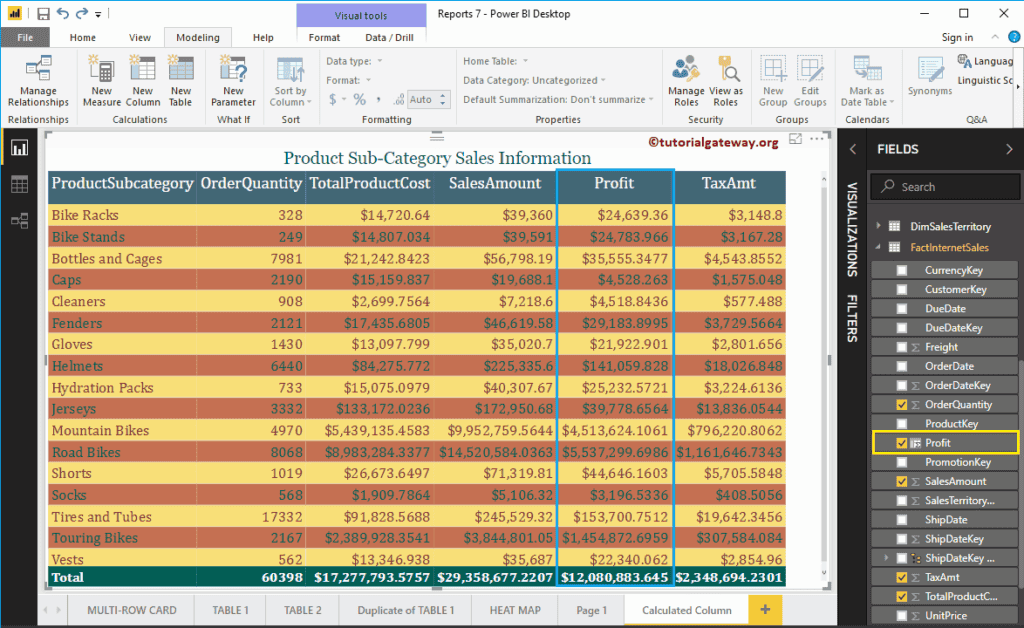
Let me add the calculated col we created earlier to the table. Remember, this is the table we designed in the Table Report article.
NOTE: Whenever the data refreshes or changes, calculated columns will recalculate based on the updated data.