Power BI Drill Up and Drill Down Reports help you to drill down the reports to multi-levels. You can see the data at each level using this Drill Down and Up report action. Let us see how to create Drill Up and Down Reports with an example.
To demonstrate the drill up and drill down reports in Power BI, we are going to use the hierarchy that we created in the Create Hierarchy article.
Create Drill Up and Drill Down Reports in Power BI
Drag and Drop the Sales Amount from the Power BI Fields section to Canvas automatically create a Column Chart, as shown in the screenshot below.
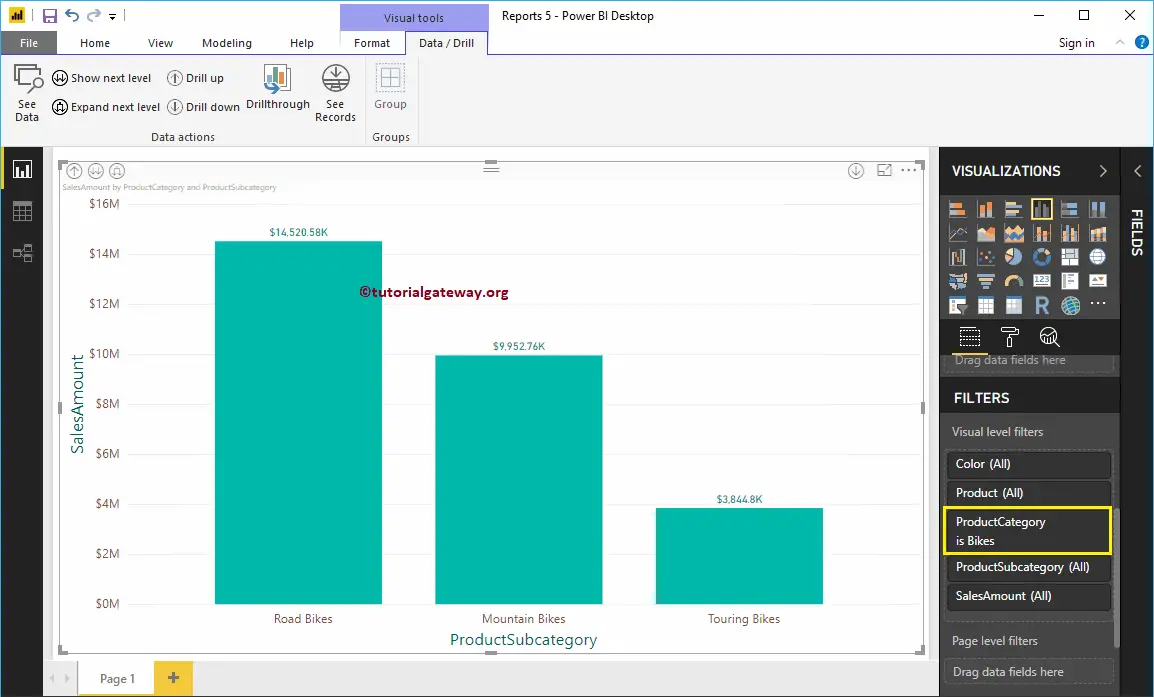
Next, let me add the Product Hierarchy to the Axis to create a column chart that shows the Sales Amount by Product Category.
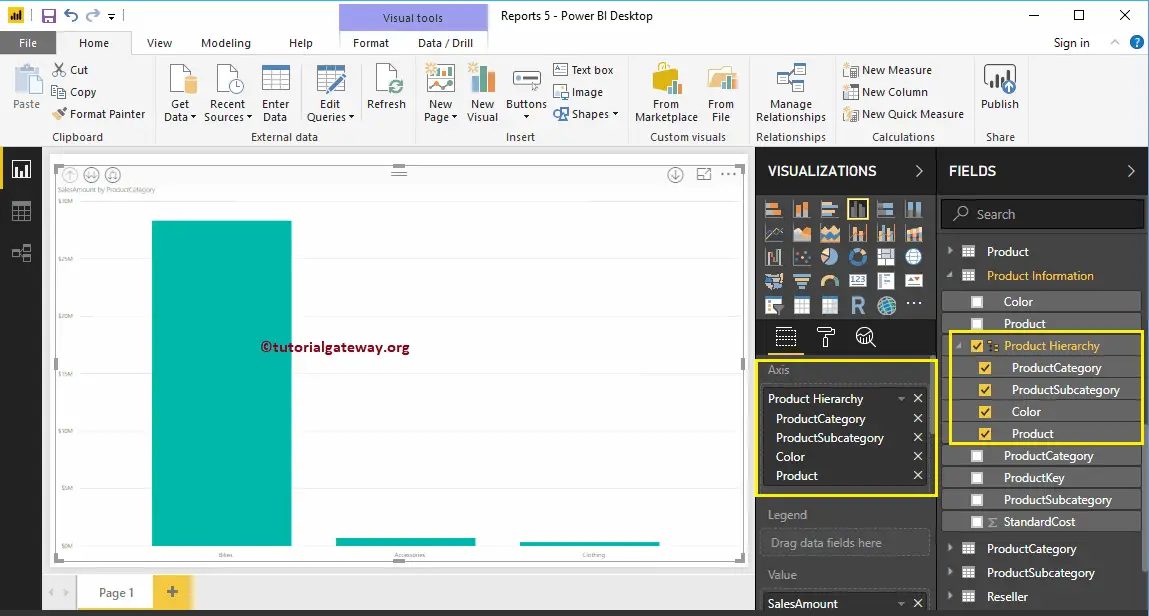
Let me do some quick formatting to this column chart. I suggest you refer to the Format Column Chart article to understand the formatting options.
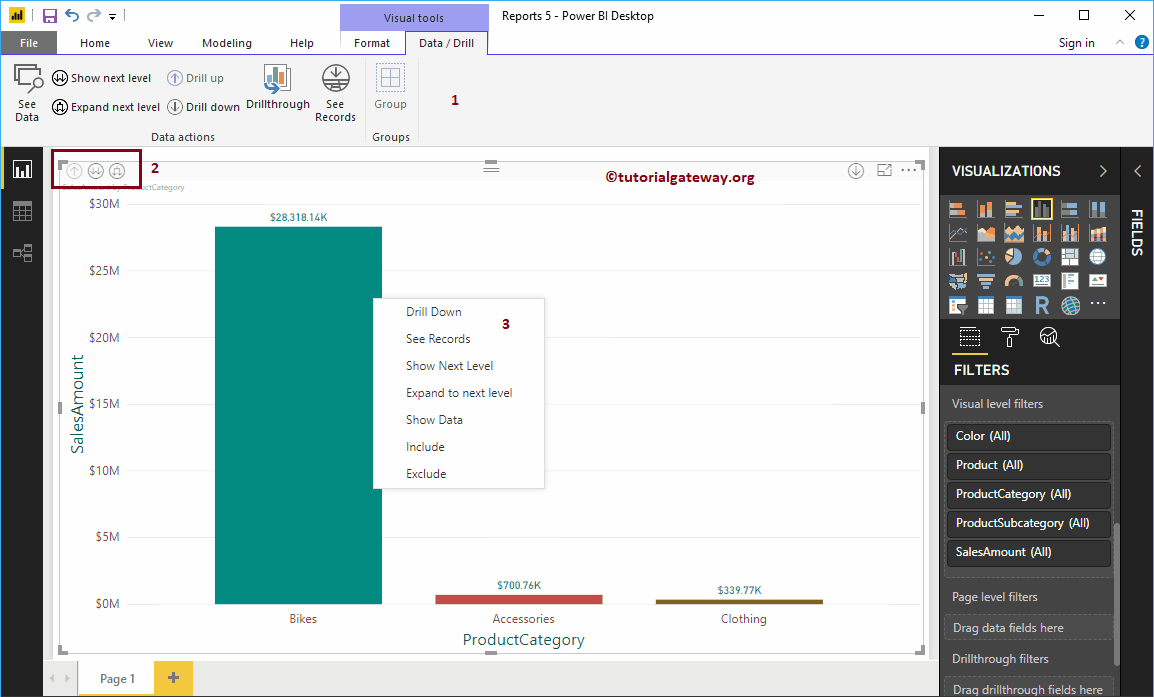
You can perform Power BI Drill up and Drill down report action using any of the three options.
- Go to the Data / Drill tab to see these properties
- If your data has multiple levels, then these buttons are displayed in the top left corner.
- Right-click on the report to show the context menu. You can use this menu to select the levels.
NOTE: There is a difference between Shown Next Level and Drill Down. Show the Next level to show you the complete data in the next level, but the Drill down option shows you the selected data.
Let me select the Go to the next level in the hierarchy button on the top left corner of the report.
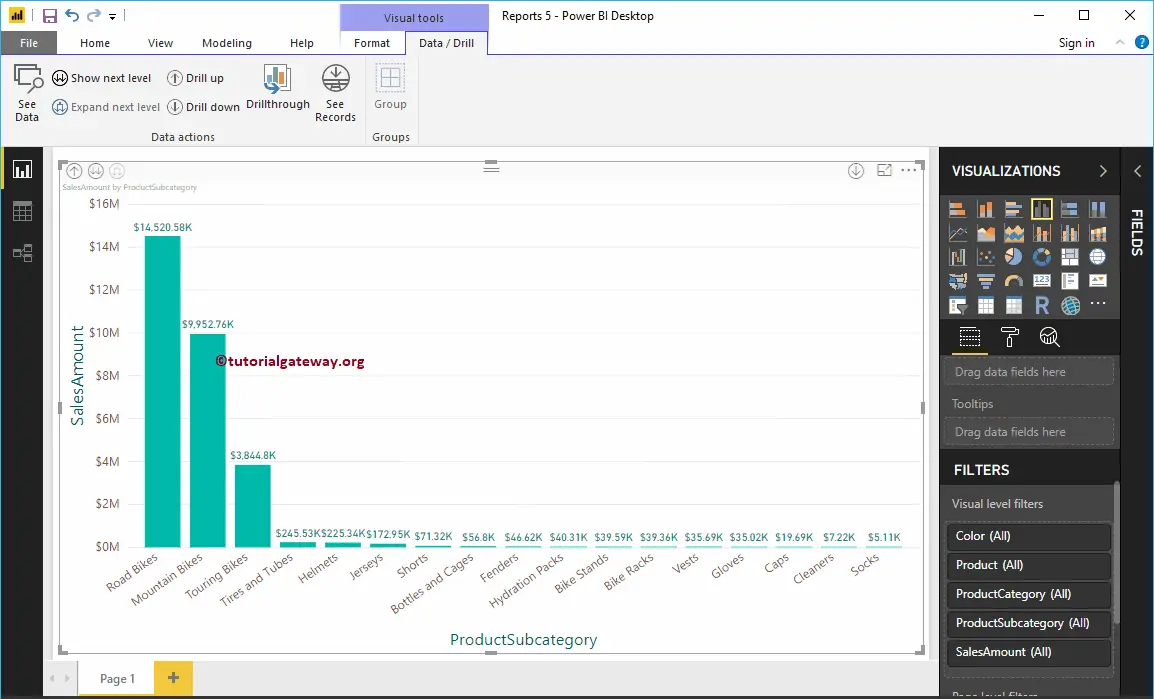
Now you can see the Sales by Product Subcategory (level 2). If you notice closely, the Drill up button on the ribbon and the top left corner is enabled. It is because there is a possibility to go up (product Category level)
This time, we are using the context menu. Let me select and right-click on any Column and select the Show Next Level option
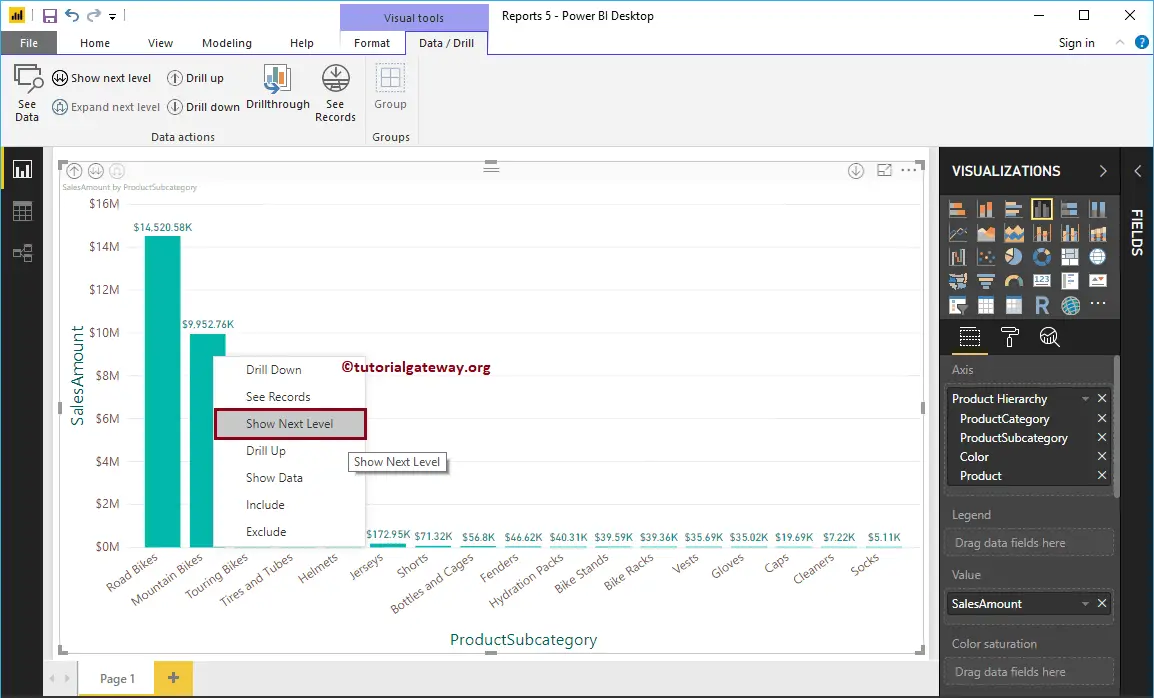
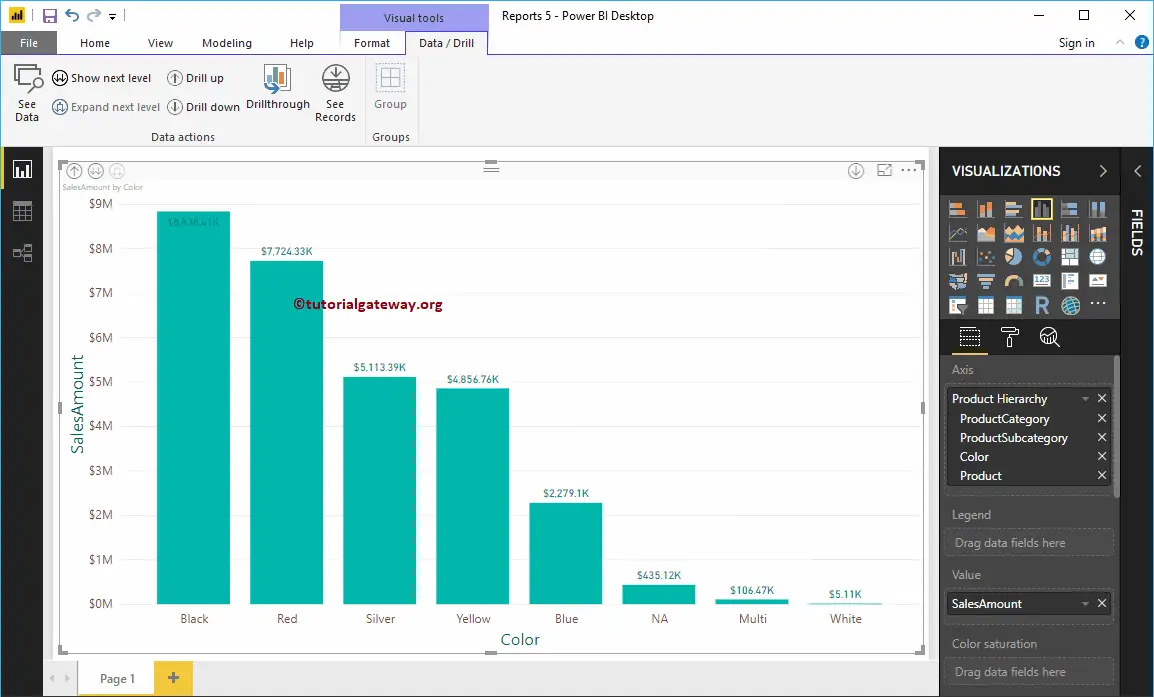
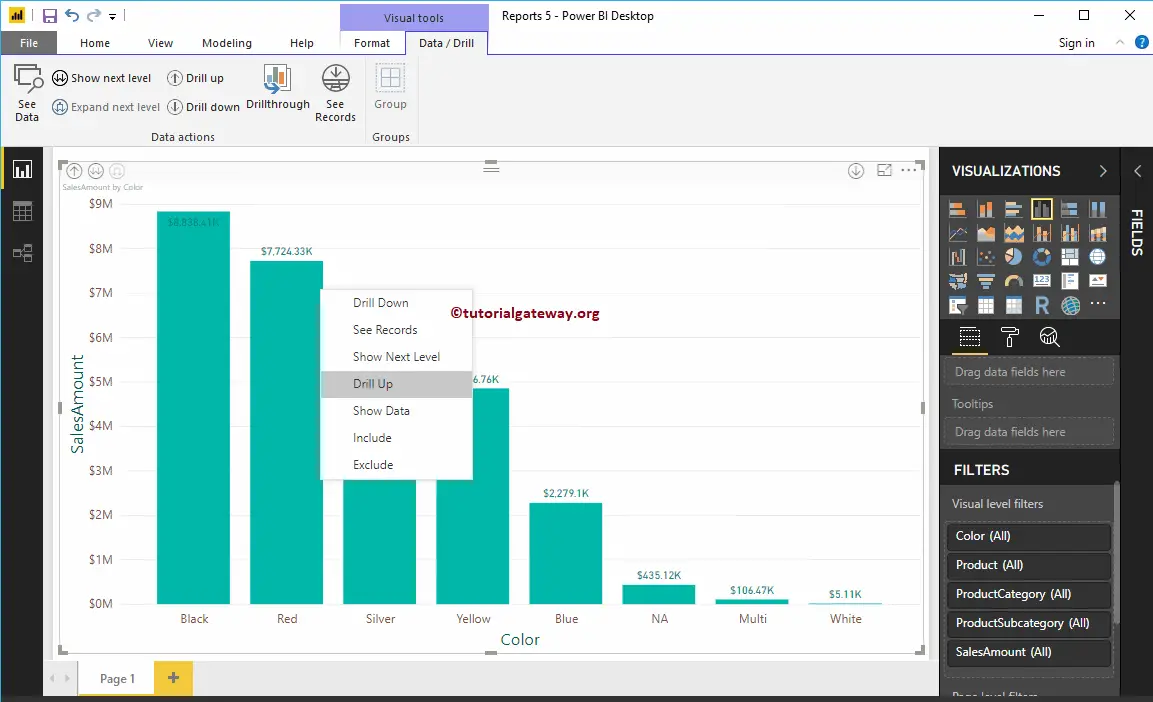
Now you can see the column chart that shows the Sales by Product Color
This time, we click on the Show Next Level button on the Data/Drill tab ribbon.
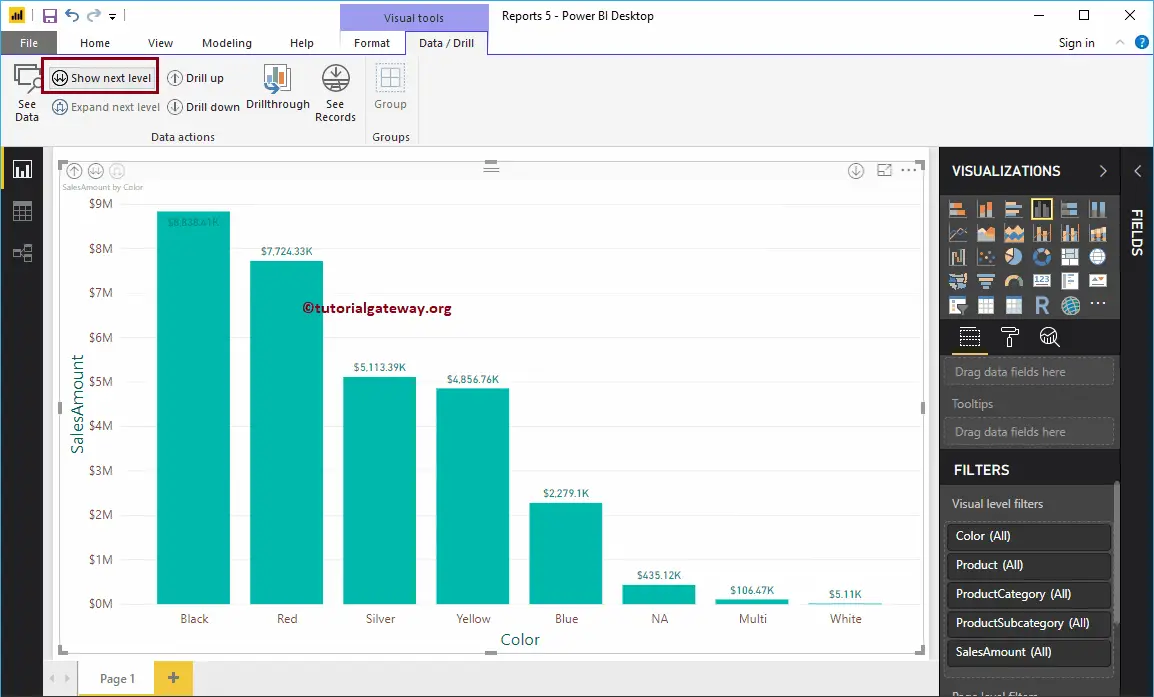
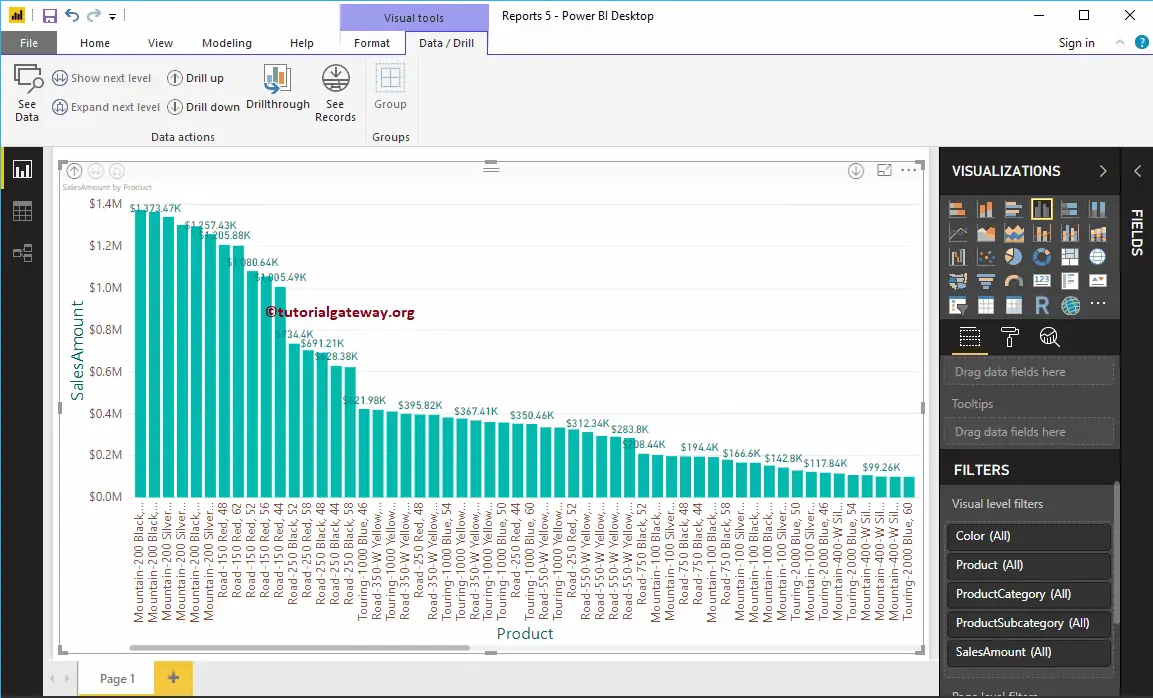
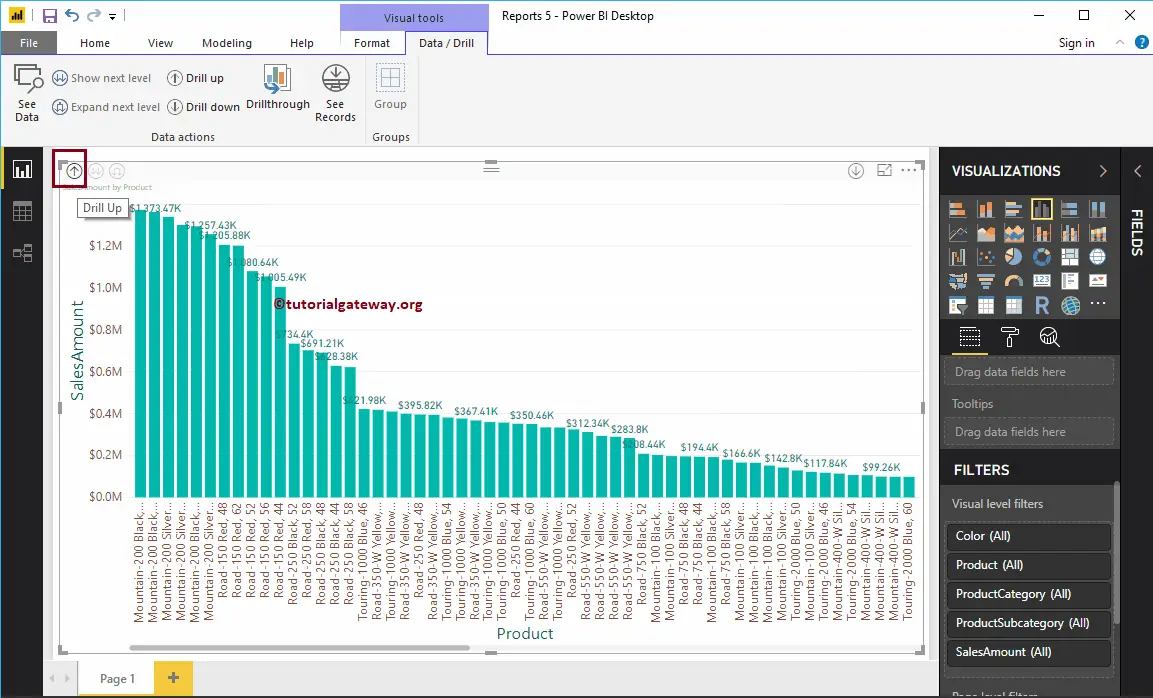
Now you can see the Sale Amount by Product. It is the last level of a hierarchy, and that’s why the ” show next level button is disabled.
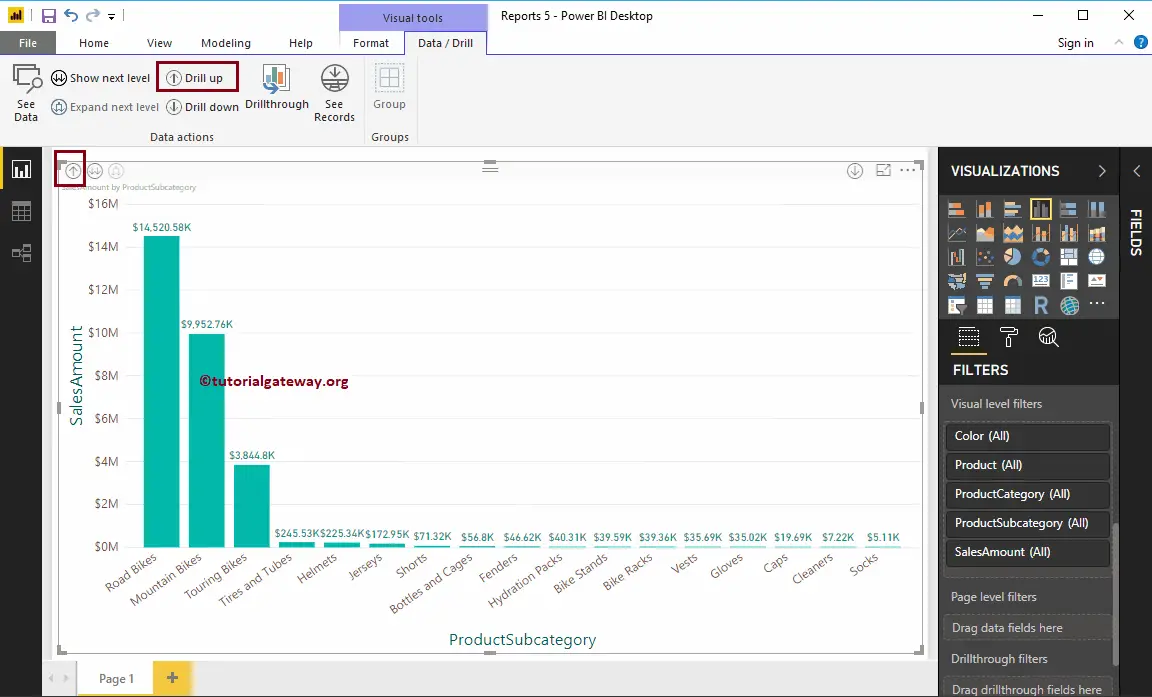
Drill up Reports in Power BI
Click on the Drill up button on the top left corner of the report.
Now you can see the Sales by Product Color.
Let me select any random column and select the Drill up option from the context menu.
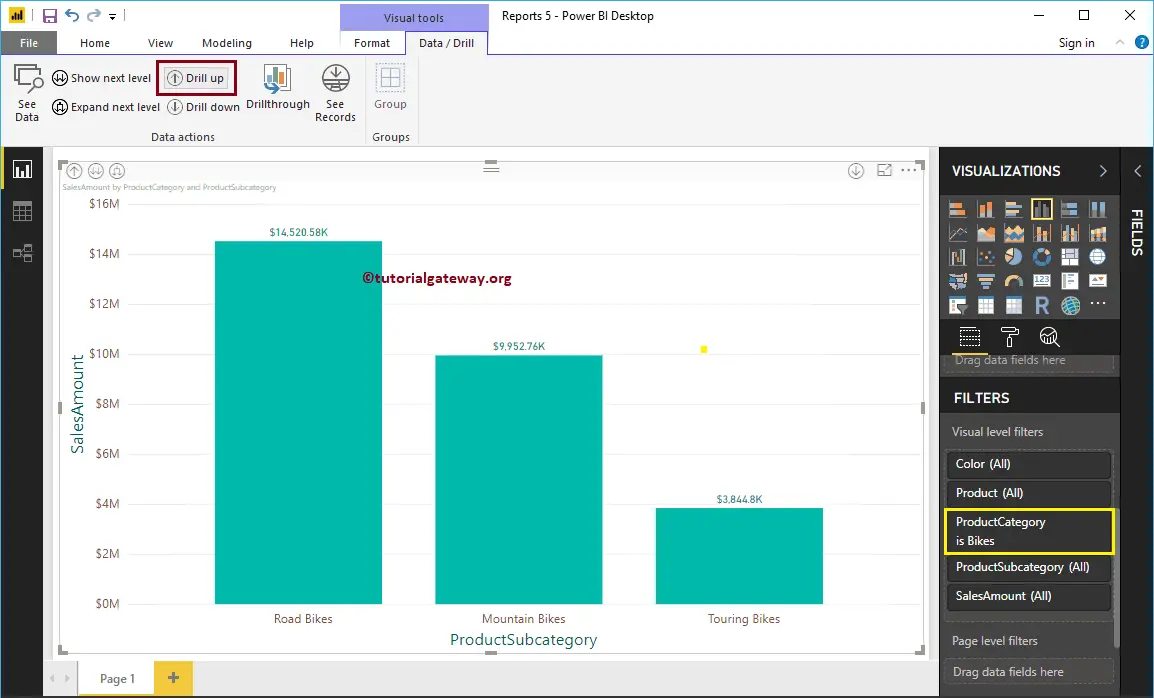
Now you can see the Sales by Product Subcategory. Let me hit Drill up in the ribbon
Now you can see the column chart that shows the Sales by Product Category.
Drill Down Reports in Power BI
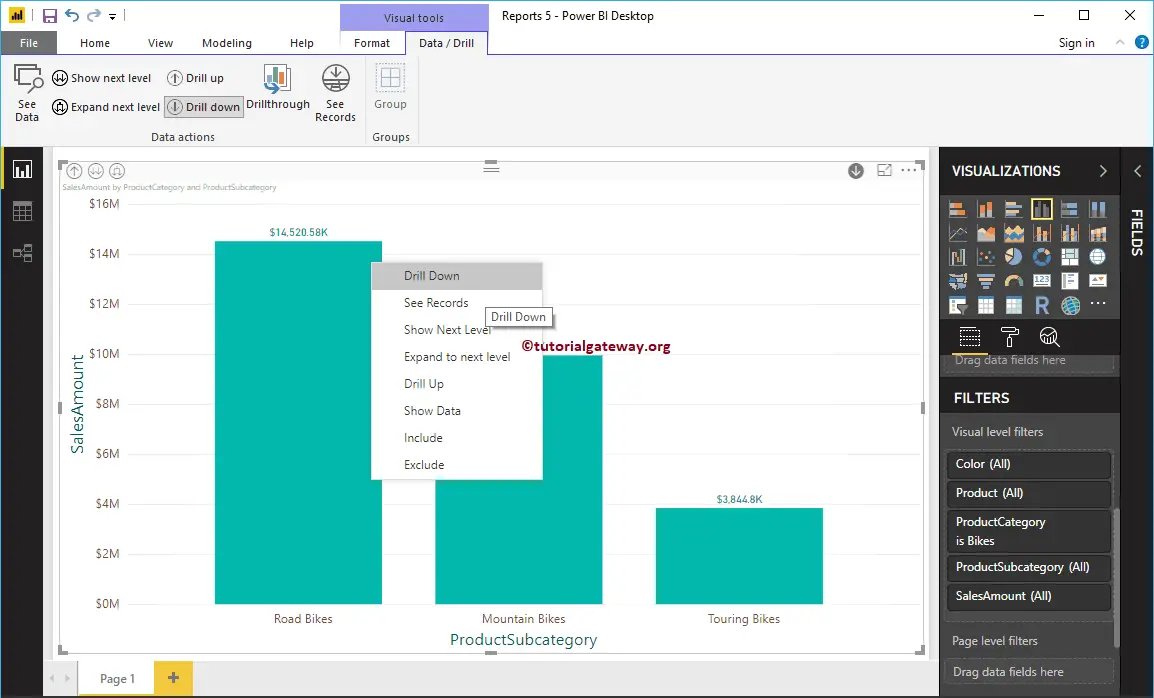
Please select the Power BI column on which you want to drill down, and right-click on it will open the context menu. Let me select the Drill down option in this report.
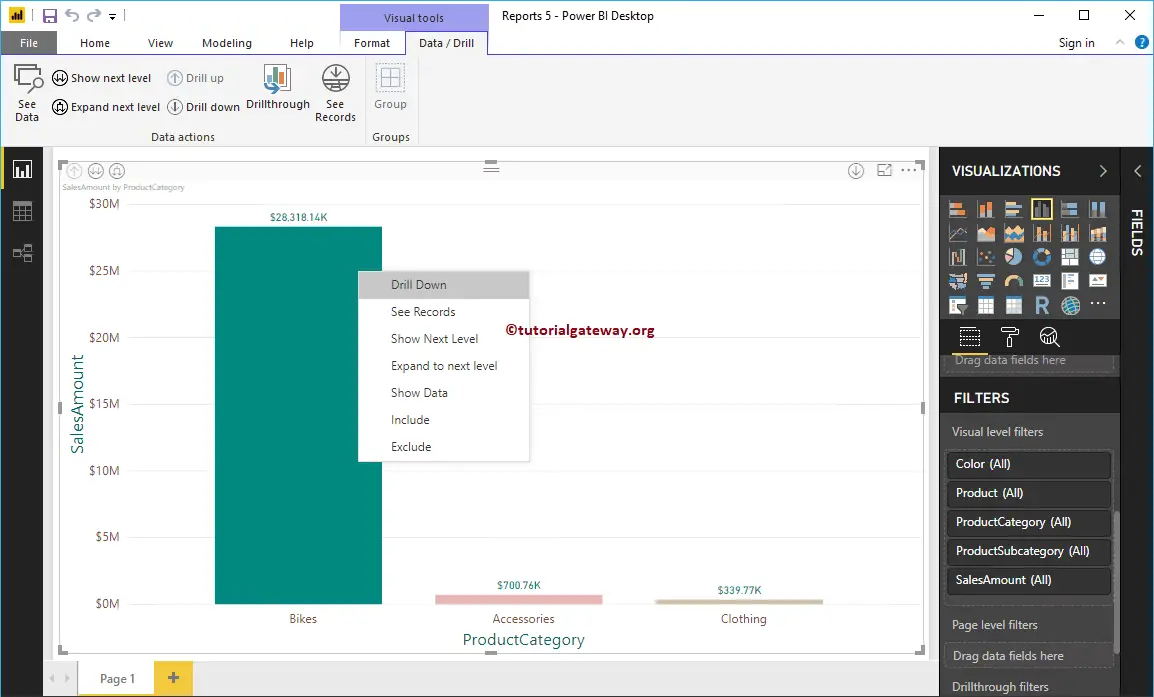
You can see the column chart showing the Sales by product Subcategory. However, this only shows for the Bikes category (not the accessories or the Clothing). If you observe closely, Power BI added the Bikes under the filter section.
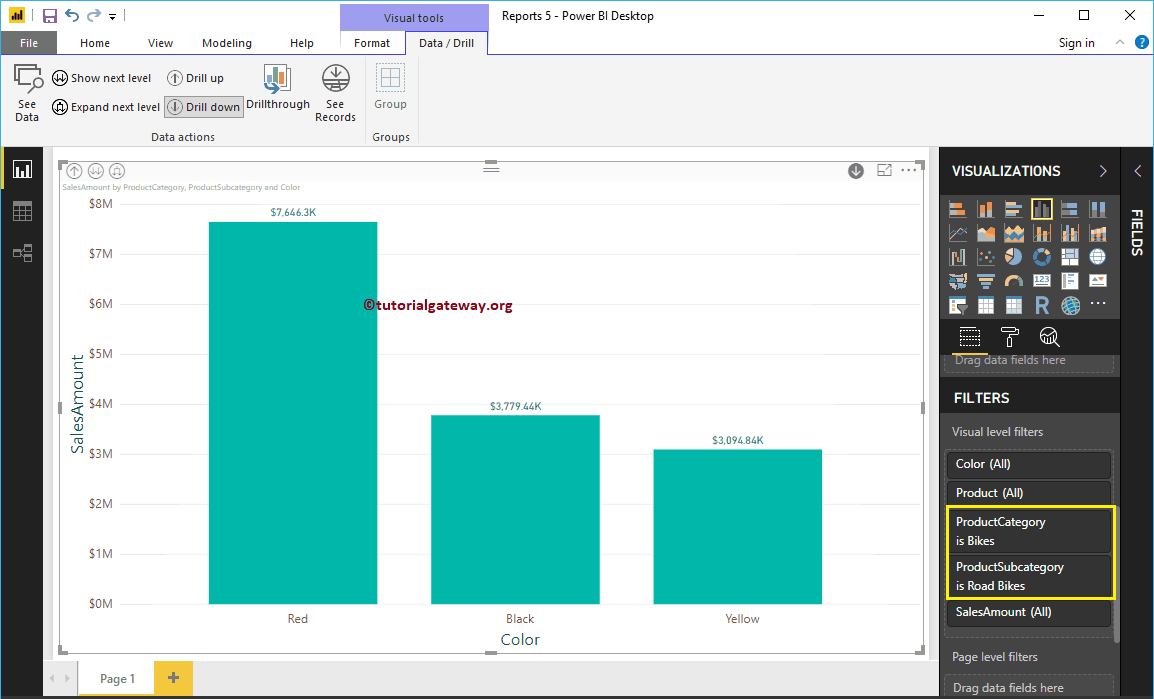
Let me select the Road Bikes and click Drill Down
Now you can see the Road Bikes Sales by product Color
Click the Power BI Drill up button to go to the previous level
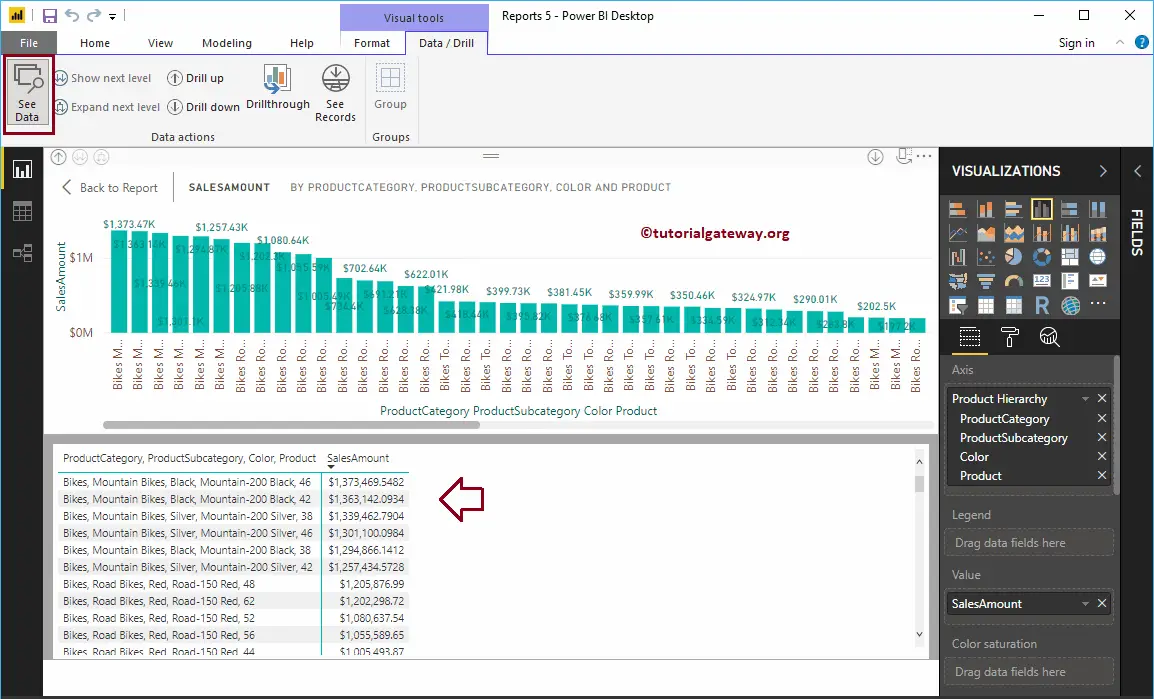
Click on the See Data button to see the data that we used to create this report.