Let me show you the procedure to Subscribe Power BI Report with a practical example. Before we start the Power BI email report subscription process, let me show you the existing reports in my workspace.
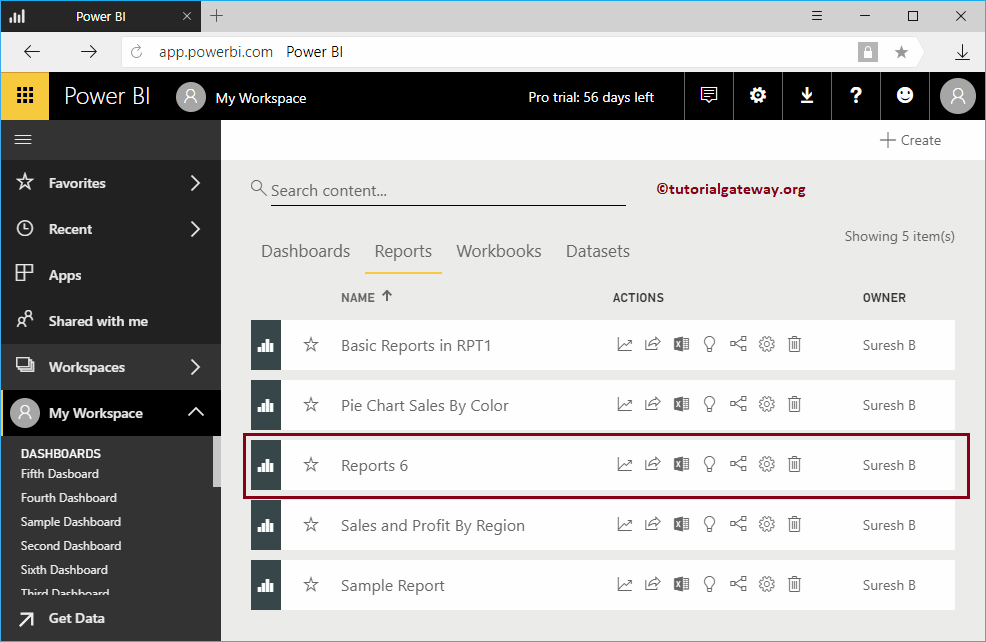
Please click on My Workspace and select the Reports tab to view them. As you can see from the screenshot below, there are five reports. In this Report example, we Subscribe to Report 6. Let me click on Report 6 to see the pages in it.
- Please refer to the Create a Workspace and Dashboard articles to get in-depth knowledge.
How to Subscribe to Power BI Report
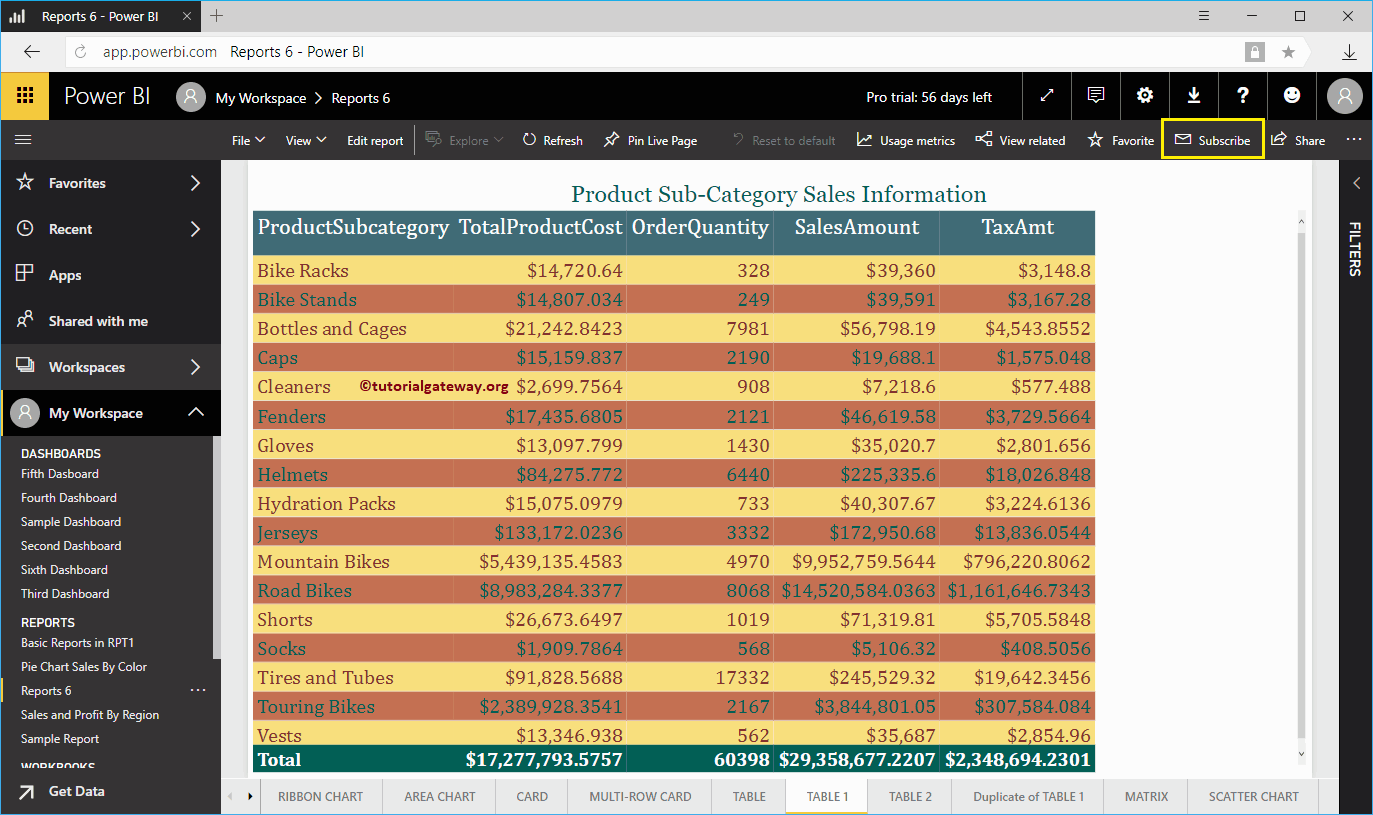
From the screenshot below, you can see there are many pages in this report. In this example, we start the subscription with Table 1. In order to Subscribe to Report (indeed Page), click on the Subscribe button on the Top right side, as shown below.
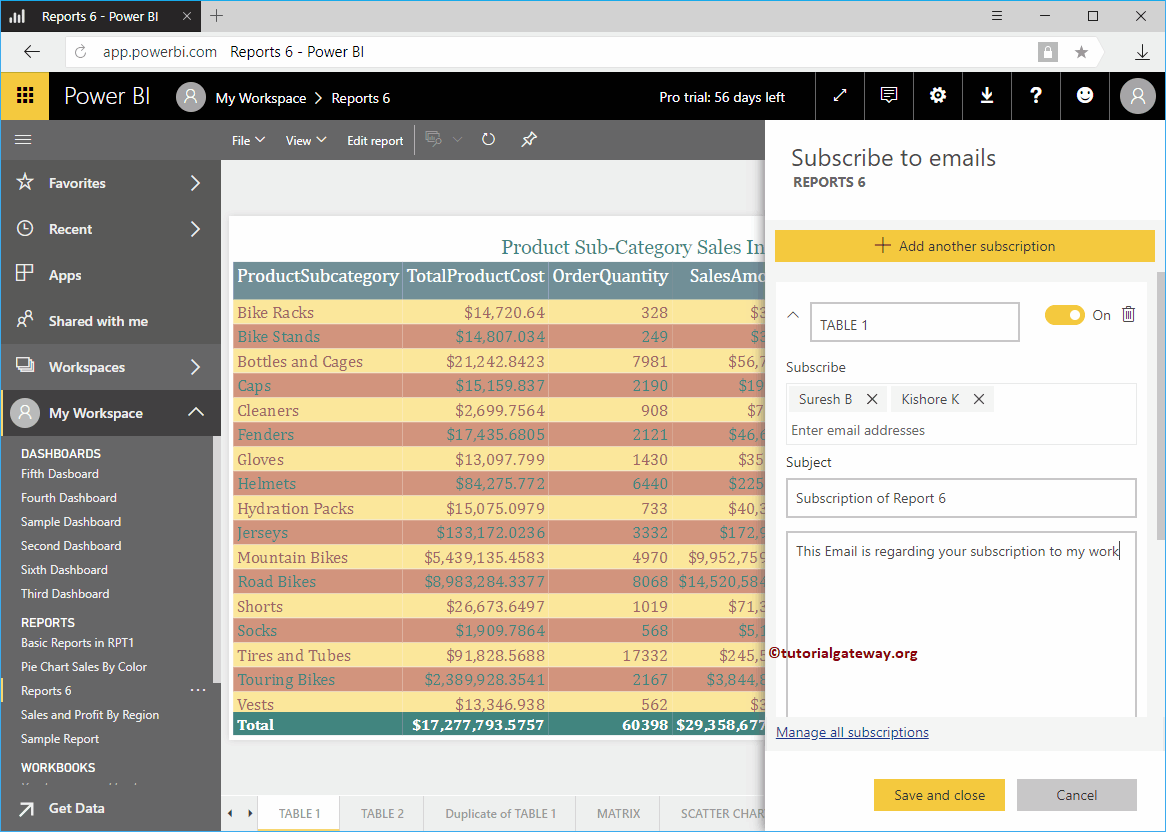
Clicking the button opens the Subscribe to Emails window in the report.
- The first text box is the page name.
- Subscribe: Please provide the Subscriber’s Email Ids.
- Subject: Email Subject
- Optional Message: You can write a Custom Message
Let me add Kishore’s Email id as the page Subscriber. It means it sends an Email to Kishore whenever data is updated.
Also, Give access to this dashboard: This allows the Subscribed user to access this dashboard.
Use the Dropdown box to select or change the page from this Power BI report. For the demo purpose, we selected Area Chart.
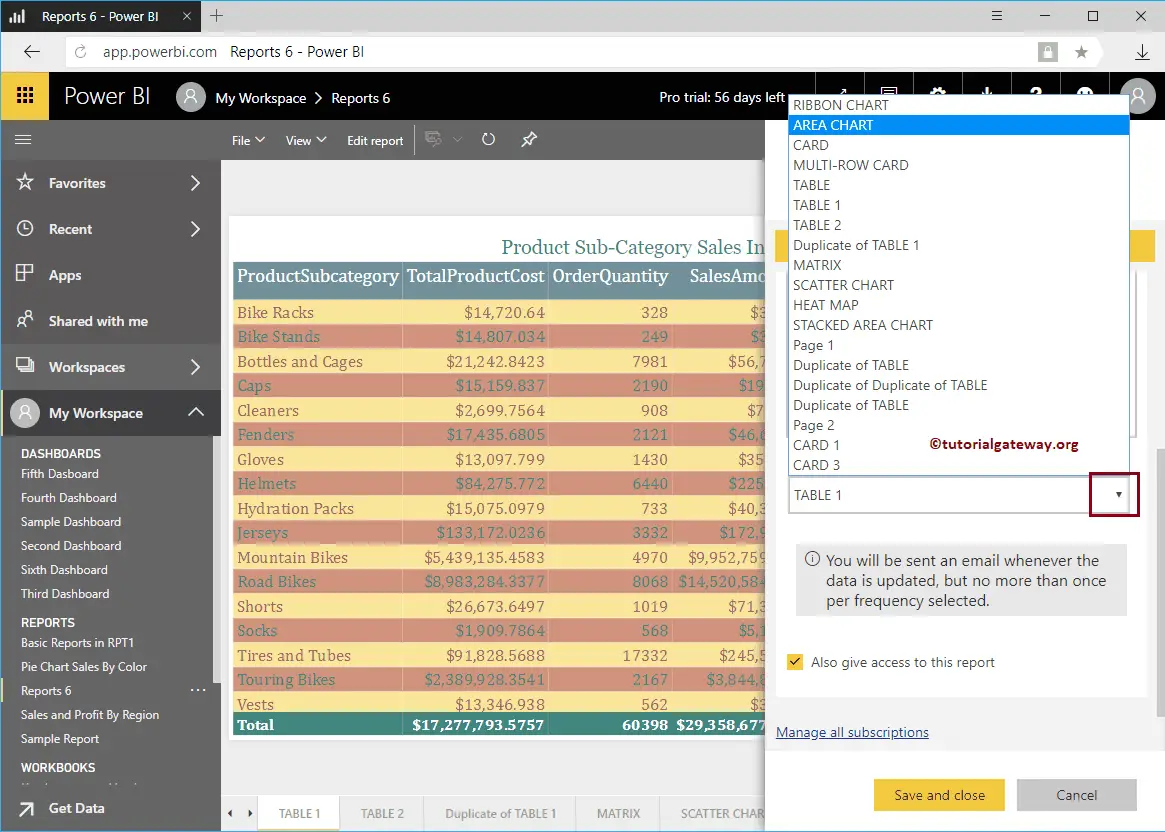
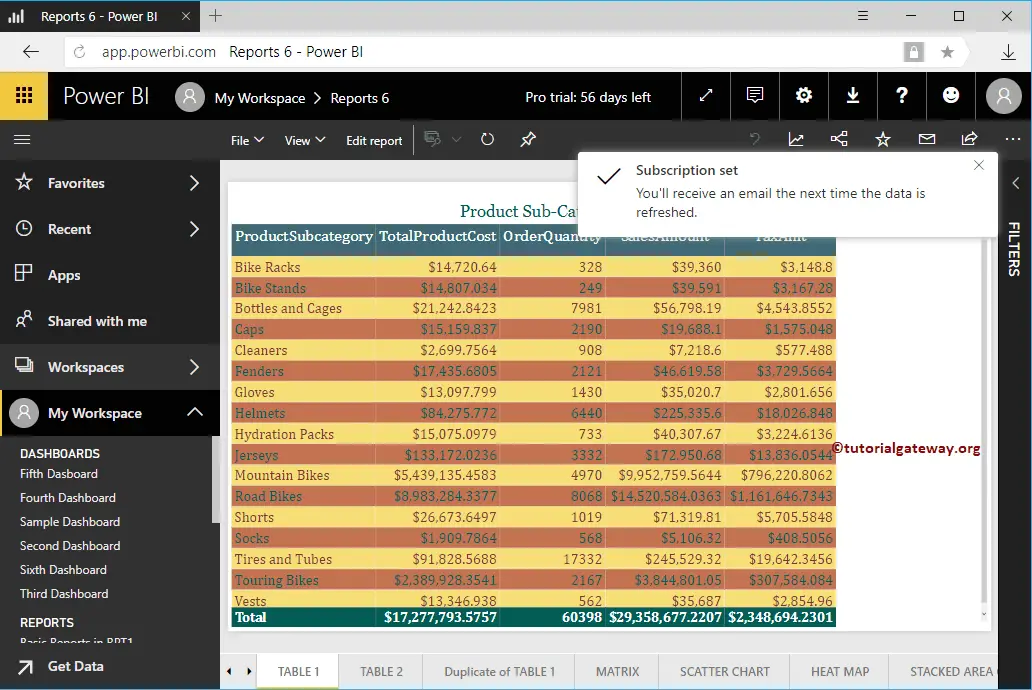
Power BI automatically changes the Subscription name based on the page you selected. Click Save and Close button
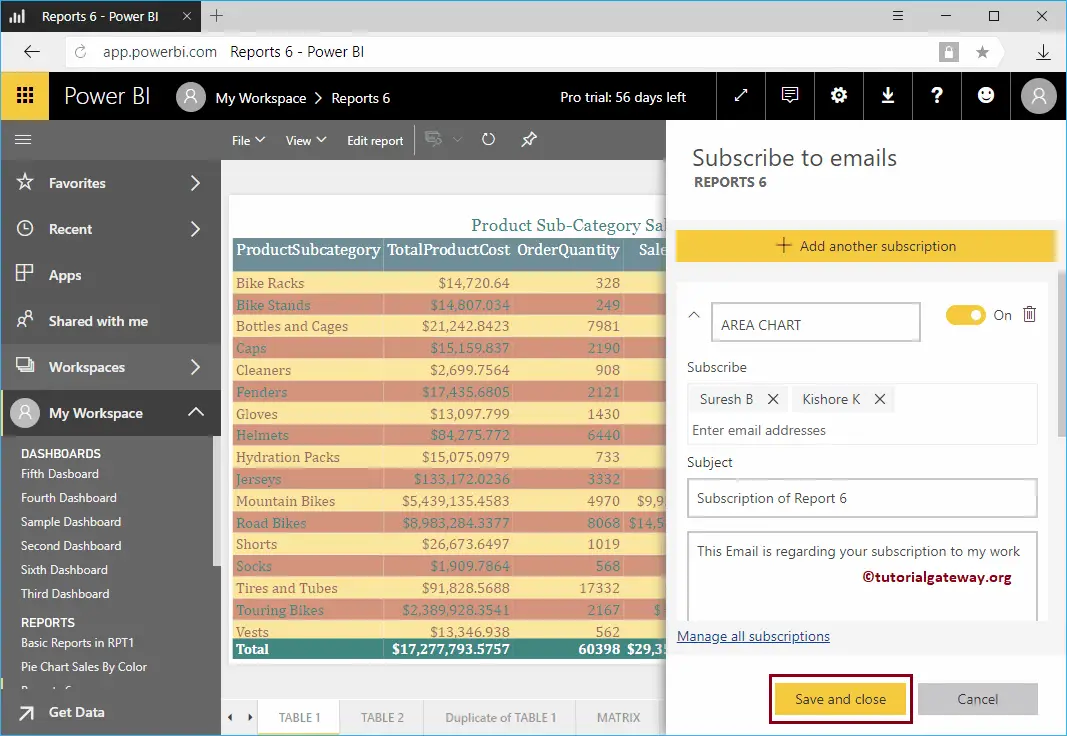
From the screenshot below, you can see that the subscription is set. I hope you understand the Subscribe Power BI Report concept.