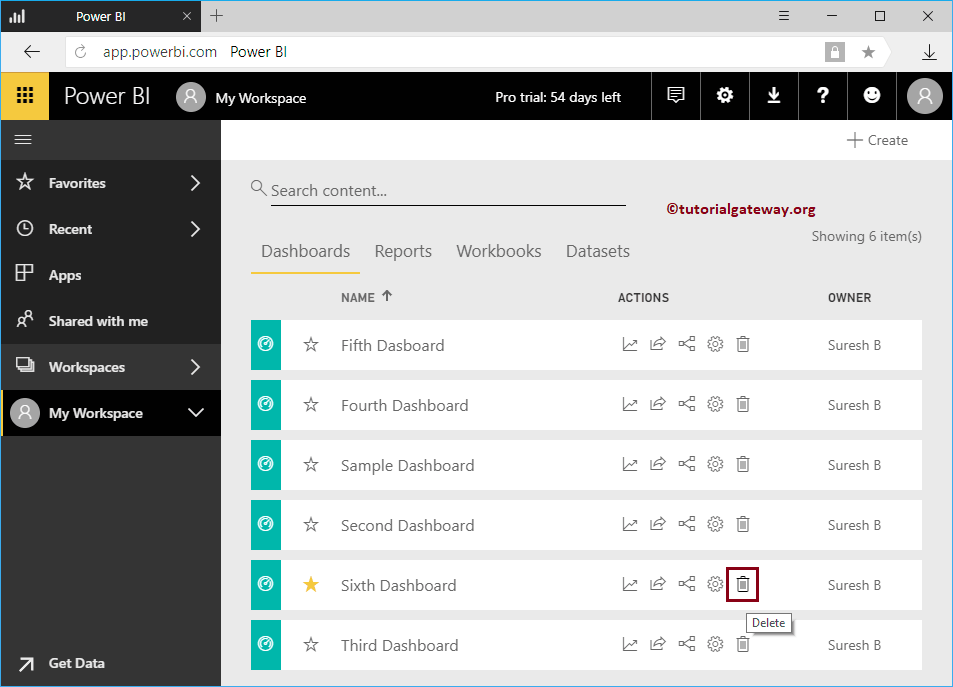
Let me show you the Power BI Dashboard Actions and their uses. Before we start exploring the list of dashboard actions in power bi, let me show you the existing dashboards in my Power BI workspace.
To view them, please click on the Power BI My Workspace, and then go to the dashboards tab. From the screenshot below, you can see that there are six dashboards.
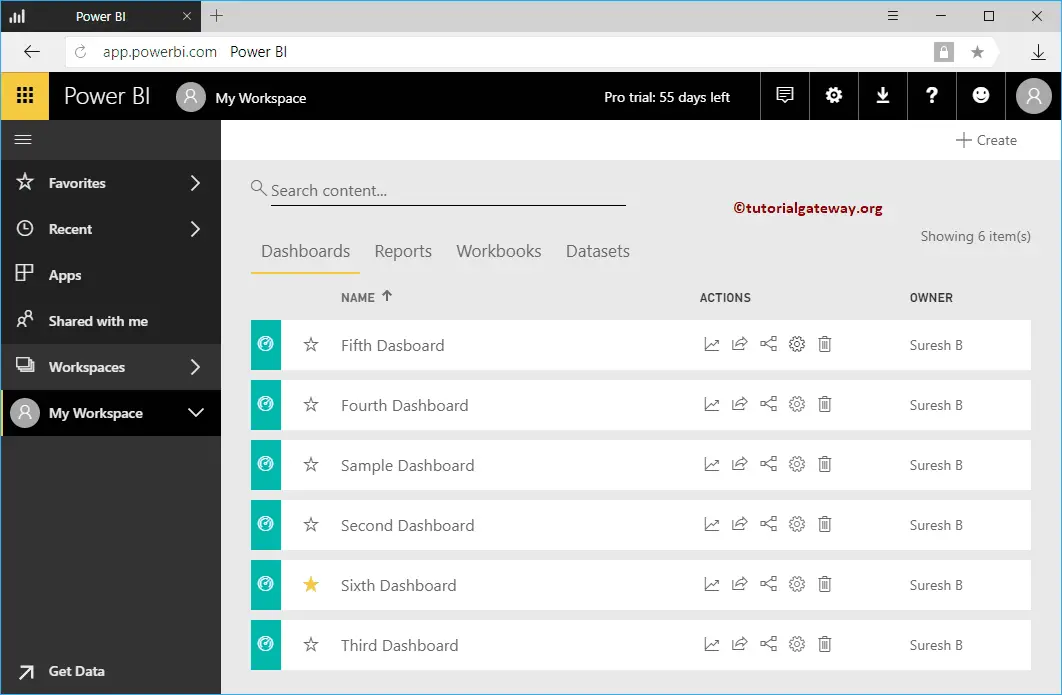
Power BI Dashboard Actions
In this example, we use the Sixth Dashboard to demonstrate the Power BI dashboard actions.
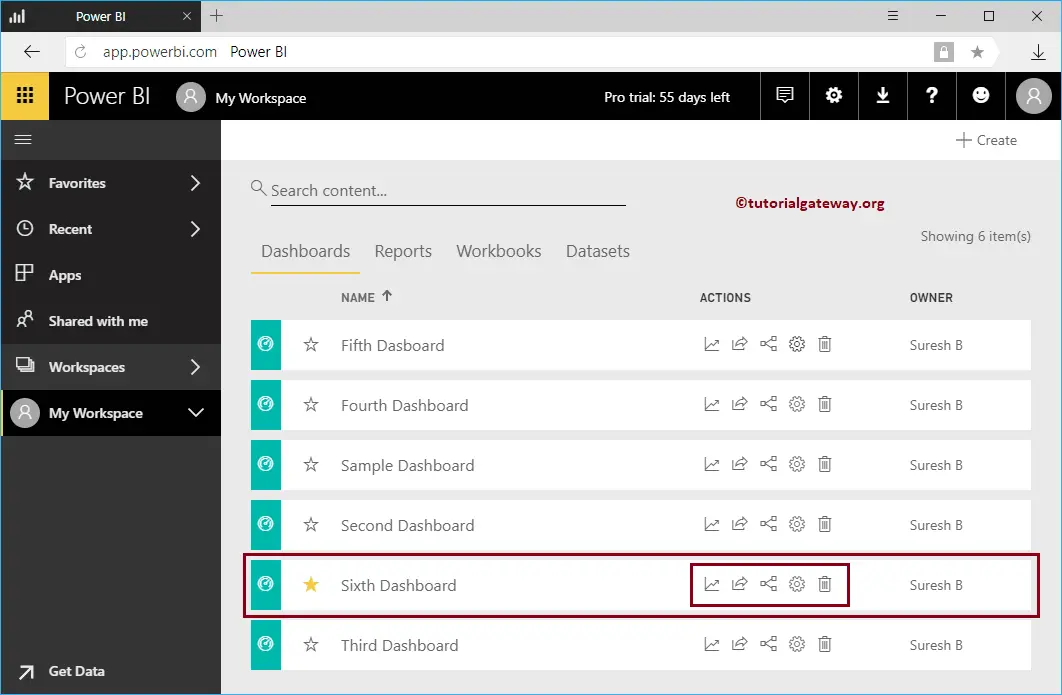
View Usage Metrics Report of a Power BI Dashboard
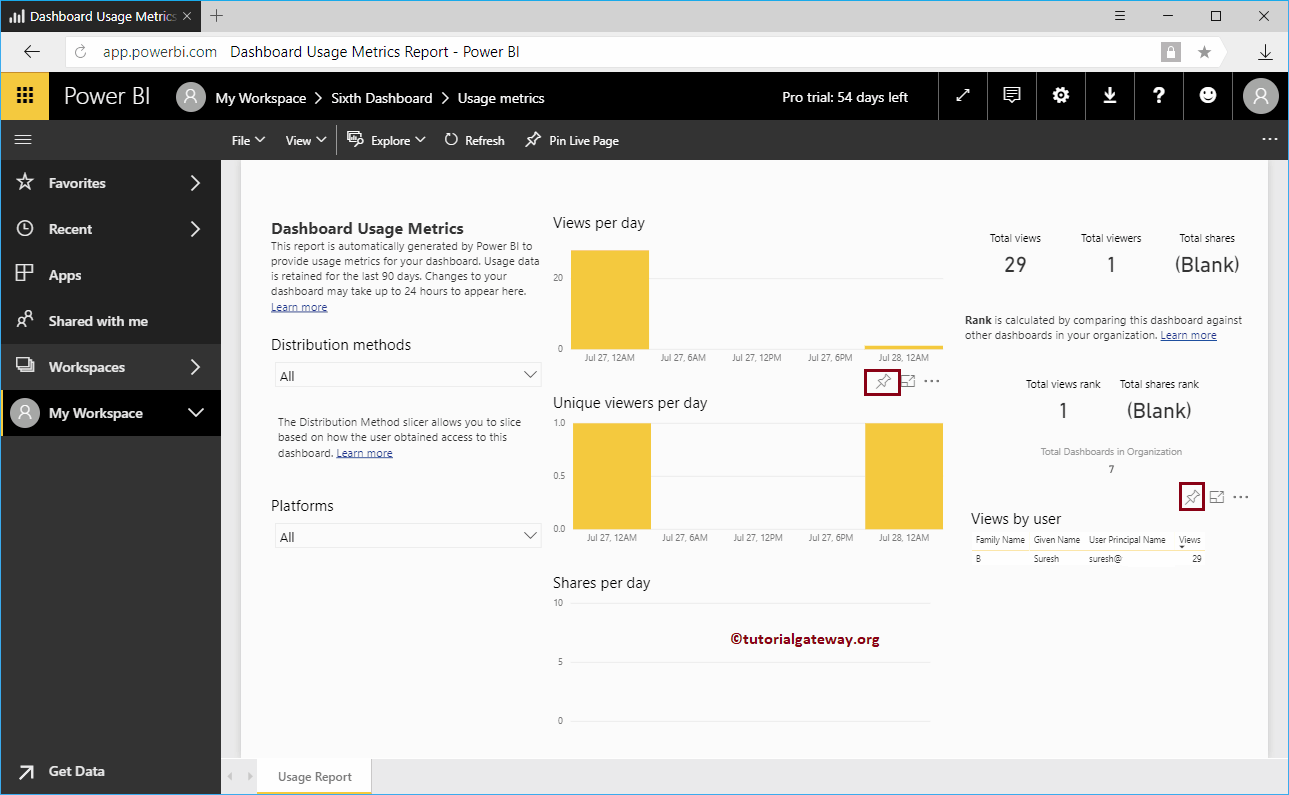
This button helps you to view the usage metric of a Power BI dashboard in a report format. Let me hit that button.
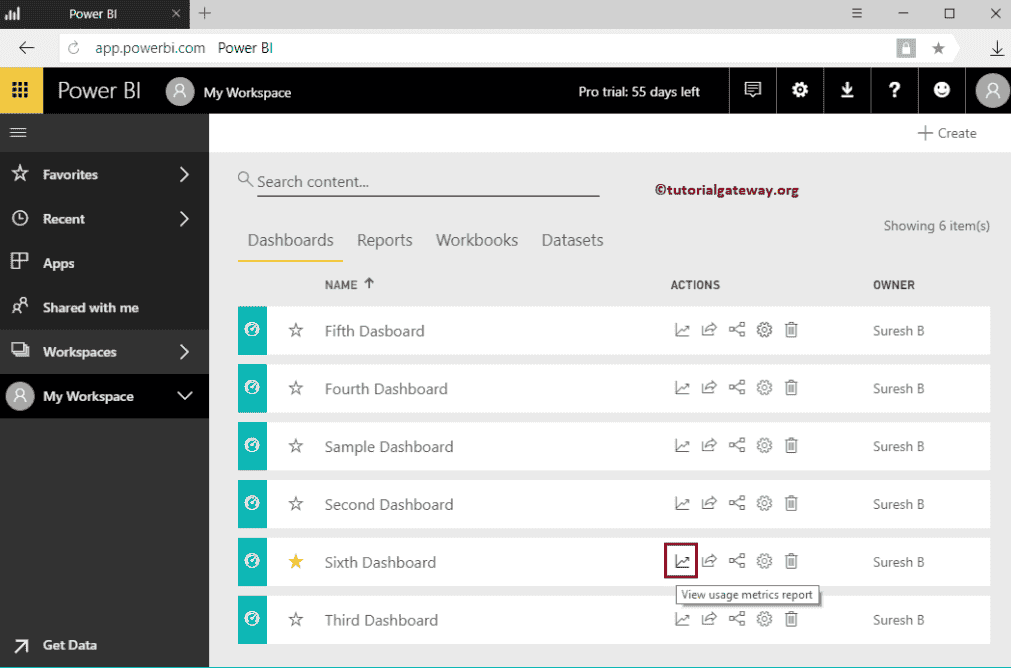
From the screenshot below, you can see the report displaying the Views per day by the user, etc. You can also pin these reports to your main Power BI dashboard.
Share Power BI Dashboard
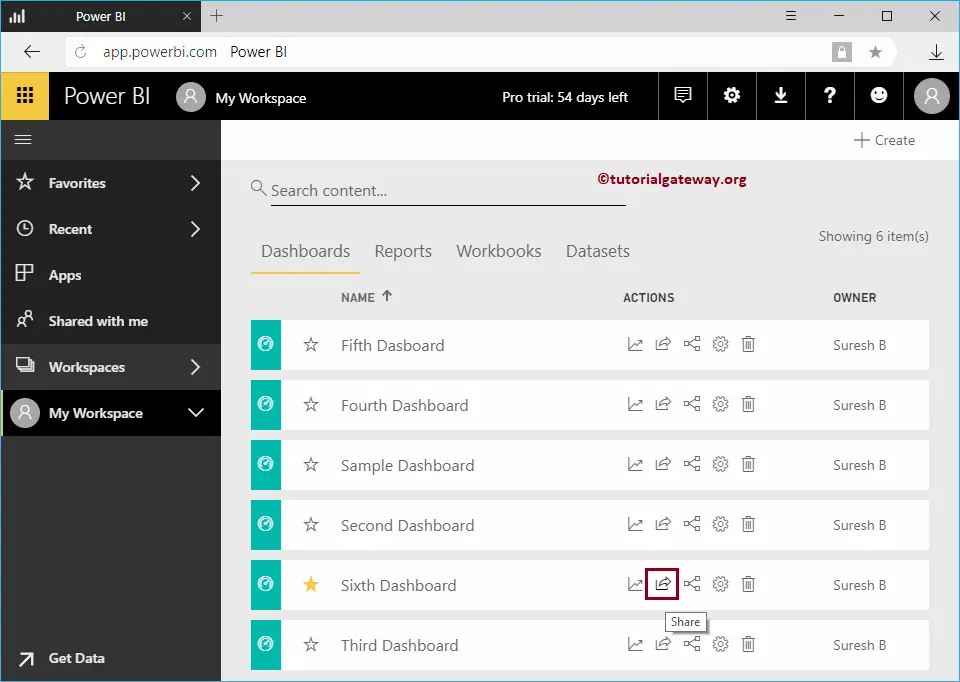
Use this button to share this dashboard across the organization. Let me hit this button.
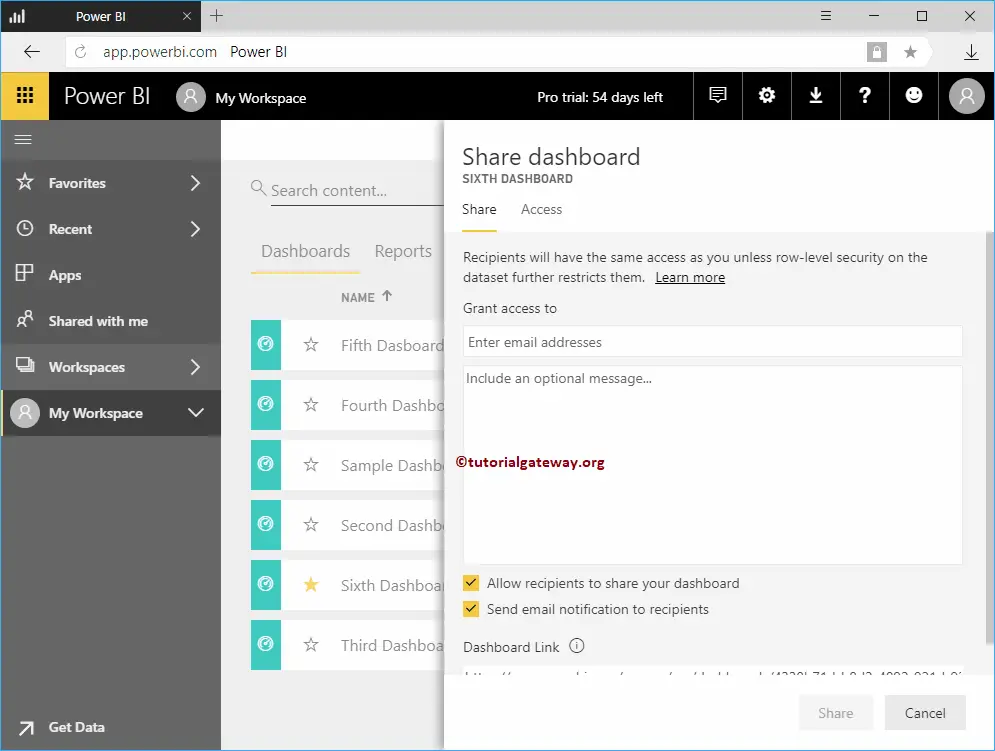
I am clicking the share button to open the following window. I suggest you refer to Share a Dashboard article to understand the options.
View Related Items of a Power BI Dashboard
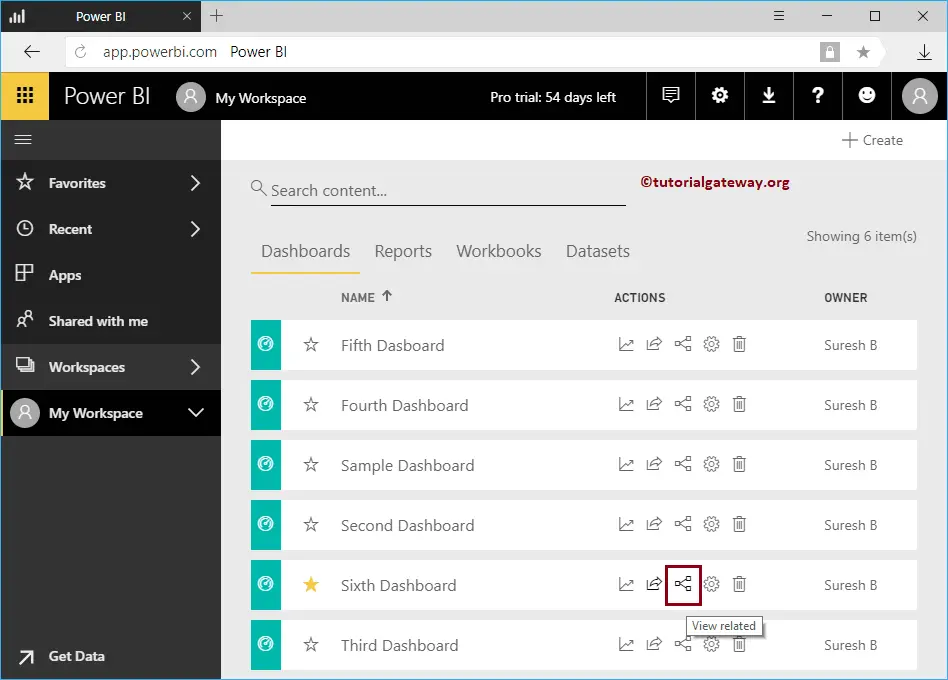
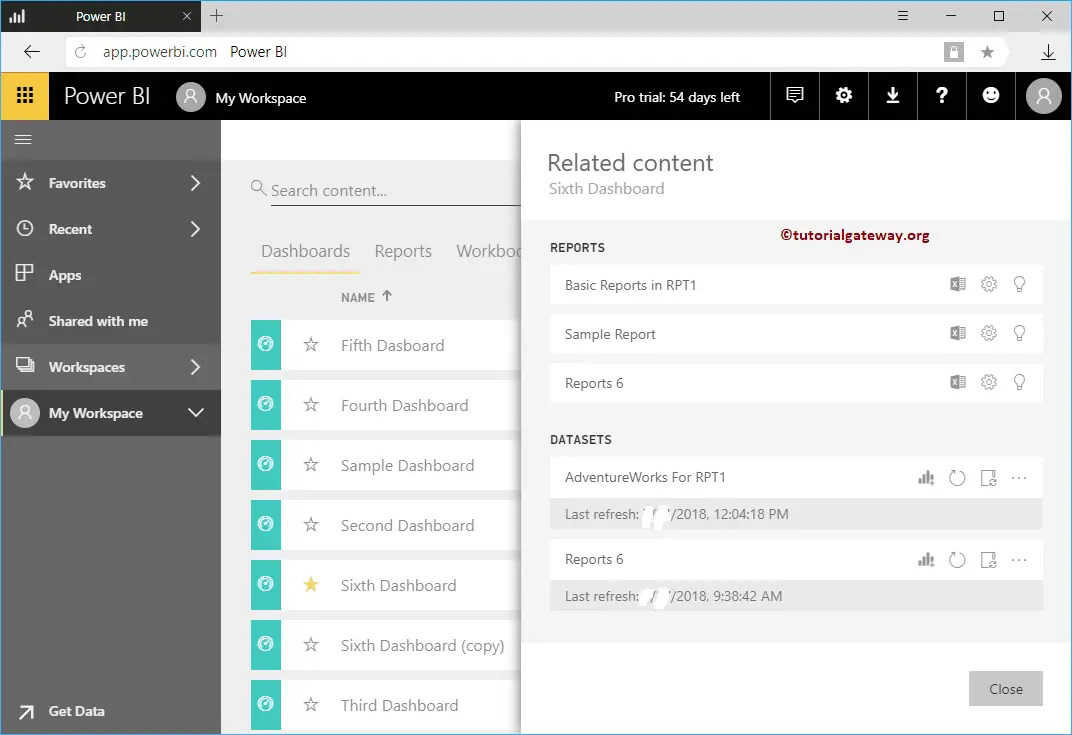
This button helps you see the items that are related (that we used to build this dashboard) to this dashboard.
From the screenshot below, you can see this dashboard created using two datasets and three different reports.
Power BI Dashboard Settings
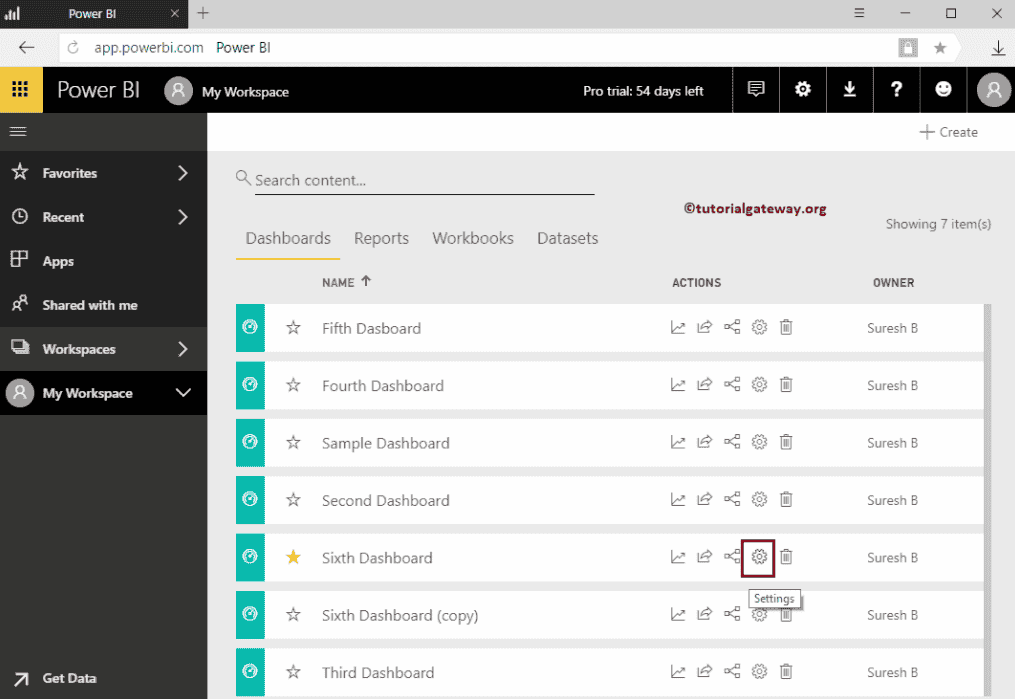
You can alter the Power BI dashboard settings using this option. I suggest you refer to Dashboard Setting’s article under these settings.
Delete Power BI Dashboard
This button helps you to delete the unwanted Power BI dashboard from your workspace. I suggest you refer to Delete a Dashboard article.
