In this article, we will show you how to create Bottom or Top filters in Tableau with examples.
Before getting into this top filters demo, please refer to Filters to understand the basic filtering techniques. For the bottom and top filters in the demo, we will use the data source we created in our previous article. Please visit the Data Labels in Reports article to understand the Data Source.
Top Filters in Tableau
First, Drag and Drop the Sales Amount Measures region to Columns Shelf and English Product Name from Dimension Region to Rows Shelf. By default, Tableau will generate the Bar Chart.
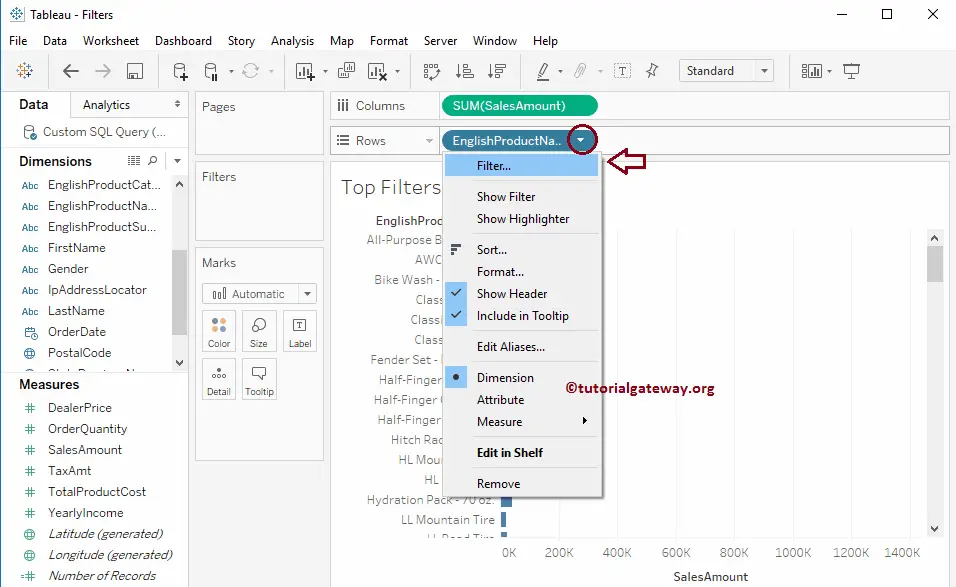
Here, we are going to add a top filter condition on the English Product Name. So, please click on the down arrow beside the English Product Name present in the Row Shelf that will open the menu. Here, you have to select the Filter..option.
Once you select the option, a new window is opened to create a filter.
Tableau Top 10 Filters By Field option
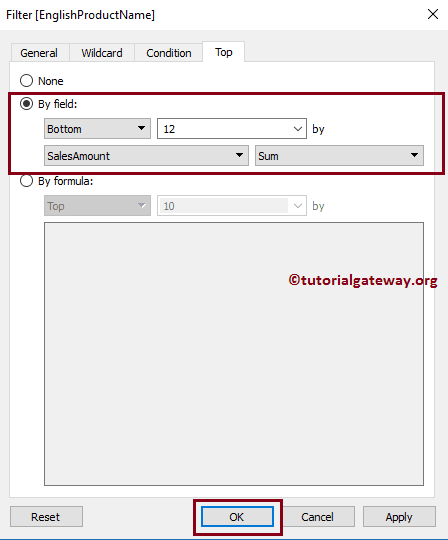
The following is the list of options available in the Top Filters section. Under the By field section, there are four drop-down lists.
First Dropdown List: By default, this will select the Top to perform the top filter. But you can change the field to the Bottom by clicking the down arrow.
Second Dropdown List: By default, this Tableau filter field is filled with the value 10, which means Top 10. But you can change the value by clicking the down arrow. When you click that down arrow, it allows you to enter a new value or create a new Parameter.
Third Dropdown List: By default, this will select the Measure value present in the record. But you can change the field by clicking the down arrow. When you click that down arrow, it displays the Measures and Dimensions present in the data source.
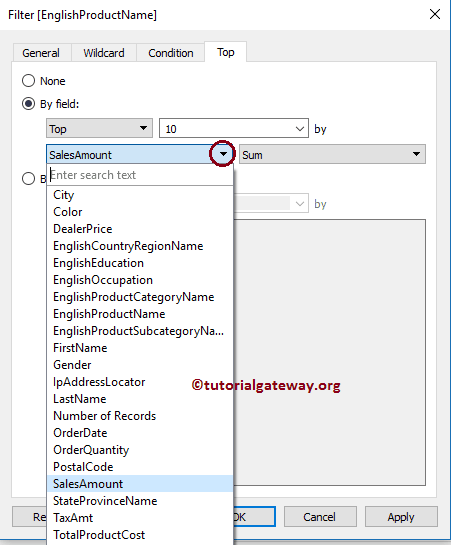
Fourth Dropdown List: By default, this will select the Aggregate Function applied to the Measure value. But you can change the function by clicking the down arrow.
Tableau Top 10 Filter Example
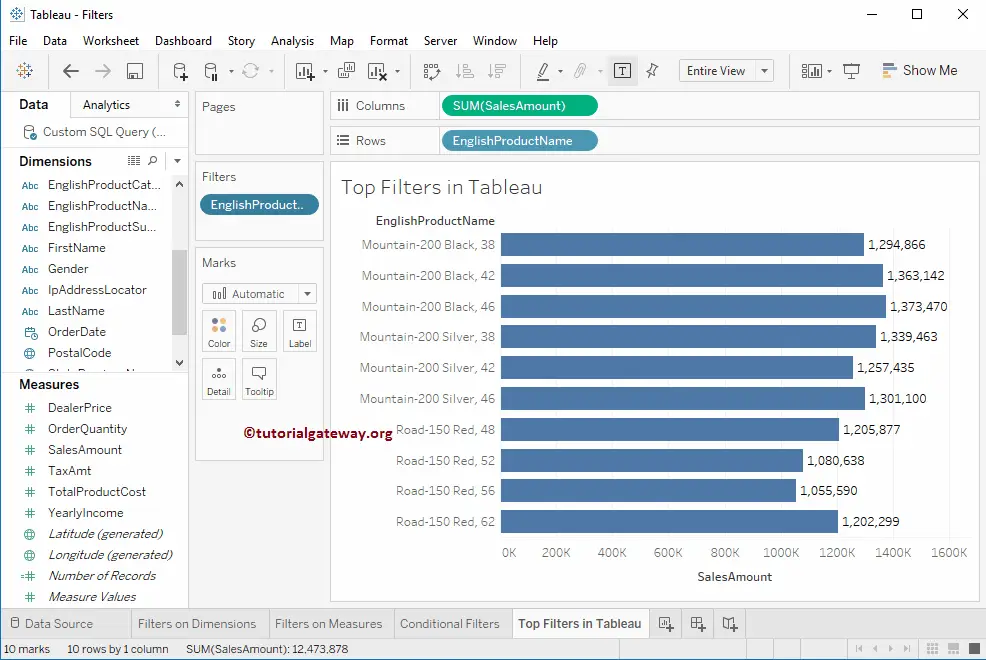
In this example, we use the Top 10 filter to select the top 10 records based on the Sum of the sales amount.
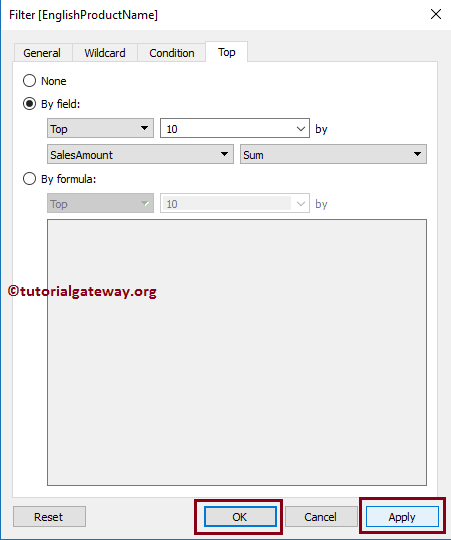
From the screenshot below, you can observe that we are selecting the By field section. Next, we chose the Top, Sales Amount as the condition, and Sum as the Aggregate function. And lastly, we added 10 values in the text box.
The below report displays the Top 10 records according to their Sum of Sales Amount. Or we can say, Top ten records based on their sales amount.
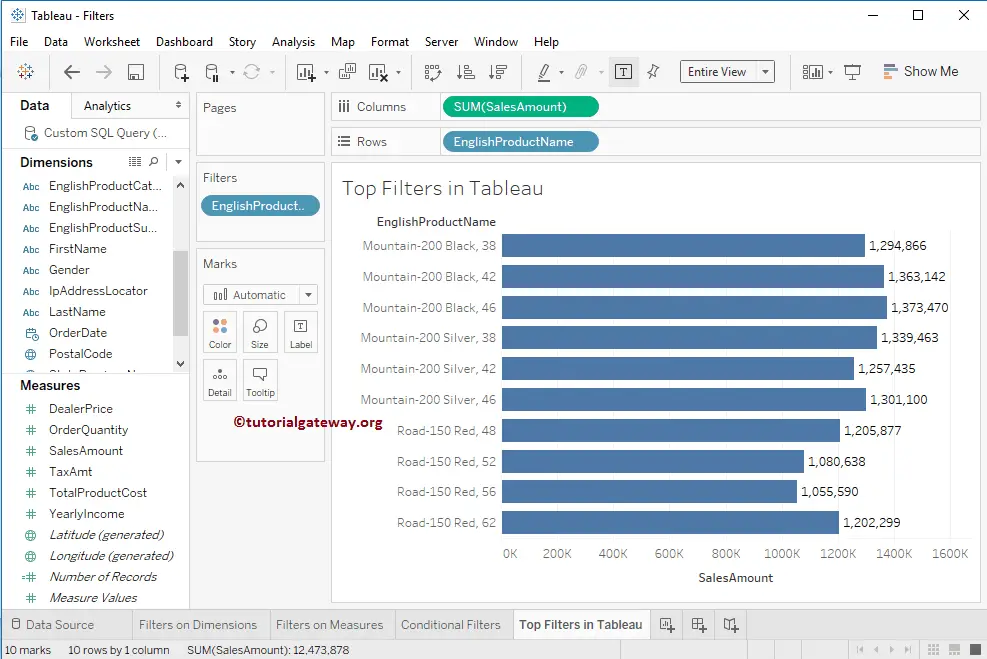
Tableau Bottom 10 Filter
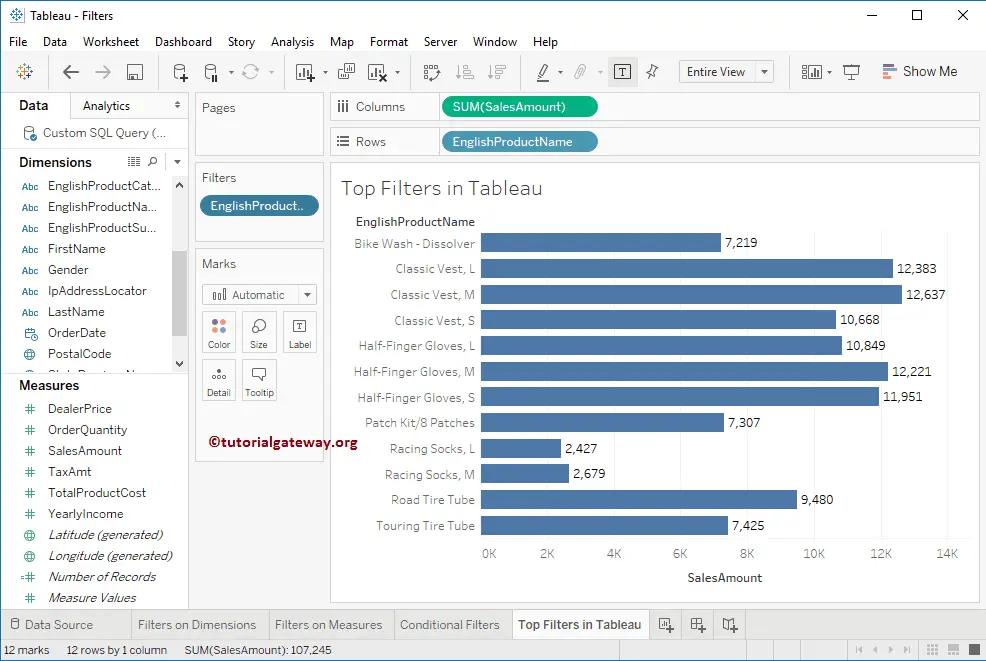
Here, in this example, we use the bottom 10 filters to select the bottom 12 records based on the Sum of the sales amount column.
For this bottom 10 filter example, let me change the Filed option from Top to Bottom and the integer value to 12
The below report displays the bottom 12 records according to their Sum of Sales Amount. Or we can say, Least performing products.
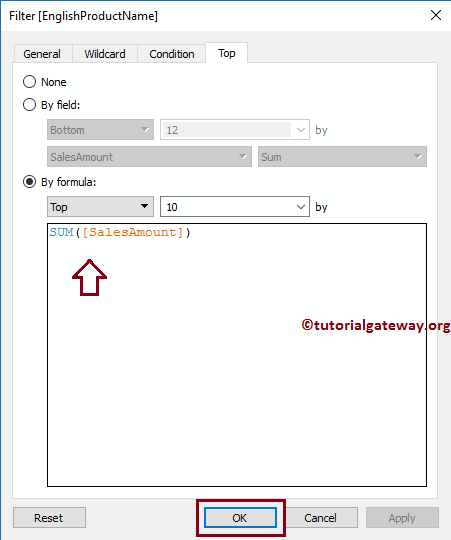
By formula
Here, you can write your own custom and more complex conditions as the Tableau Top Filter condition. While you type any letter in that Top filter Text field, the desktop intelligence will display the list of available options, such as Field Name and function names.
From the screenshot below, you can observe that we had selected the By Formula section. Next, we added the SUM([SalesAmount]) code as the formula.
The below report displays the Top 10 records according to their Sum of Sales Amount. Or we can say, Top ten records based on their sales Amount.