Slicing Filters in Tableau are termed Calculation Filters or Slicers. These are the dimension filters, and we have to apply them to the dimensions field. The behavior of these filters differs for Multi-Dimensional Data Sources compared to the Relational data source.
If we place a dimension on the Filter Shelf, and that Dimension is not present in any other shelf (independent from Rows and Columns), then we can call it the Tableau Slicing Filter. In this article, we will show how to create Slicing Filters with an example.
For this slicing filters demonstration, we are going to use the data source that we created in our previous article. So, please visit the Data Labels in Reports article to understand the Tableau Data Source. Before getting into this, I suggest you refer to Filters to understand the basic filter techniques.
Create Slicing Filters in Tableau
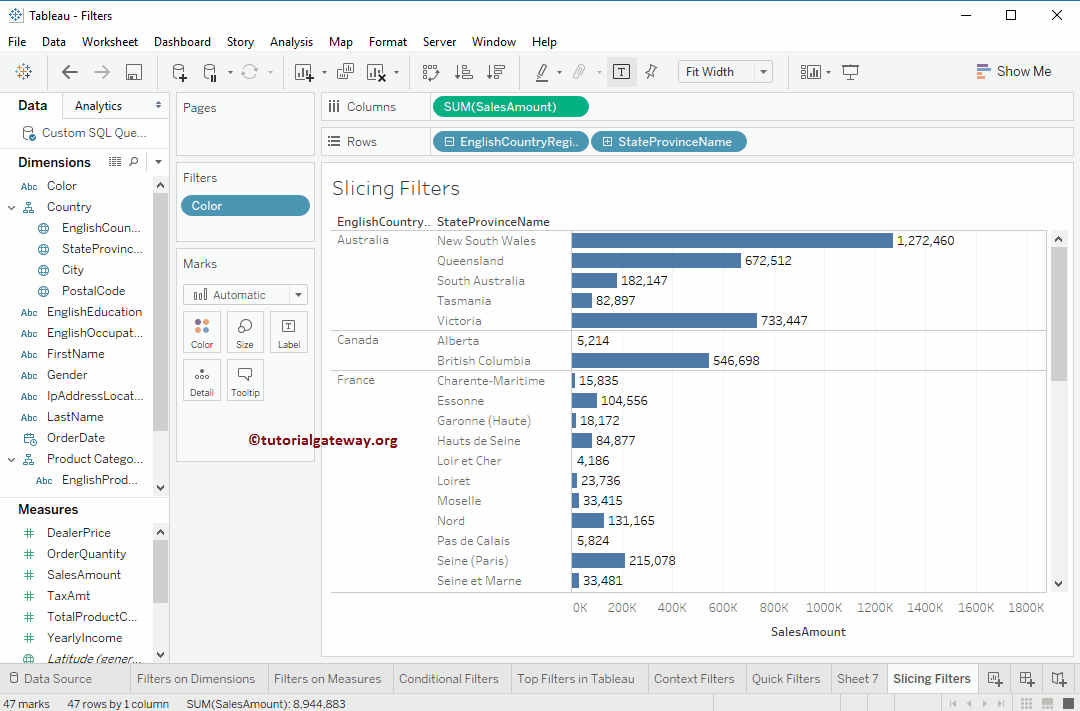
In this example, we want to demonstrate the Slicing filters. For this, first, Drag and Drop the English Country Region Name from the Country Hierarchy present in the Dimension Region to the Rows Shelf and Sales Amount Measures region to the Columns Shelf. By default, it will generate the Bar Chart.
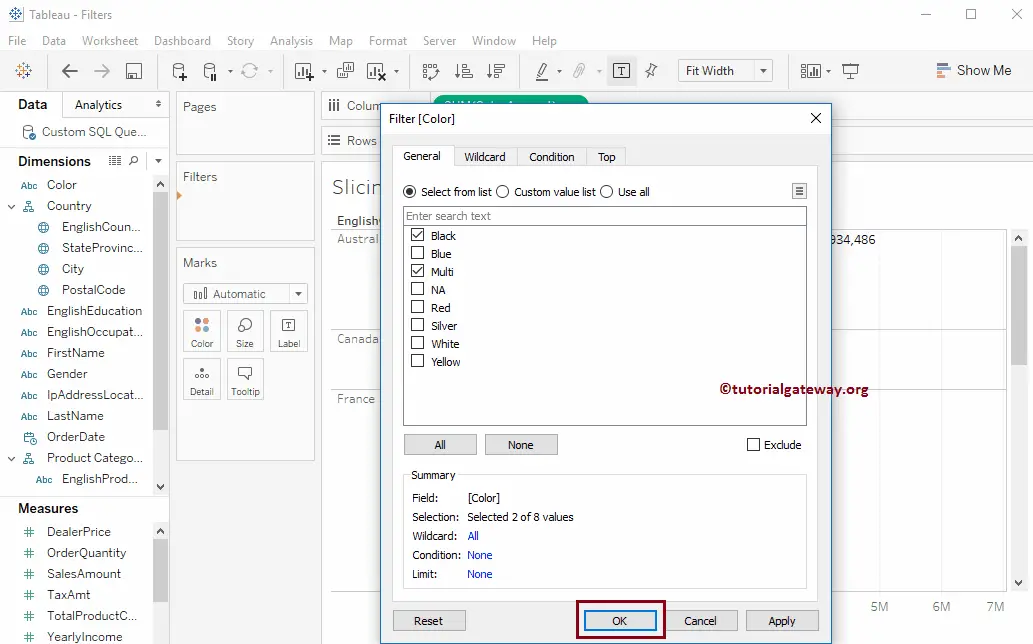
Next, we want to apply filter conditions to the color dimension. And it is not a member of any existing shelf (Marks, Rows, Columns, and Pages). So, drag and drop the Color from Dimension Region to Filters Shelf. Once you drop the Color to Filters Shelf, a new window called Filter will open. Here, we select Black and Multi colors to create Slicing Filters in Tableau.
I suggest you refer to the Filters on Dimensions article to understand the properties in the following window.
From the Tableau Slicing Filters screenshot below, you can observe that the report displays the Sales amount of all the state province names present in the country, whose Color is Black or Multi.
The following is the list of remaining filters.
- Conditional Filters
- Context Filters
- Data Source Filters
- Extract Filters
- Filters on Dimensions
- Filters on Measures
- Quick Filters
- Selection Filter
- Top and Bottom Filters
- Keep and Exclude Filters
- Action Filters
- Parameters
- String Parameters